LINK - Weekly Support Holding the KeyChainlink (LINK) is currently trading around a major weekly support zone, which has acted as an important accumulation area in the past. 📊
📌 As long as this weekly support continues to hold, we will be looking for trend-following long setups, anticipating the next bullish leg to develop.
However, for the bulls to fully take control and kick off the next major impulse movement, a break above the last major high marked in blue is needed. Such a breakout would confirm renewed bullish momentum and increase the probability of a sustained move higher.
As always, rather than buying blindly into support or anticipating the breakout, we will wait for bullish confirmation before considering any long positions.
Will buyers defend this key weekly support and launch the next impulse, or will sellers keep the market trapped? 🤔
⚠️ Disclaimer: This is not financial advice. Always do your own research and manage risk properly.
📚 Stick to your trading plan regarding entries, risk, and management.
Good luck! 🍀
All Strategies Are Good; If Managed Properly!
~Richard Nasr
In-depth trading ideas
LINK | Buying The Dip — Bulls Eye The Liquidity Above!
By analyzing the #LINK (Chainlink) chart on the 2H timeframe, we can see that the broader trend is bullish, and price is now correcting into a high-interest demand area — exactly the kind of pullback I want to buy rather than fear. Let's break it down.
📊 2H Timeframe
On the 2H, the trend shifted bullish with a clean MSS (Market Structure Shift), then confirmed with a BOS, followed by another BOS to the upside — a textbook bullish sequence. After tagging the highs, price is now pulling back in a slightly deeper correction, sweeping the multiple pools of liquidity that had built up along the way.
That correction is currently taking the shape of a small descending trendline. Price is trading around $8.424 , and it has just started reacting from a strong Order Block sitting below the 50% Fibonacci level (the 0.5 at $8.383) — meaning price is reacting from discount, which is exactly where I want to be a buyer. The correction pulled into the golden-pocket area (the 0.382–0.618 zone), tapped demand, and is now showing the first signs of turning back up.
🎯 The Bias
My base case is bullish continuation. The current area is a buy zone as long as price holds above the Protected Low at $8.008 . The trigger I want: a break of the small descending trendline together with a reclaim of the resistance just overhead (the correction level price is pressing into). On that break, the path opens toward the buy-side liquidity (BSL) resting above at $8.758 , with the fib extension confirming the target. In my view, reacting from an Order Block in discount below the 50% is the higher-probability long — but I stay patient for the trendline break to confirm before expecting the push. A decisive break below the Protected Low ($8.008) invalidates the setup.
📰 Fundamental Backdrop
The bullish structure lines up with a genuinely strong — if underappreciated — fundamental backdrop. Price and adoption have been moving in opposite directions: LINK has been grinding near its lows even as Chainlink locks in one of its biggest institutional stretches of the year. Fidelity International's $20 million FILQ tokenized fund went live on Chainlink's infrastructure, DTCC is integrating Chainlink's Runtime Environment into its Collateral AppChain (targeting Q4 2026 production), and active pilots with JPMorgan Kinexys and UBS keep reinforcing the enterprise-adoption narrative. On-chain signals back the accumulation thesis — Santiment data showed LINK adding more than 8,000 non-empty wallets in just five days, the kind of wallet growth near local lows that typically signals accumulation rather than speculation. Seasonality helps too: July has historically been one of Chainlink's strongest months, averaging a 15.8% gain with six of the past eight Julys closing green. The risk to respect: the token still trades below all its major moving averages, remains far below its all-time high, and needs a decisive technical reclaim before sentiment turns firmly bullish — so confirmation matters. But with institutions building and wallets accumulating, the fundamentals align with the bullish technical read.
This analysis will be updated as the market evolves. If this breakdown added value, drop a like 👍 and a comment 💬 to support the work — and share where you see Chainlink heading next! Best Regards, BigBeluga 🐳
Build Your Trading Plan Before Entering the Market
Hello traders,
If you enjoy this analysis, make sure to follow for more market insights and trading strategies.
Wishing everyone green candles and profitable trades. 🚀
---------------------------------
One question always comes up in trading:
✅ Which coin should I trade?
✅ What criteria should I use to select a coin?
At the end of the day, consistent profits come not from perfect chart analysis alone, but from having a solid trading plan and sticking to it.
Before entering any position, you should define three key elements:
1. Investment timeframe (Scalp / Day Trade / Swing / Long-Term)
2. Position sizing
3. Entry and profit-taking strategy
---------------------------------
📌 How to Choose the Right Coin
Fundamentals, utility, and project development are important.
However, what actually moves the price is capital flow and market participation.
That's why understanding where the price is positioned within the larger market structure is often more important than knowing every project detail.
By analyzing the chart, we can determine whether market participants still have confidence in a project.
For example, after a major decline, if a coin is able to establish a base and avoid making new ATL (All-Time Low) levels, it could indicate that selling pressure is gradually being absorbed and investors are still accumulating.
Looking at LINKUSDT as an example:
▶ 4.976 ~ 6.870 Zone
If price holds this support range and shows a clear reaction, the probability of a bullish trend reversal increases significantly.
Therefore, identifying these accumulation zones and waiting for confirmation can provide high-probability trading opportunities.
Newly listed tokens are slightly different.
Following their first major correction, it is common for them to revisit or even create a new ATL once or twice before establishing a long-term bottom.
Risk management remains critical.
---------------------------------
📌 Capital Management
Every trader has a different account size, but one rule applies to everyone:
Always keep at least 20% of your portfolio in cash or stablecoins.
This reserve capital can be used for:
✔ Buying major dips
✔ Taking advantage of new opportunities
✔ Lowering your average entry price
✔ Managing existing positions
If this reserve capital is deployed, make sure to rebuild your cash position as soon as possible.
Running out of liquidity often leads to emotional decisions, FOMO entries, and poor risk management.
---------------------------------
📌 Plan Your Entries and Exits Before Opening a Position
Trading is like a voyage.
A captain doesn't leave the harbor without knowing the destination.
Likewise, traders should determine beforehand:
✔ Where to accumulate
✔ Where to scale out
✔ Where to take profits
A trading plan should be established before entering the market and maintained throughout the life of the trade.
Market volatility is something to react to, not a reason to abandon your strategy.
A temporary pullback shouldn't change the long-term thesis unless the original premise becomes invalid.
---------------------------------
📌 Think Carefully Before Closing 100% of a Position
Whenever possible, avoid fully exiting your position before your primary target is reached.
A full exit means the trade is officially over.
After that, many traders end up chasing price action and re-entering without a clear plan.
If you decide to sell 100% of your position, there should be a strong and objective reason behind that decision.
If the sale was purely emotional, it is often best not to look back at that chart.
---------------------------------
📌 Current LINK Trading Perspective
From a macro market structure perspective,
▶ 4.976 ~ 6.870
remains a major demand zone.
If price finds support and begins showing bullish confirmation within that area, the probability of a trend reversal increases.
For swing traders and long-term investors, this would be a key accumulation area.
Most importantly:
Do not place blind limit orders.
Wait for support confirmation and evidence of a bullish reaction before entering.
---------------------------------
Currently, price is trading near the
▶ HA-Low Zone
Therefore, traders should monitor the
▶ 8.250 ~ 8.382 Range
for support confirmation.
If buyers successfully defend this area, it could provide an attractive long opportunity.
On the upside,
▶ HA-High
▶ DOM (60)
should be considered potential profit-taking zones.
This aligns with a basic trading framework:
✅ Buy between DOM(-60) and HA-Low
✅ Take profits between HA-High and DOM(60)
However, this should be viewed as a tactical execution strategy rather than the overall investment thesis.
---------------------------------
📌 Profit-Taking Strategies
There are generally two ways to take profits:
① Realize profits in cash.
② Sell enough to recover your original investment while keeping the remaining tokens as a "free position."
For swing and long-term traders, the second method can be extremely powerful.
Let's say price moves significantly higher.
Instead of fully exiting, you sell enough to recover your initial capital.
As a result:
✔ Original capital is secured
✔ Remaining tokens become pure profit
The remaining position effectively has a zero cost basis.
This creates a strong psychological advantage, allowing you to hold through volatility with far less stress.
For long-term crypto investing, this can be one of the most effective profit-taking methods.
---------------------------------
📌 Key Trend Reversal Level
A major bullish trend is more likely to begin if price can break above and hold:
▶ 11.064
Therefore, the final major accumulation opportunity can be viewed around this level.
---------------------------------
📌 Primary Target Zone
From a higher timeframe perspective, the expected target range remains:
▶ 20.111 ~ 25.782
Any price movement beyond this area should be treated as an overextension or bonus-profit zone.
Therefore:
▶ 4.976 ~ 11.064
should be considered the primary accumulation range.
Once your core position has been built, shorter-term trading strategies such as day trading or swing trading can be used to generate additional gains while maintaining the core position.
---------------------------------
📌 Track Your Core Average Entry Price Separately
After completing your core accumulation phase, record your actual average entry price separately.
Why?
Because repeated short-term trades will alter the average cost displayed by the exchange.
Although your core position may remain unchanged, exchange-reported averages can become distorted.
This can significantly affect trading psychology.
For that reason, it is highly recommended to track:
✅ Core Position Average Price
✅ Trading Position Average Price
as separate metrics.
---------------------------------
📌 Final Thoughts
Great chart analysis alone does not guarantee profits.
Without a clear strategy and proper execution, even the best market analysis can fail to produce consistent results.
The real question is not:
"What should I buy?"
The real question is:
"How will I manage the trade after I buy?"
Create your big-picture trading plan before entering the market.
Stay disciplined during volatility.
Trust the process.
In the long run, a well-executed strategy will always outperform emotional decision-making.
---------------------------------
Thank you for reading.
Wishing everyone disciplined risk management, successful trades, and many green candles ahead. 🚀📈
DYOR. Manage risk. Trade responsibly.
---------------------------------
LINKUSDT 15JULChainlink remains the leading oracle network in the crypto market, making it one of the most closely watched projects from both a fundamental and technical perspective. Let’s take a look at the current chart structure.
At the time of this analysis, LINK is trading around $8.30. Price is showing signs of underlying demand, suggesting buyers are still defending higher levels. If the broader market, particularly Ethereum, continues to strengthen, LINK could also benefit from improving market sentiment.
The first key resistance to monitor is located around $8.60. A confirmed breakout above this level could open the door for a move toward the $10.00 area, which represents the next significant technical objective.
That said, it’s important to keep the bigger picture in mind. In my view, the current move is still part of a broader corrective rally within a larger bearish market structure. If this scenario remains valid, the recent strength may eventually be followed by renewed downside pressure, with the sub-$6.00 region becoming a level to watch in the future.
As always, this is a technical analysis based on current market structure rather than a prediction of guaranteed outcomes. Always wait for price confirmation and apply proper risk management.
Follow for future updates as this setup develops.
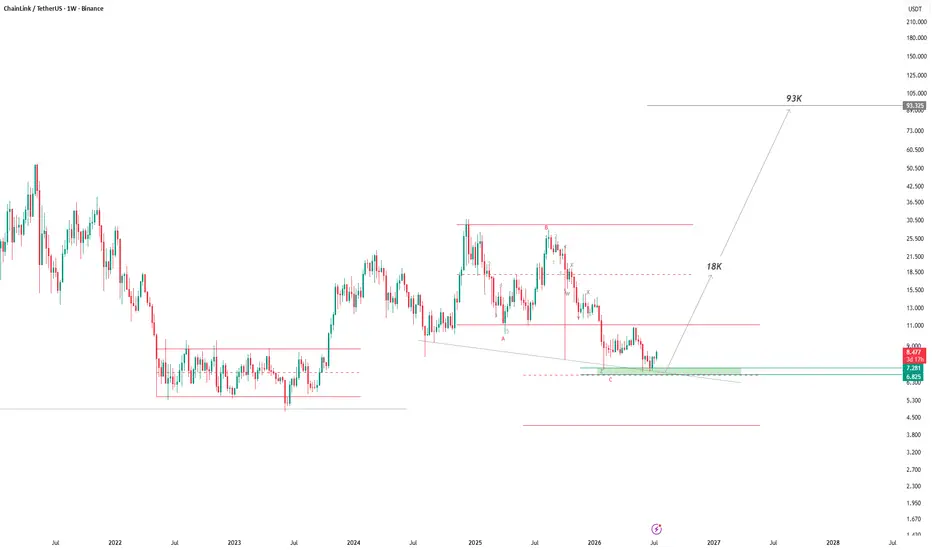
LINK: Multi-Month Range AccumulationLINK: Multi-Month Range Accumulation – All-Time High Breakout Scenario Based on Historical Cyclicality
Chainlink (LINK) displays no radical departure from our prior technical outlook as the price action continues to move inside a tightly compressed range between $7
.00 and $11.00. This prolonged sideways consolidation is hovering near the final stage of a macro downtrend. In market dynamics theory, the longer a tight accumulation range persists, the more potent the stored kinetic energy becomes for the subsequent volatility expansion.
Based on the visual data from the weekly chart , LINK's historical cyclicality exhibits striking structural similarities. During the previous two range-bound compression phases, which lasted 13 months and 17 months respectively, the market unlocked massive, vertical expansion waves immediately upon resolving the consolidation boundaries.
Currently, the single best and safest strategy is to exercise patience and await a decisive market trigger. A confirmed Long execution signal targeting a potential new all-time high (ATH) extension will officially materialize once a weekly candle closes decisively above the $10.00–$11.00 resistance ceiling. While nimble traders could theoretically scalp short-term swings by buying support and selling resistance, this approach is not recommended due to suboptimal risk-to-reward parameters.
Disclaimer: This is not financial advice, DYOR.
$LINK held its $8.523–$8.542 support zone during this pullback.BINANCE:LINKUSDT pulled back into a support zone at $8.523–$8.542 after its recent uptrend, held it, and is now trading back around $8.65 — a clean support-hold setup on the 1H.
📰 Chainlink's institutional footprint keeps growing: a partnership with dozens of European and South Korean banks on stablecoin-based FX settlement, plus DTCC's new blockchain collateral platform integrating Chainlink for 24/7 automated collateral management. LINK is up roughly 3.7% over the past 7 days, outperforming the broader crypto market.
📊 Bias: Bullish — support held, and the institutional adoption backdrop supports continuation rather than a reason to fade the bounce.
🎯 Trade Levels:
📍 Entry Zone: $8.523 – $8.542
🛑 Stop Loss: $8.493 (-0.6% | cap risk at 1–2% of account)
🎯 TP1: $8.649 (+1.2% | ~2:1 RR)
🎯 TP2: $8.793 (+2.9% | ~5:1 RR)
📐 Overall R:R: ~3.5:1 blended
🧠 Chart read: Price rallied, pulled back cleanly into a defined demand zone, and held it without a deep wick violation — that's a healthier retest than a sharp spike-and-reverse. Losing $8.493 would break that structure and invalidate the long thesis.
🛡️ Risk note: The stop here is tight relative to the targets, which is good for R:R — but tight stops also mean normal volatility can tag you out. Don't widen the stop after entry just because price wobbles; if $8.493 breaks, the trade is wrong, not "almost right."
📚 One thing worth knowing: a support zone that's been tested and held once is not automatically stronger the second time — sometimes it's weaker, because more of the buying interest that defended it the first time has already been used up. Don't treat "it held before" as proof it'll hold again.
Held the zone, or did you miss this one? 👇
#LINK #Chainlink #CryptoTrading
LINK USDT SHORT SIGNAL#115. LINK/USDT – Trade Setup (SHORT)
📈 Position Type: SHORT
🕒 Timeframe: 1H
📊 Market: Futures
💰 Entry Zone:
8.477
🛑 Stop-Loss:
8.777
🎯 Take-Profit Targets:
• TP1:
• TP2: 0.1811
• TP3: 0.1768
• TP4:
⚙️ Leverage:
5 *10
▫️ After TP1, move SL to Entry + 0.2%.
▪️ Exit Plan:
• 50% at TP1
• 25% at TP2
• 25% at TP3
📌 Risk Management:
Risk only 1–2% of your capital per trade.
⚠️ Always check and confirm the setup on your chart before entering the trade.
LINK: local squeeze with $9.830 destinationThe Macro Picture 🗺️
LINK unwound from the $10.870 macro ceiling into a summer base and has reclaimed $8.629, holding above the $8.184 local low. Price is coiling in the upper half of the range with higher lows behind it — a base rebuilding, not a breakdown.
The Setup ⚙️
The Range Floor 🟢
$8.184 (Local Low) is the demand shelf the recovery is built on, with $6.987 (Macro Support) as the deeper backstop. As long as $8.184 holds, the bid stays intact.
The Decision Point 🔴
$8.979 (Local High) is the gate. A daily close above it flips the local structure bullish and opens the path to the $9.830 measured-move target.
The Roadmap 🛣️
Hold above $8.184 → break $8.979 → run toward $9.830. Invalidation is a clean daily close below $6.987 — that breaks the range.
This is a GRID Range Play: a defined band to rotate, buying the lower half and scaling out into the breakout.
More setups in profile.
#LINK #Chainlink #crypto #trading #TA #3Commas #GRID
#LINKUSDT D#LINKUSDT D
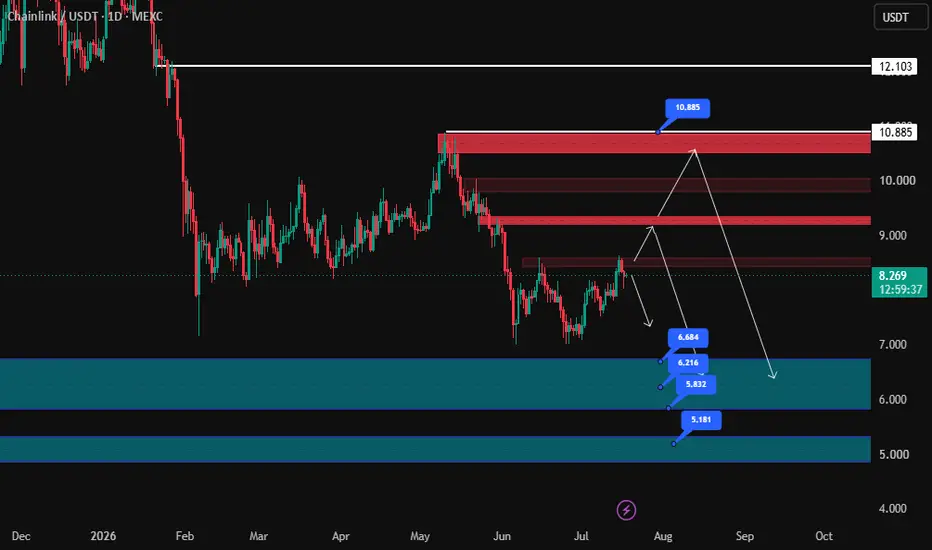
We're seeing several bearish setups forming on **LINK**.
If price reaches any of the red supply zones and gives a valid confirmation, you can look for short opportunities.
The darker red zones carry more weight and are considered higher-probability areas.
The short-term downside targets are the blue demand zones.
We can only consider the long-term trend to have turned bullish if price engulfs the **$10.890** level and successfully establishes acceptance above it.
Until then, the market structure remains bearish, and the FTR setups continue to offer the higher-probability short opportunities.
BIST:LINK
LINKUSDT - Descending Trendline, Ready for a Breakout?📊 Technical Analysis
💰 💵 Coin: BIST:LINK #LINKUSDT
⏳ Time Frame: 2D
📉 Pattern: Descending Trendline (Long-Term Resistance)
🔍 Chainlink (LINK) is still trading below a long-term Descending Trendline, which has acted as a dynamic resistance since the major price peak. This trendline has rejected multiple bullish attempts, making it one of the most important technical levels to watch.
📈 At the moment, the price is approaching the trendline once again after bouncing from the major low around 6.99 USDT. If buying pressure continues to increase and LINK successfully breaks above this trendline, the probability of a bullish trend reversal will rise significantly. 🚀
⚡ In addition, several horizontal resistance levels are positioned above the current price, which could serve as the next upside targets after a confirmed breakout.
---
🎯 Resistance Levels
🟡 9.80 USDT ➜ Initial resistance after the breakout.
🟡 10.70 USDT ➜ Mid-level resistance and confirmation zone for bullish continuation.
🟡 11.90 USDT ➜ Strong supply area.
🟡 14.30 USDT ➜ Major upside target if bullish momentum continues. 🚀
---
🛡️ Support Level
🟢 6.99 USDT ➜ The key support level. As long as this area holds, the possibility of a rebound remains intact. 💪
---
🟢 Bullish Scenario (65% Probability) 🚀
✅ LINK successfully breaks above the Descending Trendline and closes above it with increasing trading volume. 📈
If the breakout is confirmed, LINK could continue its upward movement toward:
🎯 Target 1: 9.80 USDT
🎯 Target 2: 10.70 USDT
🎯 Target 3: 11.90 USDT
🎯 Target 4: 14.30 USDT
💹 The stronger the breakout volume, the higher the probability of a trend reversal from bearish to bullish in the medium term.
---
🔴 Bearish Scenario (35% Probability) 📉
❌ If LINK gets rejected once again at the Descending Trendline and fails to maintain bullish momentum, selling pressure could return.
⚠️ If the 6.99 USDT support level is broken, the price may continue declining and form a new Lower Low before finding the next demand zone.
📌 As long as LINK remains below the Descending Trendline, the medium-term trend can still be considered bearish.
---
📚 Pattern Explanation: Descending Trendline 📉
A Descending Trendline is a downward-sloping resistance line formed by a series of Lower Highs, indicating that sellers continue to dominate the market.
✨ Pattern Characteristics
📉 Indicates strong seller dominance during a downtrend.
📈 A breakout above the trendline often signals the beginning of a momentum shift.
📊 Increasing volume during the breakout strengthens the validity of the signal.
⚠️ A breakout without strong volume carries a higher risk of becoming a False Breakout.
🔥 On this chart, the Descending Trendline has acted as resistance multiple times, making a successful breakout a significant technical signal to monitor.
---
📌 Conclusion
🔍 LINK is currently approaching a critical technical level, testing its long-term Descending Trendline once again.
🚀 A confirmed breakout could open the path toward 9.80 – 14.30 USDT.
📉 On the other hand, another rejection from the trendline could send the price back to retest the 6.99 USDT support zone.
⚠️ Always wait for breakout confirmation, monitor trading volume, and apply proper risk management before making any trading decisions.
---
#LINK #LINKUSDT #Chainlink #Crypto #Cryptocurrency #Trading #TradingView #TechnicalAnalysis #PriceAction #DescendingTrendline #TrendlineBreakout #Breakout #Bullish #Bearish #Altcoins #CryptoTrading #SupportResistance #MarketAnalysis
$LINK is trading near $8.50, but the real opportunity sits......BINANCE:LINKUSDT is trading near $8.50, but the real opportunity sits at the $8.384 demand zone that most traders are overlooking.
Most traders freeze when price pulls back into support.
This setup rewards patience—not emotion.
📰 24H NEWS SNAPSHOT
No major protocol announcement has been released in the last 24 hours. However, market attention has shifted toward continued whale accumulation while LINK tests a critical technical level, reinforcing a constructive medium-term outlook. @chainlink remains one of the strongest institutional infrastructure projects in crypto.
📊 MARKET BIAS
🟢 Bullish — Price continues respecting a well-defined buying order block while maintaining a higher-low structure.
🎯 TRADE LEVELS
📍 Entry Zone: $8.330 – $8.385
🛑 Stop Loss: $8.284
(-1.19% | Risk no more than 1% of portfolio)
🎯 TP1: $8.600
(+2.58% | 2.2:1 RR)
🎯 TP2: $8.884
(+5.96% | 5.0:1 RR)
📐 Overall Risk:Reward: ~5:1
🧠 CHART ANALYSIS
The 1H chart shows LINK breaking impulsively from accumulation before consolidating above the previous resistance.
The highlighted $8.330–$8.385 buying order block is now acting as support. As long as buyers defend this area, the probability favors continuation toward $8.600 and potentially $8.884.
A clean close below $8.284 invalidates the setup and shifts momentum back to sellers.
🛡️ RISK MANAGEMENT TIP
Don't enter after a large green candle. Let price revisit the demand zone and confirm buyers before committing capital.
Even a great setup can fail if risk management is ignored.
📚 EDUCATIONAL NUGGET
Many traders focus only on breakout candles.
Professional traders often wait for the retest of the order block, where risk is smaller and reward is significantly better.
Most traders freeze because they fear buying the pullback.
Don't freeze. The order block already told you what to do.
💬 Would you take the retest at $8.384 or wait for a breakout above $8.600? Drop your view below. 👇
#Chainlink #LINK #CryptoTrading #TechnicalAnalysis #PriceAction #CryptoSignals #Altcoins #Binance
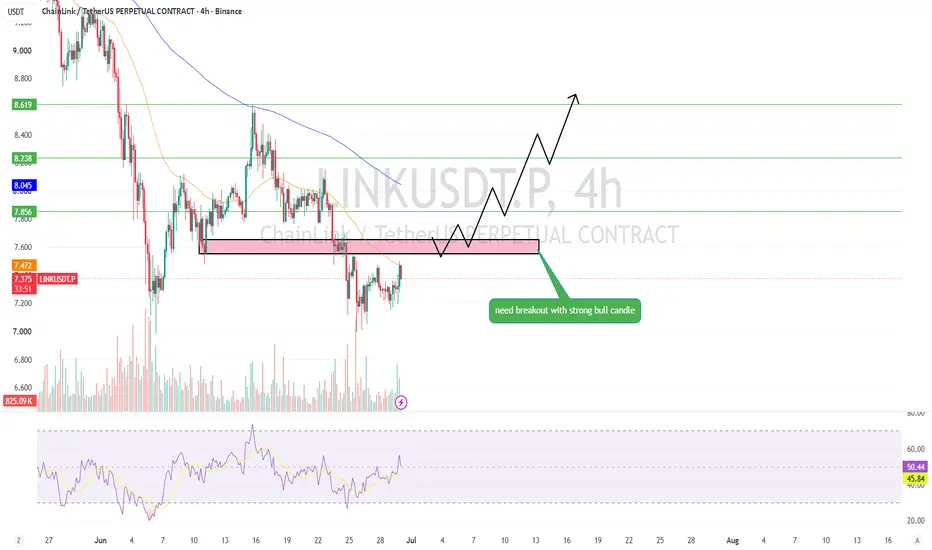
LINKUSD Will touch 8$ ??📊 LINK Update
LINK is sitting right below an important resistance zone. The price is showing some strength, but I'm not interested in entering a long trade before the market proves that buyers are in control.
For me, a long setup needs a few things first. I want to see a strong 4H candle close above this resistance, followed by good buying volume. After that, I want price to retest the breakout level and hold it as support before buyers step back in.
If those conditions are met, LINK could have a chance to move toward $7.85, then $8.24, and potentially $8.62. Until then, patience is the best strategy !
LINK: Final Stage of Macro DowntrendLINK: Final Stage of Macro Downtrend – Building the Foundation for a New All-Time High Cycle
Chainlink is drawing remarkably close to a historic technical turning point on the macro timeframe as selling pressure shows clear signs of exhaustion. Observing the visual weekly data on chart , LINK has completed a comprehensive downward structure. According to trading theory, once the price action repeatedly tests and rejects from the third touch onward against a descending trendline, the bears' selling momentum is largely depleted, opening the door for accumulative buying demand to resurface.
The standout highlight demands close attention is the cyclicality embedded within this asset's price behavior. Historical data reveals that LINK previously underwent two sideways consolidation phases lasting over a year (13 months and 17 months) before triggering phenomenally powerful growth rallies. Currently, the price action has been compressing within a sideways range for roughly 5 months. If this historical cycle repeats in sequence, LINK's definitive breakout window will highly likely align with early 2027.
Since the current price compression sits at the tail end of a major macro downtrend, the underlying accumulation momentum possesses substantial potential. Once broader market synergy aligns and buying volume triggers, this cycle could fully provide the necessary leverage to propel LINK into an aggressive expansion phase toward a fresh all-time high (ATH).
Disclaimer: This is not financial advice, DYOR.
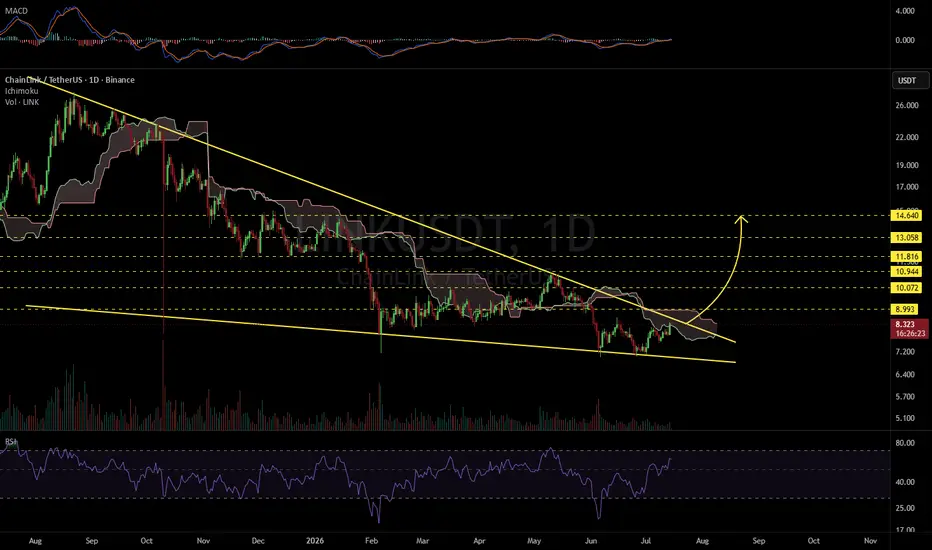
LINKUSDT 1D#LINK is moving inside a falling wedge pattern on the daily chart. It is currently facing a key resistance zone formed by the Ichimoku cloud and the wedge resistance.
In case of a breakout above these levels, the potential upside targets are:
🎯 $8.993
🎯 $10.072
🎯 $10.944
🎯 $11.816
🎯 $13.058
🎯 $14.640
⚠️ Always remember to use a tight stop-loss and maintain proper risk management.
LINK: Bulls Heading Towards a Key Decision ZoneResistance Meets the EMAs
Chainlink has recovered well from the $7.00 support zone but is now testing the first major resistance around $8.60. This area is made even more significant by the 100/50-Day EMAs, which remain bearishly crossed and are acting as additional resistance.
Bulls Need a Convincing Break
A decisive move above $8.60 would strengthen the short-term outlook and suggest the recovery has further room to run. Until then, this remains a key decision zone where previous rallies have struggled to gain traction.
Bull Trap Risk Remains
While the recent recovery is encouraging, bulls should remain aware of the possibility of a bull trap or liquidity sweep before any sustained breakout develops. False breakouts around major resistance are common, particularly while the broader trend remains uncertain.
Momentum Improving, But Confirmation Needed
Momentum has improved from the recent lows, but confirmation will come from price rather than indicators alone. A clean break above resistance would shift the balance further in favour of the bulls, while rejection would keep the bears in control of the short-term trend.
Summary
Chainlink has reached an important technical crossroads. A convincing break above $8.60 would be a meaningful bullish signal, but until that happens, resistance, the bearishly crossed EMAs, and the risk of a false breakout all suggest caution remains warranted.
#LINKUSDT: A Major Move In Making, Get Ready! $30🔺LINKUSDT is currently in an accumulation phase suggesting a distribution is likely imminent. A bullish impulse move is highly probable. Entry and exit zones along with a take profit area are clearly marked.
🔺It is important to note that trading cryptocurrency is highly risky. Conduct your own research and always manage your risk. When considering a long position on this pair volume is crucial. Wait for the price to reach the entry zone once it is trading there. Monitor both volume and price momentum as these are key indicators.
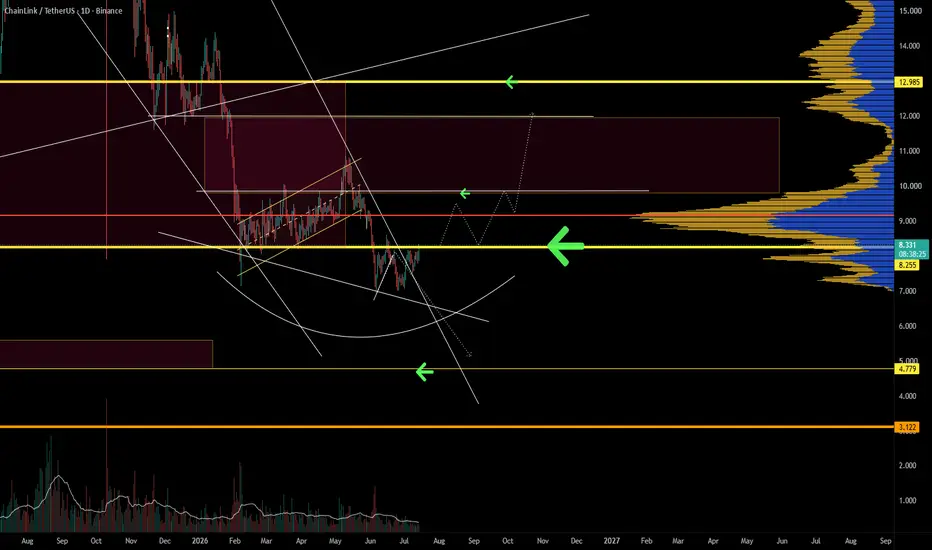
Chainlink TAChainlink is showing early signs of a potential trend reversal after bouncing from the recent lows and reclaiming an important daily pivot. Price is now pressing into the descending trendline that has controlled the market since the May breakdown.
The main obstacle is the high-volume resistance zone overhead. This area previously acted as support and now represents a major supply cluster. A clean breakout and daily acceptance above it would strengthen the rounded-bottom structure and open the door for a larger recovery into the upper supply zone.
The Synergy Signal oscillator is improving, with momentum expanding, the histogram turning positive, and the faster signals pushing higher. However, short-term momentum is becoming extended, so a pullback or consolidation before continuation would be healthy.
For now, the setup is improving, but the broader reversal is not confirmed until LINK breaks the descending structure and reclaims the heavy volume area above. Losing the newly reclaimed pivot would weaken the setup and place the recent lows back in focus.
LINK USDT SHORT SIGNAL#93.LINK /USDT – Trade Setup (SHORT)
📈 Position Type: SHORT
🕒 Timeframe: 1 H
📊 Market: Futures
💰 Entry Zone:
7.980
🛑 Stop-Loss:
8.191
🎯 Take-Profit Targets:
• TP1: 7.878
• TP2: 7.750
• TP3: 7.627
• TP4: 7.458
TP5:
TP6:
⚙️ Leverage:
5- 10
⚠️ After reaching TP1, move Stop-Loss to Entry Price.
📌 Risk Management:
Risk only 1–2% of your capital per trade.
Always confirm the setup on your chart before entry
LINK Approaches Breakout ZoneChainlink (LINK) is trading within a key technical region, where price is compressing into an equilibrium between major support and resistance. This tightening range has created an apex zone, suggesting that a decisive breakout is likely to occur in the immediate short term as volatility begins to contract.
Currently, LINK is holding above daily support while remaining below an important daily resistance, leaving the market without a clear directional bias. Although the direction of the breakout has yet to be confirmed, a sustained move higher will require strong bullish volume and buying pressure to overcome the overhead resistance and shift the local market structure in favor of the bulls.
The most important support to monitor is around the $7.40 region, where the Value Area Low (VAL) aligns with the 0.618 Fibonacci retracement. This creates a strong area of technical confluence that buyers need to defend to maintain the current bullish outlook.
As long as LINK continues to hold above this support zone, the probability favors a bullish breakout from the current apex structure. A successful breakout would increase the likelihood of a rotational move toward higher resistance levels and confirm renewed bullish momentum.
For now, LINK remains in a compression phase. The reaction around the $7.40 support and the eventual breakout from the apex will likely determine the next major directional move.
LINK: base rotation toward the $8.3 capThe Macro Picture 🗺️
LINK corrected hard from its $10.8 May peak, but that downtrend has since exhausted itself into a horizontal base. Since early June, price has carved a well-defined range between the $7.0 macro floor and the $8.3 local cap — a volatility playground where every dip into support gets bought and every push into the ceiling gets sold. Price now sits mid-range at the $7.8 equilibrium with RSI hovering around neutral, signaling balance rather than trend. This is the compression phase that typically precedes the next expansion, and until one edge breaks, rotation is the dominant behavior.
The Setup ⚙️
The Floor: The $7.0 macro support (solid green) has held every retest through June and July. It stacks with the $7.3 local low to form a high-confluence demand shelf that bulls keep defending.
The Ceiling: The $8.3 local decision (red dashed) caps every bounce. A decisive daily close above it would break the range and put the heavier $9.5 supply band back in play.
The Range Play: The $7.3–$7.8 band creates a structural playground for grid-based accumulation — mechanical entries stacked across the range while price rotates, no directional call required until one edge gives way.
The Roadmap: Primary target sits at $8.3 — the green roadmap points toward a rotation back to the range ceiling as buyers defend the floor. Invalidation: a sustained 1D close below $7.0 would break the base and reopen the downtrend toward fresh lows.
More setups in profile.
Marking Support and Resistance Points on a Chart
Hello.
Nice to meet you, fellow traders.
If you "follow" us, you can always get new information quickly.
Have a great day.
------------------------------------
To trade, you must consider the investment period, investment size, trading style, and profit realization method.
To proceed with actual trading, you need support and resistance points established on 1M, 1W, and 1D charts.
To mark support and resistance points, you must understand the arrangement of candles.
Depending on the arrangement of the candles, support and resistance points or zones are plotted at specific points or intervals.
Caution is required when marking support and resistance points based solely on visual observation, as subjective opinions may be involved, potentially lowering the reliability of the plotted points.
To compensate for this drawback, we have implemented the use of the HA-MS indicator to mark support and resistance points.
By using these marked indicators as the actual support and resistance points, we aim to eliminate subjective bias.
-
Looking at the 1M chart above, the HA-High, DOM(60), and OBV 0 indicators are displayed.
Draw horizontal lines at these points to mark the support and resistance points.
The HA-High and DOM(60) indicators are used to mark high points.
Therefore, on the 1M chart, you can identify where the high points are located.
-
The chart above is a 1W chart, which plots support and resistance points on the 1M chart.
Support and resistance points are marked on the 1W chart in the same way as they were marked on the 1M chart.
The HA-Low indicator and the DOM(-60) indicator are indicators that mark lows.
Therefore, it can be seen that the current price is located in the low zone when viewed on the 1W chart.
-
The chart above is a 1D chart, which plots support and resistance points on the 1M and 1W charts.
The chart below is a chart that also marks support and resistance points on the 1D chart.
Ultimately, we develop trading strategies by looking at the 1D chart.
This is because the 1D chart is the fundamental chart from which all indicators are created.
Therefore, we formulate trading strategies by referring to the support and resistance points drawn on the 1M, 1W, and 1D charts, as well as the auxiliary indicators on the 1D chart.
Since the HA-Low and DOM(-60) indicators mark the bottom, you must focus on finding the right time to buy when the price is near these points.
Therefore, you must consider how to proceed with the purchase.
You need to think about how to execute split buying, day trading methods to ensure you do not run out of funds during the split buying process, and how to adjust your investment weight.
Then, when the price rises to near the HA-High and DOM(60) indicators, you must focus on finding the right time to sell.
Therefore, you must consider how to proceed with the sale.
What needs to be considered here is the investment period.
If you intend to trade a coin (token) or asset with an investment period longer than the short term, consider the volume purchased near the HA-Low and DOM (60) indicators as the main volume.
You should start selling the main volume when you intend to close trading for this coin (token).
Until then, you should leave the main volume as is and generate profits by engaging in day trading based on price fluctuations.
Therefore, you must record the average purchase price of the main volume separately so that you can ignore changes in the average purchase price caused by day trading.
-
Looking at the current price positions,
- The HA-Low indicator on the 1D chart is at the 8.382 point, and
- The HA-Low indicator on the 1W chart is at the 9.079 point. Therefore, proceed with a purchase when the price finds support in the 8.382–9.079 range and rises.
Since the DOM(-60) indicator on the 1D chart is formed at the 7.268 point, you can proceed with a purchase when the price finds support and rises within the actual 7.268–9.079 range.
However, because the DOM(-60) indicator displays the lowest point in the low-point range while the HA-Low indicator represents the median (average) of the low-point range, it is highly likely that a stepwise downtrend will occur if the price eventually falls below the DOM(-60) indicator.
Therefore, if you purchased when the price found support and rose near the DOM(-60) indicator, you should either sell in installments or sell 100% before the price falls below the DOM(-60) indicator to secure funds for future additional purchases. After buying near the DOM(-60) and HA-Low indicators, you must consider whether to realize profits when the price rises and meets the HA-High and DOM(60) indicators.
This is because the HA-High and DOM(60) indicators represent the peaks.
The DOM(60) indicator displays the highest peak among the peaks, while the HA-High indicator represents the median (average) of the peak range.
Therefore, if the price rises above the DOM(60) indicator, it is highly likely to exhibit a stair-step uptrend.
Since a stair-step uptrend eventually forms a true peak and will subsequently transition into a decline, an appropriate selling strategy is required.
-
The most ideal trading strategy is to buy with a large amount of capital just before the price rises and sell to realize profits when the price stops rising and begins to fall.
However, since trading in this manner is not easy, you must create a trading strategy that suits your investment style and trade accordingly to generate profits.
Until now, we have conducted trading by relying on the average purchase price provided by the exchange.
As a result, if the price fell after a purchase, we would stop trading and simply wait for it to rise.
To trade using this method, you must buy when the price reaches its lowest point and the upward trend begins.
If you fail to do so, you may experience significant difficulties in trading due to poor responses when the price drops below the average purchase price.
Therefore, it is advisable to trade by disregarding the average purchase price to maintain your trading instincts and reduce losses from holding positions.
However, caution is required if you are not accustomed to day trading, as continuously buying can lead to greater difficulties.
There is always a risk involved in any type of trading.
Therefore, we need to become familiar with trading by engaging in day trading when the price is near the HA-Low and DOM (-60) indicators.
Once you become somewhat familiar with it, you will be able to generate consistent profits.
-
Thank you for reading to the end.
I wish you successful trading.
--------------------------------------------------
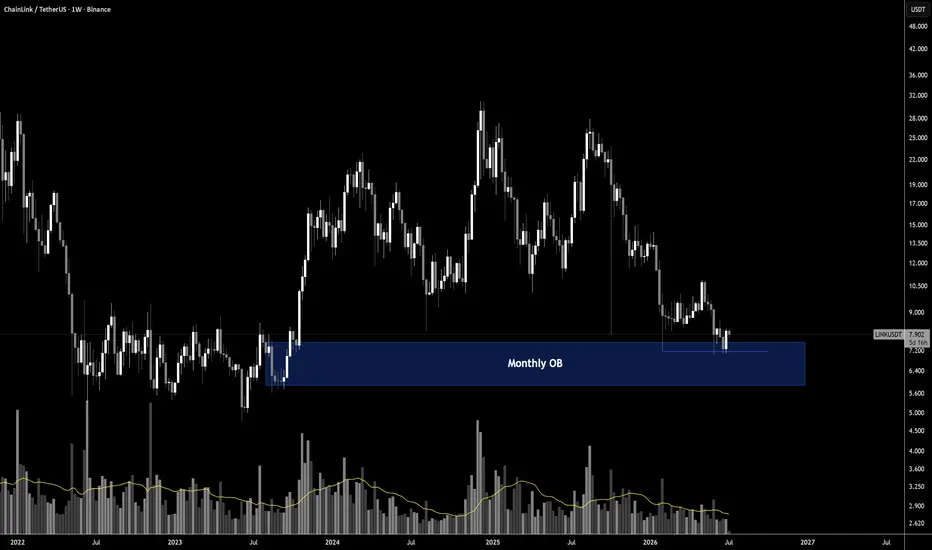
LINKUSDT: ABC Retraces to the Monthly OB That Started It AllThe Monthly OB marked here isn't just a level, it's the origin point. That zone, roughly 5.7 to 7.2, is where the entire five-wave impulse launched from in mid-2023, the same base that produced the run to nearly 30 by late 2024.
Since that high, the decline has traced a clean ABC. Wave A down into the 2025 low, B corrective bounce, C completing the move back to where the impulse began. That's textbook Elliott, a full corrective structure retracing to the exact level that generated the move, not some arbitrary Fibonacci pocket.
The effort versus result read matters more here than the wave count. Volume has been declining across every visit to the lows, this test, the 2025 test, the 2024 test, even as price keeps returning to almost the same zone repeatedly. Diminishing effort producing a similar result each time is the Wyckoff tell for supply exhausting itself rather than strengthening. Sellers pushing to the same area three separate times with less and less participation each time isn't persistence, it's fatigue.
Price is now trading inside the Monthly OB itself, at 7.893, right where the impulse began. In Continuation Acceleration Protocol terms, this is a regime gate sitting directly on the level that would need to hold for the five-wave structure to still be considered intact rather than fully invalidated.
This is the highest-stakes level on the chart. A five-wave impulse followed by an ABC that retraces exactly into the OB that started it is either the cleanest reaccumulation setup on this list, or it's the level finally giving way after three tests of dwindling conviction.
What invalidates the reaccumulation read: a weekly close below the OB's lower bound near 5.7, extending the decline beyond where the original impulse launched. What confirms it: a reclaim back above the OB with expanding volume, the one thing missing from every prior test.
Epictetus said circumstances don't make the person, they reveal them. Three tests of the same zone with less effort each time is revealing something about who's still selling here. Whether it's enough to hold a fourth time is what happens next.