LINK | Downtrend Broken, One Pool Sits AboveBy analyzing the #LINK (Chainlink) chart on the Daily timeframe, we can see a market that spent nine months in a downtrend, swept the liquidity beneath it, and has now broken both the structure and the trendlines that defined the entire decline.
━━━━━━━━━━━━━━━━━━━━
DAILY TIMEFRAME
━━━━━━━━━━━
Compare with Chainlink / Tether
LINKUSDT: Rising Wedge at $13.24 — Breakdown Needs ConfirmationAccording to Chainlink’s Q2 2026 review, more than $7B in token value migrated to CCIP during the quarter, while CCIP volume reached $4.9B, up 353% YoY. This supports the long-term institutional narrative, although the figures are reported by Chainlink and do not guarantee an immediate price breakou
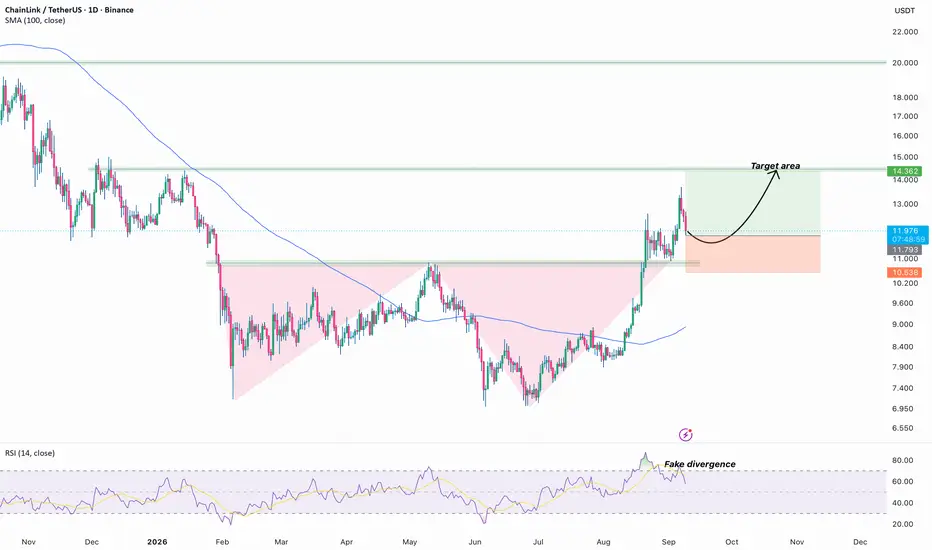
ChainLink/USDT (1D)Hi!
Trend: After a multi-month downtrend (price below SMA100), the 100-day SMA has flattened and turned up, an early sign of regime change from bearish to base-building.
Structure: a Double bottom (Feb–Apr, Jun–Aug) resolved as bullish continuations. The August breakout cleared the 11.000 resistan
LINK: Replicates Historical Multi-Month Base AccumulationLINK: Replicates Historical Multi-Month Base Accumulation – Macro Breakout Long Targeting $100 Ceiling
Chainlink (LINK) is flashing extraordinary macro accumulation signals on the weekly timeframe (1W), indicating that a major new expansion cycle is preparing to unfold. Over multi-year horizons, pri
Chainlink Is Waking Up | Is LINK Finally Ready to Run?Chainlink is showin renewed strength as the tokenization narrative continues to accelerate.
LINK is currently trading around $13.9, up 5% over the last 24 hours and 15% over the past 7 days, with roughly $925 million in daily trading volume. Its market cap is around $10.45 billion, while about 750
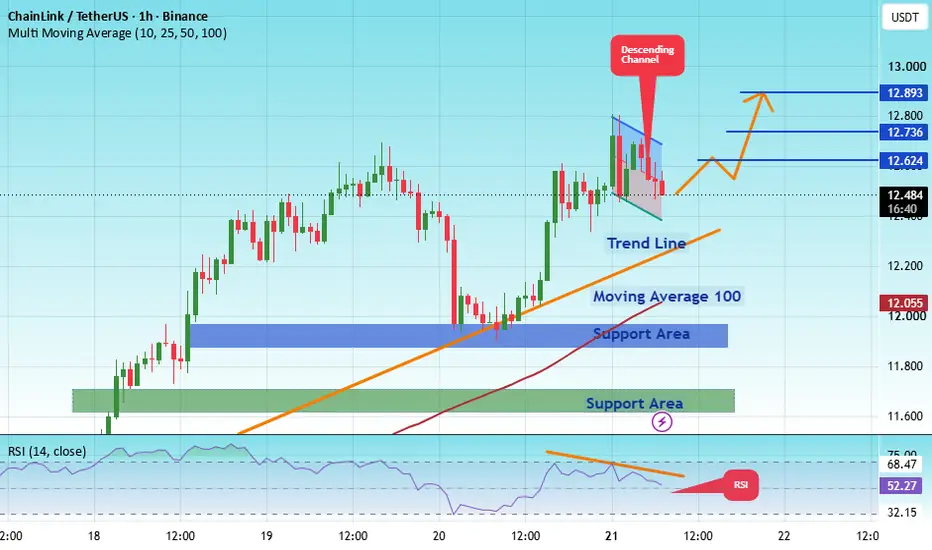
LINKUSDT – Triangle Pattern Breakout Loading?#LINK
The price is moving within a bearish channel on the 1-hour timeframe; it has reached the lower boundary and appears poised for a rebound, suggesting a potential upward move upon retesting this level.
The Relative Strength Index (RSI) indicates a bearish trend, but an upward breakout is likel
LINK / LINKUSDT Long Setup | Breaker Block ReclaimMARKET ANALYSIS
LINK is currently reacting from a key technical area highlighted on the chart.
As long as the protected support zone remains intact, the bullish market structure remains valid and higher liquidity targets may continue to attract price action.
A breakdown below the invalidation
$LINK | 1H | BUY SETUP |BINANCE:LINKUSDT just reclaimed $14 — but the number traders should be watching isn't on this chart.
Everyone's framing this as a clean breakout: the order block ($13.556–$13.341) held, price is defending it, next stop $13.980, then $14.806.
Here's what the setup doesn't price in. LINK's circulat
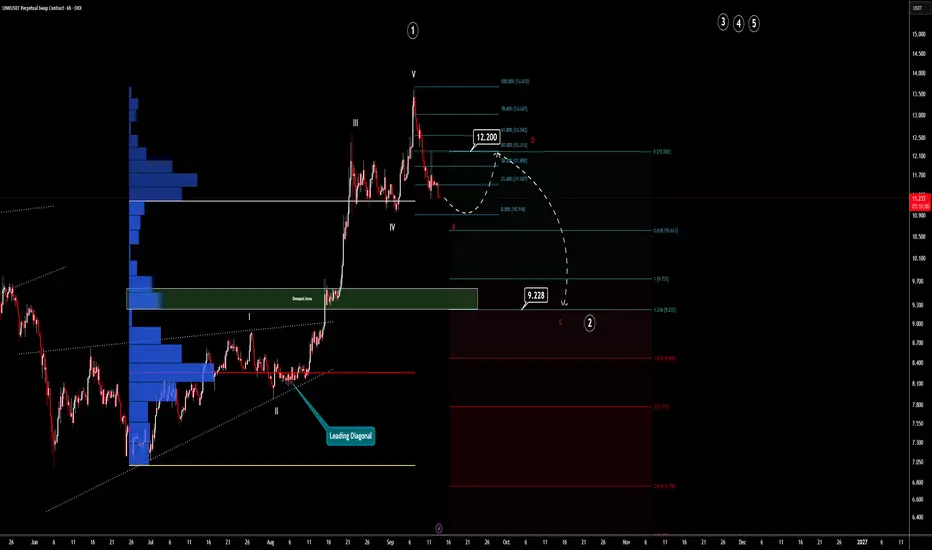
Textbook Wave Analysis (Link) 6HChainlink shows a clear sign that an inner impulsive move is coming to an end.
This chart shows a clear textbook illustration of Elliott Wave analysis.
After forming the diagonal, an impulsive move has ended. Now is the time for an A-B-C correction, and that small correction is going to create a w
See all ideas
Summarizing what the indicators are suggesting.
Oscillators
Neutral
Oscillators
Neutral
Summary
Neutral
Summary
Neutral
Summary
Neutral
Moving Averages
Neutral
Moving Averages
Neutral
Displays a symbol's price movements over previous years to identify recurring trends.
Frequently asked questions
The current price of Chainlink / Tether (LINK) is 15.096 USDT — it has risen 5.20% in the past 24 hours. Try placing this info into the context by checking out what coins are also gaining and losing at the moment and seeing LINK price chart.
Chainlink / Tether price has risen by 17.08% over the last week, its month performance shows a 28.01% increase, and as for the last year, Chainlink / Tether has decreased by −30.37%. See more dynamics on LINK price chart.
Keep track of coins' changes with our Crypto Coins Heatmap.
Chainlink / Tether (LINK) reached its highest price on Dec 13, 2024 — it amounted to 30.930 USDT. Find more insights on the LINK price chart.
See the list of crypto gainers and choose what best fits your strategy.
Chainlink / Tether (LINK) reached the lowest price of 4.950 USDT on Jun 10, 2023. View more Chainlink / Tether dynamics on the price chart.
See the list of crypto losers to find unexpected opportunities.
The safest choice when buying LINK is to go to a well-known crypto exchange. Some of the popular names are Binance, Coinbase, Kraken. But you'll have to find a reliable broker and create an account first. You can trade LINK right from TradingView charts — just choose a broker and connect to your account.
Crypto markets are famous for their volatility, so one should study all the available stats before adding crypto assets to their portfolio. Very often it's technical analysis that comes in handy. We prepared technical ratings for Chainlink / Tether (LINK): today its technical analysis shows the buy signal, and according to the 1 week rating LINK shows the strong buy signal. And you'd better dig deeper and study 1 month rating too — it's buy. Find inspiration in Chainlink / Tether trading ideas and keep track of what's moving crypto markets with our crypto news feed.
Chainlink / Tether (LINK) is just as reliable as any other crypto asset — this corner of the world market is highly volatile. Today, for instance, Chainlink / Tether is estimated as 4.99% volatile. The only thing it means is that you must prepare and examine all available information before making a decision.
You can discuss Chainlink / Tether (LINK) with other users in our public chats, Minds or in the comments to Ideas.