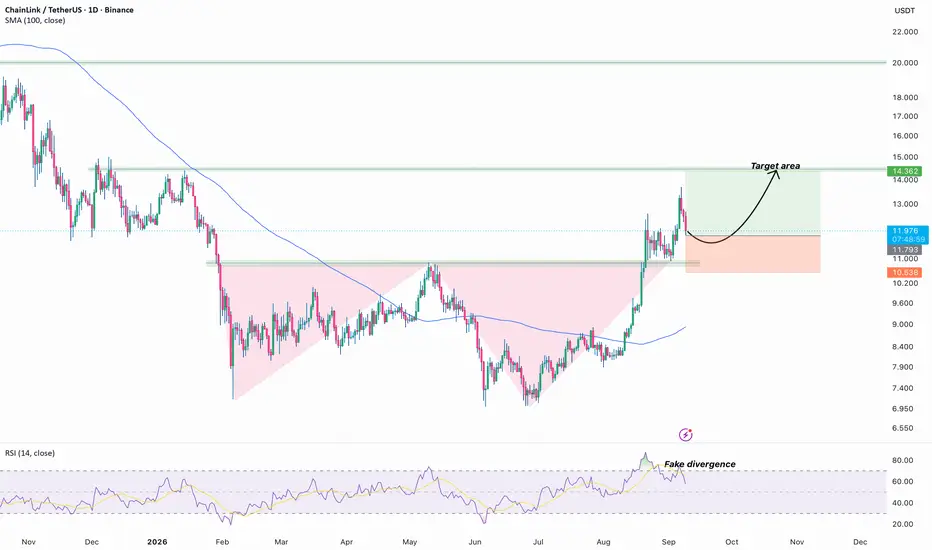
LINK - Weekly Support Holding the KeyChainlink (LINK) is currently trading around a major weekly support zone, which has acted as an important accumulation area in the past. 📊
📌 As long as this weekly support continues to hold, we will be looking for trend-following long setups, anticipating the next bullish leg to develop.
However,
Compare with Chainlink/USDT
LINKUSDT 15JULChainlink remains the leading oracle network in the crypto market, making it one of the most closely watched projects from both a fundamental and technical perspective. Let’s take a look at the current chart structure.
At the time of this analysis, LINK is trading around $8.30. Price is showing sig
Build Your Trading Plan Before Entering the Market
Hello traders,
If you enjoy this analysis, make sure to follow for more market insights and trading strategies.
Wishing everyone green candles and profitable trades. 🚀
---------------------------------
One question always comes up in trading:
✅ Which coin should I trade?
✅ What criteria should
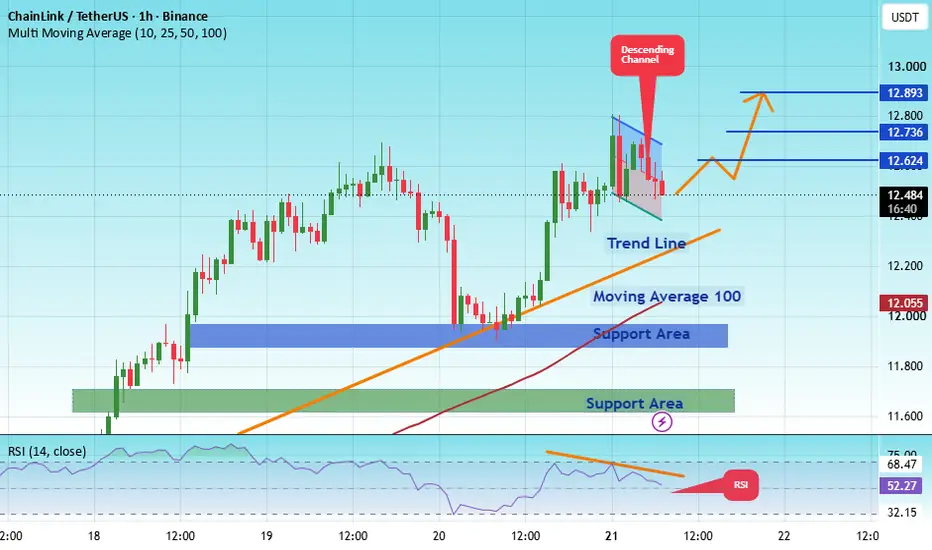
$LINK held its $8.523–$8.542 support zone during this pullback.BINANCE:LINKUSDT pulled back into a support zone at $8.523–$8.542 after its recent uptrend, held it, and is now trading back around $8.65 — a clean support-hold setup on the 1H.
📰 Chainlink's institutional footprint keeps growing: a partnership with dozens of European and South Korean banks on sta
LINK USDT SHORT SIGNAL#115. LINK/USDT – Trade Setup (SHORT)
📈 Position Type: SHORT
🕒 Timeframe: 1H
📊 Market: Futures
💰 Entry Zone:
8.477
🛑 Stop-Loss:
8.777
🎯 Take-Profit Targets:
• TP1:
• TP2: 0.1811
• TP3: 0.1768
• TP4:
⚙️ Leverage:
5 *10
▫️ After TP1, move SL to Entry + 0.2%.
▪️ Exit Plan:
• 50% at
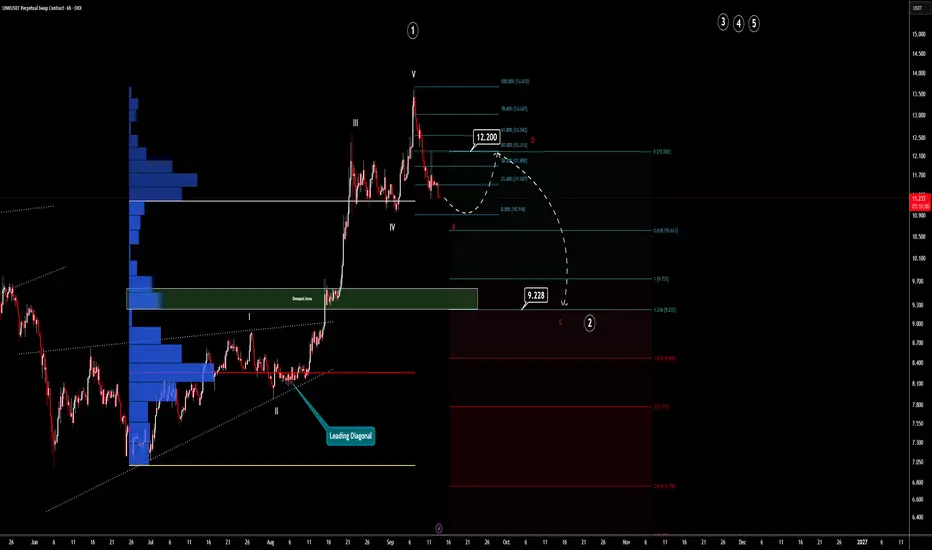
LINK: local squeeze with $9.830 destinationThe Macro Picture 🗺️
LINK unwound from the $10.870 macro ceiling into a summer base and has reclaimed $8.629, holding above the $8.184 local low. Price is coiling in the upper half of the range with higher lows behind it — a base rebuilding, not a breakdown.
The Setup ⚙️
The Range Floor 🟢
$8.184
#LINKUSDT D#LINKUSDT D
We're seeing several bearish setups forming on **LINK**.
If price reaches any of the red supply zones and gives a valid confirmation, you can look for short opportunities.
The darker red zones carry more weight and are considered higher-probability areas.
The short-term downside targ
LINKUSDT - Descending Trendline, Ready for a Breakout?📊 Technical Analysis
💰 💵 Coin: BIST:LINK #LINKUSDT
⏳ Time Frame: 2D
📉 Pattern: Descending Trendline (Long-Term Resistance)
🔍 Chainlink (LINK) is still trading below a long-term Descending Trendline, which has acted as a dynamic resistance since the major price peak. This trendline has rejected m
See all ideas
Summarizing what the indicators are suggesting.
Oscillators
Neutral
SellBuy
Strong sellStrong buy
Strong sellSellNeutralBuyStrong buy
Oscillators
Neutral
SellBuy
Strong sellStrong buy
Strong sellSellNeutralBuyStrong buy
Summary
Neutral
SellBuy
Strong sellStrong buy
Strong sellSellNeutralBuyStrong buy
Summary
Neutral
SellBuy
Strong sellStrong buy
Strong sellSellNeutralBuyStrong buy
Summary
Neutral
SellBuy
Strong sellStrong buy
Strong sellSellNeutralBuyStrong buy
Moving Averages
Neutral
SellBuy
Strong sellStrong buy
Strong sellSellNeutralBuyStrong buy
Moving Averages
Neutral
SellBuy
Strong sellStrong buy
Strong sellSellNeutralBuyStrong buy
Displays a symbol's price movements over previous years to identify recurring trends.
Frequently asked questions
The current price of Chainlink/USDT (LINK) is 8.312 USDT — it has risen 0.16% in the past 24 hours. Try placing this info into the context by checking out what coins are also gaining and losing at the moment and seeing LINK price chart.
Chainlink/USDT price has risen by 1.22% over the last week, its month performance shows a 12.51% increase, and as for the last year, Chainlink/USDT has decreased by −53.60%. See more dynamics on LINK price chart.
Keep track of coins' changes with our Crypto Coins Heatmap.
Chainlink/USDT (LINK) reached its highest price on May 10, 2021 — it amounted to 52.992 USDT. Find more insights on the LINK price chart.
See the list of crypto gainers and choose what best fits your strategy.
Chainlink/USDT (LINK) reached the lowest price of 0.195 USDT on Dec 15, 2018. View more Chainlink/USDT dynamics on the price chart.
See the list of crypto losers to find unexpected opportunities.
The safest choice when buying LINK is to go to a well-known crypto exchange. Some of the popular names are Binance, Coinbase, Kraken. But you'll have to find a reliable broker and create an account first. You can trade LINK right from TradingView charts — just choose a broker and connect to your account.
Crypto markets are famous for their volatility, so one should study all the available stats before adding crypto assets to their portfolio. Very often it's technical analysis that comes in handy. We prepared technical ratings for Chainlink/USDT (LINK): today its technical analysis shows the neutral signal, and according to the 1 week rating LINK shows the sell signal. And you'd better dig deeper and study 1 month rating too — it's sell. Find inspiration in Chainlink/USDT trading ideas and keep track of what's moving crypto markets with our crypto news feed.
Chainlink/USDT (LINK) is just as reliable as any other crypto asset — this corner of the world market is highly volatile. Today, for instance, Chainlink/USDT is estimated as 1.15% volatile. The only thing it means is that you must prepare and examine all available information before making a decision. And if you're not sure about Chainlink/USDT, you can find more inspiration in our curated watchlists.
You can discuss Chainlink/USDT (LINK) with other users in our public chats, Minds or in the comments to Ideas.