LINK | Downtrend Broken, One Pool Sits AboveBy analyzing the #LINK (Chainlink) chart on the Daily timeframe, we can see a market that spent nine months in a downtrend, swept the liquidity beneath it, and has now broken both the structure and the trendlines that defined the entire decline.
━━━━━━━━━━━━━━━━━━━━
DAILY TIMEFRAME
━━━━━━━━━━━━━━━━━━━━
The downtrend. The BOS in late January confirmed it — the December low broke and price collapsed from $12.00 toward $7.20 . Two descending trendlines contained every rally for the following eight months. Nothing got above them.
The sweep. The low was not a base, it was a liquidity grab. In June price drove through the February low into the stops resting beneath and printed $7.20 . That is the origin of everything since.
The shift. Price built through July, broke both descending trendlines in August, and printed the MSS above $10.95 — the first upside structural break of the whole move. Two BOS events followed, through $12.30 and then $13.28 .
Before that second break, price swept the liquidity at $10.90 and set the Protected Low at $10.621 . Price now trades at $14.111 .
━━━━━━━━━━━━━━━━━━━━
THE KEY LEVELS
━━━━━━━━━━━━━━━━━━━━
Flip Zone — $12.044 – $13.283
The range that capped price in early September, broken on the last BOS and now flipped to demand. First support beneath price.
Protected Low — $10.621
The low the buyers defended to create the break. The line the whole idea rests on.
$$$ — $16.813
The November high. Untouched since it printed, and the only pool of buy-side liquidity above price.
━━━━━━━━━━━━━━━━━━━━
THE BIAS
━━━━━━━━━━━━━━━━━━━━
Bullish while price holds above the Protected Low at $10.621 .
━━━━━━━━━━━━━━━━━━━━
SCENARIO A — THE BASE CASE
━━━━━━━━━━━━━━━━━━━━
Price retraces into the Flip Zone at $12.044 – $13.283 , reacts, and continues from there. That zone is old resistance turned support and it sits well above the protected low, which makes it the entry with defined risk rather than assumed risk.
The objective is the resting liquidity at $16.813 .
━━━━━━━━━━━━━━━━━━━━
SCENARIO B — NO RETRACE
━━━━━━━━━━━━━━━━━━━━
Price continues directly from current levels and never offers the zone. Same destination, worse entry, no defined risk — which is why this is the version to watch rather than the version to chase. A daily close above $14.50 is what turns it from a possibility into a signal.
━━━━━━━━━━━━━━━━━━━━
INVALIDATION
━━━━━━━━━━━━━━━━━━━━
A daily close below the Protected Low at $10.621 . That is the origin of the shift; beneath it the June sweep failed and the bullish structure is finished.
An earlier warning comes first: a daily close below $12.044 with no reclaim means the Flip Zone failed as demand and the entry thesis is broken well before the structure is.
And the rule that governs all of it: a break is a candle close, not a wick. The Flip Zone held price for two weeks before it broke, which means stops sit on both sides of it — a wick back through will look like failure and close back inside, and that is the single most common way traders get removed from a move that then continues without them.
━━━━━━━━━━━━━━━━━━━━
FUNDAMENTAL BACKDROP
━━━━━━━━━━━━━━━━━━━━
The institutional side is doing real work. On September 26 Aave V4 launched its Equities Hub on Base, letting users borrow USDC against tokenized stocks including Apple and Nvidia — with Chainlink supplying the price feeds on a 24/5 update schedule. Node v2.65.0 shipped on September 24 with improved monitoring for confidential workflows. LINK has recovered roughly 17% in seven days.
The other side is not small. LINK is still down 43% year over year , and the $14.50 – $15.50 band is the resistance the market has failed at repeatedly — it sits directly between current price and the $16.813 objective. Institutional integrations have been announced steadily all year without translating into sustained price.
Which is why the structure leads here. The integrations explain why buyers are defending the Flip Zone. They do not remove the requirement that $14.50 gets closed above before the pool above becomes reachable.
This analysis will be updated as the market evolves.
Best Regards, BigBeluga 🐳
In-depth trading ideas
LINKUSDT: Rising Wedge at $13.24 — Breakdown Needs ConfirmationAccording to Chainlink’s Q2 2026 review, more than $7B in token value migrated to CCIP during the quarter, while CCIP volume reached $4.9B, up 353% YoY. This supports the long-term institutional narrative, although the figures are reported by Chainlink and do not guarantee an immediate price breakout.
📊 Technical Analysis:
LINK has rallied from the $10.66 swing low and is now trading inside a rising wedge. Price rejected the upper boundary near $13.24, while RSI is close to overbought territory.
Rising Wedge: Caution Near Resistance
A rising wedge is often a bearish reversal or corrective pattern. With price near the upper boundary, this is not an ideal area to chase longs. A confirmed 4H break below the lower trendline would strengthen the bearish scenario.
MACD remains positive, but the pattern requires caution: a rising wedge can resolve lower if support breaks.
🎯 Bearish targets:
Target 1: $12.225
Target 2: $11.392
Extended target: $10.663
A confirmed 4H close above $13.24 would invalidate the bearish wedge scenario and restore the bullish continuation case.
⚠️ Not financial advice.
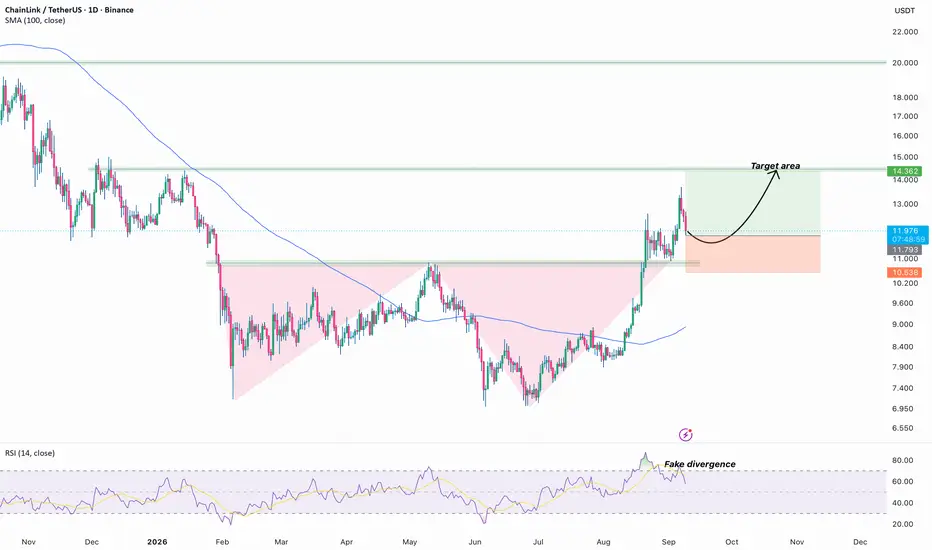
ChainLink/USDT (1D)Hi!
Trend: After a multi-month downtrend (price below SMA100), the 100-day SMA has flattened and turned up, an early sign of regime change from bearish to base-building.
Structure: a Double bottom (Feb–Apr, Jun–Aug) resolved as bullish continuations. The August breakout cleared the 11.000 resistance shelf (prior swing high) on expanding-range candles, constructive for follow-through toward the 14.362 supply zone.
Momentum: RSI printed a lower high against price's higher high near the breakout, flagged as "fake divergence." Divergence appearing mid-impulse, rather than at an extended, mature top, tends to be low-reliability; more likely a momentum reset via consolidation than an imminent reversal. Worth monitoring, not acting on alone.
Levels:
Support: 11.000 / 10.538 (breakout retest zone)
Target: 14.362
Invalidation: daily close back below 10.538–11.000
Bottom line: Bullish structural breakout with a supportive SMA trend; a near-term pullback/retest of 11.000 is plausible before continuation. RSI alone doesn't offer a strong reversal signal here.
LINK: Replicates Historical Multi-Month Base AccumulationLINK: Replicates Historical Multi-Month Base Accumulation – Macro Breakout Long Targeting $100 Ceiling
Chainlink (LINK) is flashing extraordinary macro accumulation signals on the weekly timeframe (1W), indicating that a major new expansion cycle is preparing to unfold. Over multi-year horizons, price action has consistently adhered to an orderly cyclical blueprint: multi-month compression ranges followed by parabolic markup phases. Based on visual data from the weekly chart , previous bull waves originated from extended range consolidations: a 13-month base in 2019–2020 propelled prices toward $53, while a 17-month accumulation band in 2022–2023 unlocked a rally toward $30. Currently, price action near the $12.37 handle has completed another extended multi-month base while climbing back above the dynamic MA100 line. The active weekly candle is advancing directly toward the dominant white descending diagonal resistance line connecting major historical peaks. Persistent accumulation across this structural floor verifies that institutional capital has absorbed residual floating supply. Once a weekly candle decisively breaks this diagonal resistance, consolidation will yield to an expansive exponential markup wave. The optimal trading strategy is to accumulate medium-to-long-term Long positions within the $12.0–$12.4 zone, establishing a protective stop-loss parameter beneath the range floor at $8.00. The primary strategic take-profit objective targets the macro round-number expansion milestone at $100.00, securing exceptional risk-to-reward metrics. Disclaimer: This is not financial advice, DYOR.
Chainlink Is Waking Up | Is LINK Finally Ready to Run?Chainlink is showin renewed strength as the tokenization narrative continues to accelerate.
LINK is currently trading around $13.9, up 5% over the last 24 hours and 15% over the past 7 days, with roughly $925 million in daily trading volume. Its market cap is around $10.45 billion, while about 750 million of the 1 billion maximum LINK supply is currently circulating
From a technical perspective, LINK has built strong short term momentum after recovering from the $11.9 area, which marks the lower end of its 7 day range. The token is now testing the $14.2 zone, its recent 7 day high, making this the key resistance to watch. A clean breakout above that level could open the door for another momentum leg, while rejection could send LINK back toward the $12 area. Despite the recent recovery, LINK remains roughly 73% below its $52.70 all time high, showing how much upside remains before previous cycle levels are reclaimed.. good old days
The fundamental story is getting stronger as Chainlink becomes increasingly involved in institutional tokenization and onchain finance
On September 22, Infosys partnered with Chainlink to standardize technologies including CCIP, Proof of Reserve, Data Feeds, Data Streams, ACE and CRE across financial infrastructure serving more than 1.7 billion customer accounts. Coinbase also selected Chainlink as the oracle infrastructure for its tokenized stocks on Base, while Paxos Labs launched PAXGy on September 24 using Chainlink Price Feeds and CCIP. These developments strengthen Chainlink’s position as infrastructure connecting traditional financial assets with blockchain markets.
Price momentum has clearly improved, but $14.19 remains an important technical hurdle and the token still carries a large valuation gap to its previous peak. If buyers break and hold above the recent range high, the current trend could strengthen further.
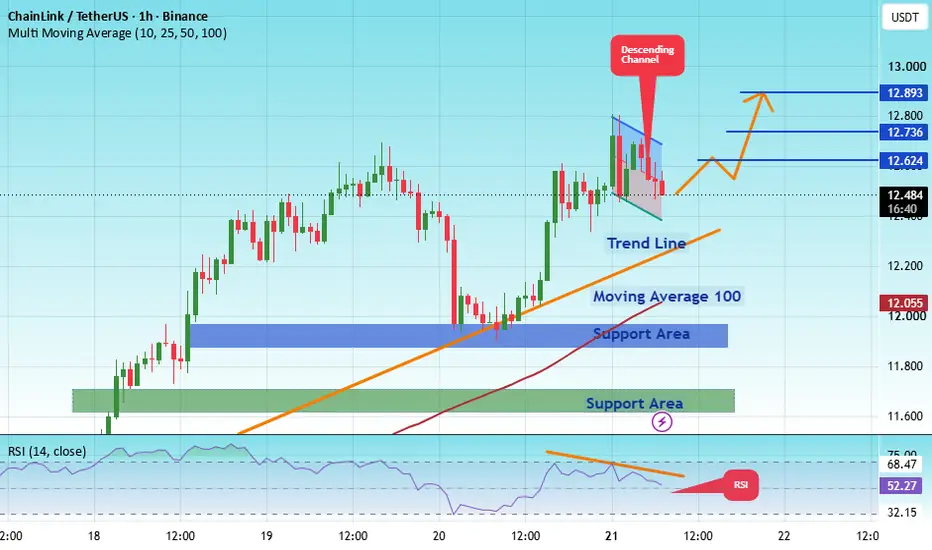
LINKUSDT – Triangle Pattern Breakout Loading?#LINK
The price is moving within a bearish channel on the 1-hour timeframe; it has reached the lower boundary and appears poised for a rebound, suggesting a potential upward move upon retesting this level.
The Relative Strength Index (RSI) indicates a bearish trend, but an upward breakout is likely due to oversold conditions on the 1-hour chart.
An orange trend line supports the potential upward rebound.
There is initial support at 11.89, acting as a primary support zone.
A key support zone (marked in green) exists at 11.60; the price has rebounded from this area multiple times, making it a strong support level.
The price is moving toward the 100-period moving average—a level we are currently approaching—which supports the bullish outlook.
Entry Price: 12.50
Target 1: 12.62
Target 2: 12.73
Target 3: 12.89
Stop Loss: At the green resistance zone.
Remember this simple rule: Capital management.
If you have any questions, please leave a comment.
Thank you.
LINK / LINKUSDT Long Setup | Breaker Block ReclaimMARKET ANALYSIS
LINK is currently reacting from a key technical area highlighted on the chart.
As long as the protected support zone remains intact, the bullish market structure remains valid and higher liquidity targets may continue to attract price action.
A breakdown below the invalidation level would weaken the current bullish scenario and require a reassessment of market conditions.
📍 Entry, Stop Loss and Take Profit levels are marked directly on the chart.
━━━━━━━━━━━━━━
⚠️ DISCLAIMER
This publication is provided solely for educational and market observation purposes.
Nothing contained in this analysis should be considered financial advice, investment advice, or a recommendation to buy or sell any financial instrument.
All trading and investment decisions remain solely the responsibility of the individual trader.
Always conduct your own research and apply proper risk management before entering any position.
━━━━━━━━━━━━━━
🎯 PARALOG
▪️Crypto Market Analysis
▪️BTC Futures Signals
▪️Bitcoin & Altcoin Market Analysis
Precision • Momentum • Timing
━━━━━━━━━━━━━━
Exchange: #MEXC Futures
#bitcoin #btc #crypto #futures #technicalanalysis
$LINK | 1H | BUY SETUP |BINANCE:LINKUSDT just reclaimed $14 — but the number traders should be watching isn't on this chart.
Everyone's framing this as a clean breakout: the order block ($13.556–$13.341) held, price is defending it, next stop $13.980, then $14.806.
Here's what the setup doesn't price in. LINK's circulating supply is ~748M of a 1B max (~75%). The other ~25% isn't gone — it's Foundation reserve supply still being released, historically in lump-sum transfers straight to exchanges. The April 2026 unlock alone put $165M of LINK on Binance in a single event. FDV (~$13.3B) is already running well above current market cap (~$9.97B) — that gap only closes by new supply hitting the market, not by demand showing up on its own.
None of this kills the bullish case. DTCC's live production rollout, SOC 2/ISO certification, and the SEC/CFTC digital-commodity classification are real structural tailwinds, and they're a big reason LINK has been outperforming this week. But a breakout read purely off order flow, with no allowance for reserve-driven supply events, is a setup that can stall exactly where it looks strongest.
📊 Entry (order block): $13.556
Invalidation: below $13.306
T1: $13.980 | T2: $14.806
Bullish above $13.556 — but the real confirmation is a clean hold above $13.980, not the order-block bounce itself. Lose $13.306 and this breakout was a liquidity grab, not a trend change.
🎯 Not financial advice. DYOR.
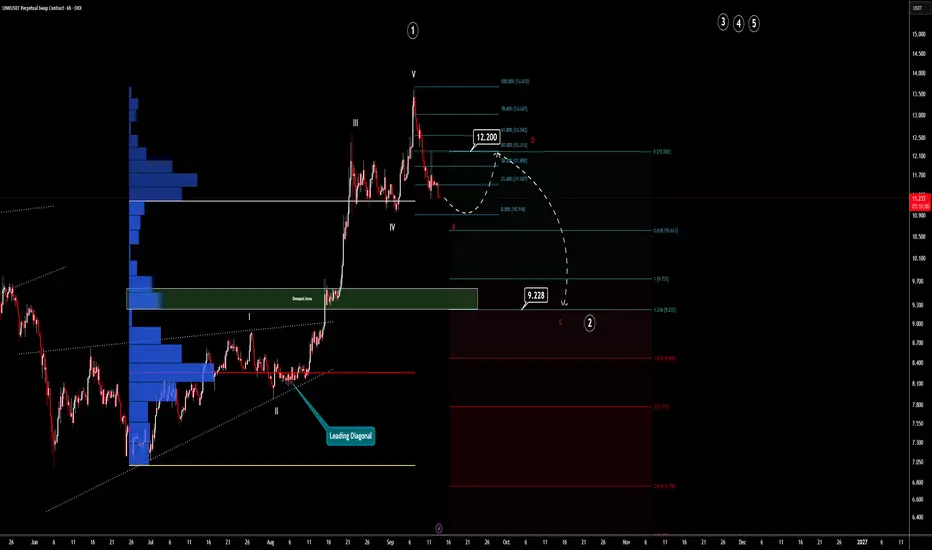
Textbook Wave Analysis (Link) 6HChainlink shows a clear sign that an inner impulsive move is coming to an end.
This chart shows a clear textbook illustration of Elliott Wave analysis.
After forming the diagonal, an impulsive move has ended. Now is the time for an A-B-C correction, and that small correction is going to create a wave 2 move on the daily timeframe.
If we consider the Fed + BOJ rate decisions in the coming days, this chart makes even more sense.
No need for complicated explanations. First down, then up. Simple as that.
LINKUSDT Bullish Pennant Signals Major ContinuationLINKUSDT previously printed a major all-time high around the $53 level before entering an extended corrective phase that retraced approximately 90% of the entire bullish expansion. This correction ultimately culminated in a strong structural bottom near $4.70, where demand decisively absorbed selling pressure. Since establishing this low, price has transitioned into a recovery phase, gradually rebuilding bullish structure.
Currently, LINKUSDT is consolidating within a bullish pennant formation, reflecting healthy compression following the impulsive recovery leg. The pennant breakout is expected to dictate the next major trend impulse.
The highlighted zone of interest represents a technically favorable accumulation region, where risk can be clearly defined against invalidation levels. A confirmed breakout above the pennant resistance would validate bullish continuation, with projected upside targets already outlined on the chart. Price behavior around the structure boundary remains critical for confirmation.
LINKUSDT — SHORT Setup From Previous SupplyLINK is recovering back toward the 13.40–13.62 area, where sellers previously showed strong initiative.
This is the zone I want to work from if price returns there.
Entry zone: 13.402–13.622
Invalidation: 14.106
Risk: 1%
Potential: 3–30% clean movement
The setup is based on a retest of an old supply area after a recovery move.
If sellers step back in, I’ll be looking for another corrective leg lower.
If price accepts above the zone and reaches invalidation, the idea is simply canceled.
#LINK #LINKUSDT #Short #CryptoTrading
LINKUSDT: Recovery Tests a Key H1 Breakout Zone📰 News Analysis:
Bottomline’s Global Pay Connect and its strategic collaboration with Chainlink support the long-term institutional narrative. However, the initiative is still focused on exploring proof-of-concept opportunities, not confirmed production adoption or transaction volume.
📊 Technical Analysis:
LINK has recovered from the $10.66 support and is now testing the $11.37–$11.43 resistance area, where a descending trendline and higher-timeframe moving averages converge.
RSI and MACD show improved short-term momentum, but price has not yet confirmed a breakout. The key is an H1 close above resistance—not the news headline alone.
🎯 Conditional Long Setup:
Direction: Long only after a confirmed H1 close above $11.43, followed by a successful retest.
Target 1: $11.83
Target 2: $12.22
A rejection from the current zone and an H1 close below $11.20 invalidates the bullish scenario.
⚠️ Not financial advice.
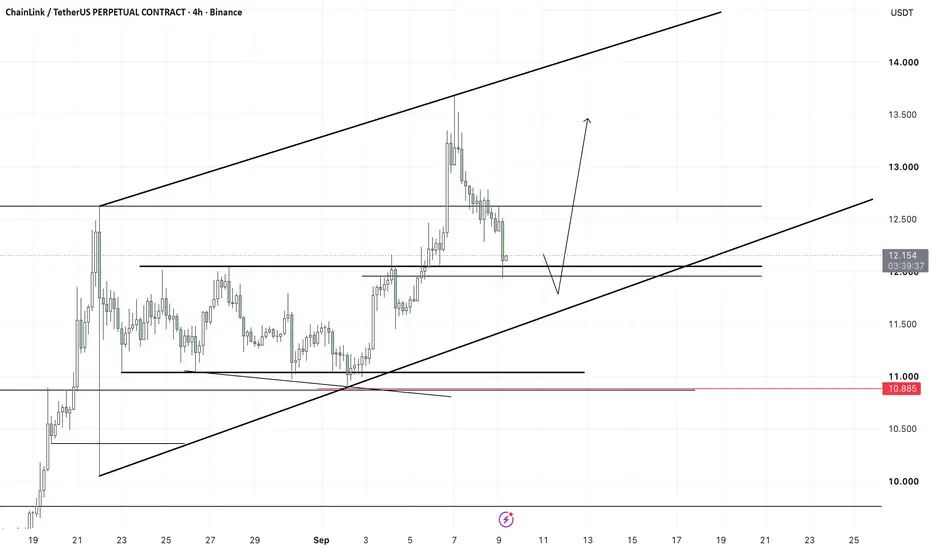
LINK Reaches Key Support - Watching for a Buy ConfiramtionLet's take a look at the #LINK chart once again.
If you check our last analysis on #LINK, you'll see that it played out perfectly, with LINK pumping 23% without leverage. 🔥
Here is the new analysis: 👇
As you can see, the price of #LINK has pulled back to its support around $12.On the 4H timeframe, LINK has been trading inside a large uptrend channel, and the price is currently near the bottom of that channel.
For me, this is an area where we can look for confirmation to open buy positions.
🎯 Target: $13.700 — the top area of the uptrend channel.
If the bullish momentum continues, we could see even higher targets.
❌ Invalidation: $10.885
Chainlink Tests Support — Can Buyers Step In?Key Support Under Test
LINK has followed the wider market lower and is now testing an important support area around $10.87. This level previously acted as resistance before the recent breakout.
Trend Still Favours the Bulls
Despite the pullback, price remains above the bullishly crossed 100/50-day EMAs, with both averages continuing to slope higher. The broader daily structure therefore remains constructive.
Momentum Has Cooled
RSI has fallen back towards the 50 level, while StochRSI is now oversold. This shows how much short-term momentum has cooled during the pullback.
Volume Needs Watching
Buying volume has decreased as price has moved back towards support. A noticeable pickup in buying from this area would give bulls more confidence that the pullback is running out of steam.
Recent Highs Remain in Play
If buyers can defend the current support zone, there is relatively little obvious resistance before the recent $13.69 swing high. Lose this area decisively, however, and the next meaningful support sits around $8.92.
In Summary
LINK has reached an important test around $10.87 after pulling back from its recent highs. The bullishly crossed and rising 100/50-day EMAs keep the broader picture constructive, but buyers now need to defend support. StochRSI is oversold, although buying volume has been declining. If support holds and demand returns, the $13.69 high could come back into play; a decisive breakdown would instead shift attention towards $8.92.
LINK - Key levels to watchLINK continues to show strength after fully filling the scam wick.
The key levels I’m watching
~$8.00 → S/R flip confirmed
$12.21 → Reclaimed support
$14.40 → Current key S/R flip
Price is now trading above $14.40. The important question is simple: can LINK hold this level and confirm it as support?
A successful S/R flip here would make the HTF structure even more interesting.
Want a lower timeframe breakdown? Let me know.
MrC
LINK: Is the recovery failing at resistance? | Sep 22, 2026A red candle near resistance is not enough to justify a short. Chainlink has recovered sharply, so a bearish trade needs evidence that the recovery is losing support—not just a guess that price has risen too far.
SIGNAL UNDER REVIEW
Binance LINKUSDT, standard 4-hour candles. Snapshot: September 22, 2026, approximately 03:54 UTC, price around 12.95 USDT. The current candle is still open. Only new events after publication count.
1 — OBSERVATION
LINK has recovered from roughly 10.70 to above 13.20. The latest move is testing the 13.20–13.35 area, where early-September candle bodies and wicks also appeared. Higher wick extremes near 13.60–13.70 remain above it. Resistance alone does not establish a reversal; the recovery could continue.
Amber marks 13.20, the lower edge of our resistance reference. Blue marks 12.85, the required breakdown close. Red marks 13.35, where this short thesis is abandoned. The 12.50–12.60 area is an intermediate obstacle on the way to the recent pullback region near 12.00.
2 — CONFIRMATION, THEN ENTRY
First require a new completed 4h close strictly below 12.85. A wick below it does not count.
Within the next three completed 1h candles after that close, price must retest 12.85–12.95 from below: a candle's range must touch the zone and that same candle must close strictly below 12.85. If any completed 1h candle closes above 12.95 first, or the three-candle window expires, cancel the attempt.
Only after that failed-retest confirmation does an illustrative sell limit at 12.85 become eligible for the next single 1h candle. Earlier touches are not entries. Cancel the waiting limit on a 1h close above 12.95. If 12.60 is reached after the initial 4h trigger but before entry, skip the setup rather than chase the move. There is only one attempt.
ILLUSTRATIVE TRADE PLAN
Entry after confirmation: 12.85 USDT.
Price-based stop from entry: 13.35 USDT; do not wait for a candle close.
Single target: 12.00 USDT.
Exact-entry risk: 0.50 USDT per LINK. Target distance: 0.85 USDT, or 1.7R before costs. The 12.50–12.60 area may hold and prevent the final target. No partial exits or stop adjustments are assumed in this model.
This is a countertrend scenario. The spot chart supplies the reference prices; it does not itself enable a short. Borrowing or derivative instruments can add fees, funding, basis and liquidation risks. No leverage is assumed or recommended.
3 — INVALIDATION AND EXPIRY
Any price at or above 13.35 before entry invalidates the entire idea. Invalidation and the skip rules take priority over confirmation. No restarting after a failure.
All unconfirmed setups and unfilled limits expire on September 22, 2026 at 20:00 UTC / 22:00 CEST. Shorter candle deadlines also apply; a signal appearing exactly at the deadline is too late. An open model trade exits at the available price no later than September 23, 2026 at 20:00 UTC, unless stop or target is reached first.
4 — REVIEW
Record the 4h trigger, failed 1h retest, later entry touch and outcome separately. Hypothetical counterexample: a 4h close at 12.82 followed by a retest candle closing at 12.98 cancels the attempt—even if price later falls. A red candle without the required sequence is not a trade. If stop and target lie inside the same candle, smaller data are needed to establish order; otherwise the result is unresolved. A limit touch does not guarantee a real fill.
Discretionary price-structure analysis, not a verified indicator signal. No backtest, win rate or positive expectancy is claimed. Fees, spread, funding and slippage are excluded; stops do not guarantee execution prices. Different crypto ideas are not independent risks, even when their directions differ. No automatic monitoring. Educational analysis, not personalized financial advice.
BotTradeLab — Human judgment, AI-assisted analysis.
LINK Analysis: Higher-Timeframe Support in FocusLINK price action is currently bouncing from a higher-timeframe support region around $11.12. This level is particularly important as it also aligns with dynamic support, creating a confluence that could help define the next directional move.
The current reaction from this area may develop into an equilibrium formation, where price consolidates between nearby support and resistance before establishing clearer direction. For the bullish scenario, continued acceptance above $11.12 would keep the possibility of a recovery in play. The primary upside reference is the Fibonacci extension target around $14.68, which could act as an area of interest if momentum develops.
However, the setup remains conditional rather than confirmed. If LINK fails to maintain the $11.12 support and begins closing below this region, it would weaken the current bullish structure. A sustained loss of support could increase the probability of a bearish rotation and potentially expose lower levels.
For now, $11.12 remains the key level to monitor. Holding above it would keep the bounce scenario technically valid, while a confirmed breakdown would shift the focus toward downside continuation.
----------------------------------------------------------------------------------------------
UK residents: Don't invest unless you're prepared to lose all the money you invest. This is a high-risk investment and you should not expect to be protected if something goes wrong. Take 2 mins to learn more: coinjar.com/uk/risk-summary
The article is an opinion expressed by the author at a point in time and does not represent the views of CoinJar UK Limited or CoinJar Australia Pty Ltd. Take care to consider the date of this article and be aware that this opinion is based on circumstances at the time of publishing. No responsibility or liability is accepted for any errors of fact or omission expressed therein. Past performance is not a reliable indicator of future results.
This above article is not to be read as investment, legal or tax advice and it takes no account of particular personal or market circumstances; all readers should seek independent investment advice before investing in cryptocurrencies.
We recommend you obtain financial advice before making a decision to use your credit card to purchase cryptoassets or to invest in cryptoassets.In the UK, it's legal to buy, hold, and trade crypto, however cryptocurrency is not regulated in the UK. It's vital to understand that once your money is in the crypto ecosystem, there are no rules to protect it, unlike with regular investments.
You should not expect to be protected if something goes wrong. So, if you make any crypto-related investments, you're unlikely to have recourse to the Financial Services Compensation Scheme (FSCS) or the Financial Ombudsman Service (FOS) if something goes wrong.
----------------------------------------------------------------------------------------------
EU residents: Warning: If you invest in this product, you may lose some, or all, of the money you invest. The value of crypto-assets may rise or fall rapidly. Past performance is not indicative of future results. To learn more see our Risk Disclosures.
CoinJar Europe Limited is authorised by the Central Bank of Ireland as a crypto-asset service provider (registration number C496731)
----------------------------------------------------------------------------------------------
#LINKUSDT: A Major Move In Making, Get Ready! $30🔺LINKUSDT is currently in an accumulation phase suggesting a distribution is likely imminent. A bullish impulse move is highly probable. Entry and exit zones along with a take profit area are clearly marked.
🔺It is important to note that trading cryptocurrency is highly risky. Conduct your own research and always manage your risk. When considering a long position on this pair volume is crucial. Wait for the price to reach the entry zone once it is trading there. Monitor both volume and price momentum as these are key indicators.