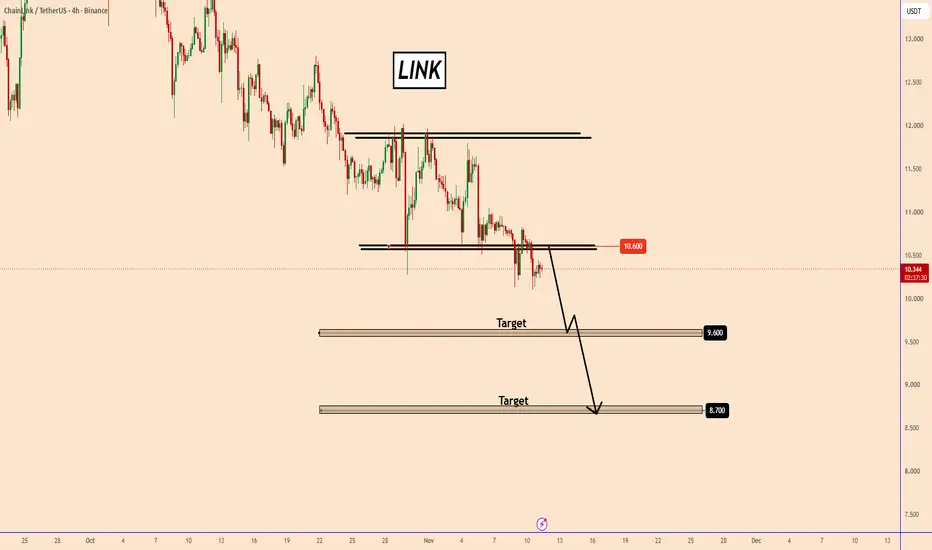
LINK: Downtrend Continuation PatternLINK: Downtrend Continuation Pattern
LINK broke out of a strong support area near 10.60 and has now turned into resistance.
Bears seem to be taking control of price and could push it further into other support areas, with the first target near 9.6.
A breakdown below this area should push LINK down to 8.7
Bearish Targets:
9.6
8.7
You can find more details on the chart.
Thank you! 🍀
⚠️PS: Do your own analysis and use your own strategy to join the trade.
❤️ If this analysis helps your trad
LINKUSDT SPOT
No trades
No trades
In-depth trading ideas
CHAINLINK: 10.53 Held to the Cent, Is 12.20 Next?Chainlink keeps getting pushed back. On Wednesday it bounced to 11.80, and by Thursday it had given all of it back and dropped to 10.51. That low sat two cents under the 10.53 line, and buyers took it straight back up. Price has been sitting just above that line since then.
That keeps it in monthly bearish territory. Down here price grinds, slow and choppy, back and forth, and every bounce into 11.39 has been sold so far this month.
Bullish case
- Trigger: a daily close back above 11.39
- Targ
Middle East WAR fears could send LINK crashing toward $9.30Hi,
With Middle East tensions adding to the fundamental risks, LINK is struggling to move higher. It keeps getting rejected from a major daily resistance, opening the door to the next weekly support at $9.30, my initial target. A deeper decline cannot be ruled out.
Thanks.
#LINKUSDT #8h (Binance) Descending channel on resistance [SHORT]LINK (ChainLink) is pulling back to 50MA and seems likely to get rejected again.
⚡️⚡️ #LINK/USDT ⚡️⚡️
Exchanges: Binance Futures, Bitget Futures
Signal Type: Regular (SHORT)
Leverage: Isolated (8.0X)
Amount: 5.2%
Entry Targets:
1) 11.759 - 100.0%
Take-Profit Targets:
1) 10.075 - 50.0%
2) 8.389 - 50.0%
Stop Targets:
1) 12.321 - 100.0%
Trailing Configuration:
Stop: Breakeven -
Trigger: Target (1)
Published By: @TradingOn
CRYPTOCAP:LINK BINANCE:LINKUSDT.P #8h #ChainLink #Oracle
Risk/Re
LINKUSDT (Binance Perpetual) — 8H ChartChainLink is consolidating around $10.81 near the apex of a distinct falling wedge/descending channel structure.
The projected path indicates a short-term consolidation phase around current demand, followed by a relief breakout attempt targeting the $12.00 – $12.20 zone. However, overhead resistance is expected to reject the recovery, leading to a secondary macro leg down toward major liquidity support around $9.30 – $9.60 into December.
Technical Breakdown
Falling Wedge Pattern: Price has bee
$LINK | 1W | BUY SETUP |🚨 BINANCE:LINKUSDT keeps winning the headlines. The chart keeps losing the week.
This month alone: APAC equities streams covering $40T+ of Asian markets, Swift joining ERC-3643, and the DTCC collateral work shown at Sibos.
Yet LINK is still ~79% below its ATH (247WallSt).
📊 1W, Binance: $10.747, down 5.66% on the week. Price is under the 50 EMA (11.466) and VWAP (11.017). The Sep–Oct high got rejected, and the weekly candles are now bleeding back toward the range.
The market’s read: adopti
Head & Shoulders Breakdown Warning – $14 Breakout or $9.95 Crash## LINK/USDT – Head and Shoulders Formation Signals a Potential Bearish Breakdown!
Chainlink (LINK) is currently trading within a critical technical structure, where the interaction between **horizontal resistance, major support levels, and a developing Head and Shoulders (H&S) formation** suggests that patience and confirmation will be essential before entering any directional positions.
From a bullish perspective, **opening long positions before a confirmed breakout above $14.00 could be a p
$LINK | 1H | BUY SETUP |🚨 BINANCE:LINKUSDT is sitting on a 1H order block, but the number that matters is the entry, not the bounce.
The popular read: the oracle leader is getting institutional adoption, the Chainlink Reserve keeps buying, so every dip is a gift.
📊 Chart (1H, Binance)
Buy block: $10.772–$10.816
Entry: $10.819
Stop: $10.719
TP1: $11.024
TP2: $11.319
Price is $10.886, already above the entry.
From here, TP1 is $0.138 away and the stop is $0.167 away. That’s under 1:1.
From the marked entry it’s abo
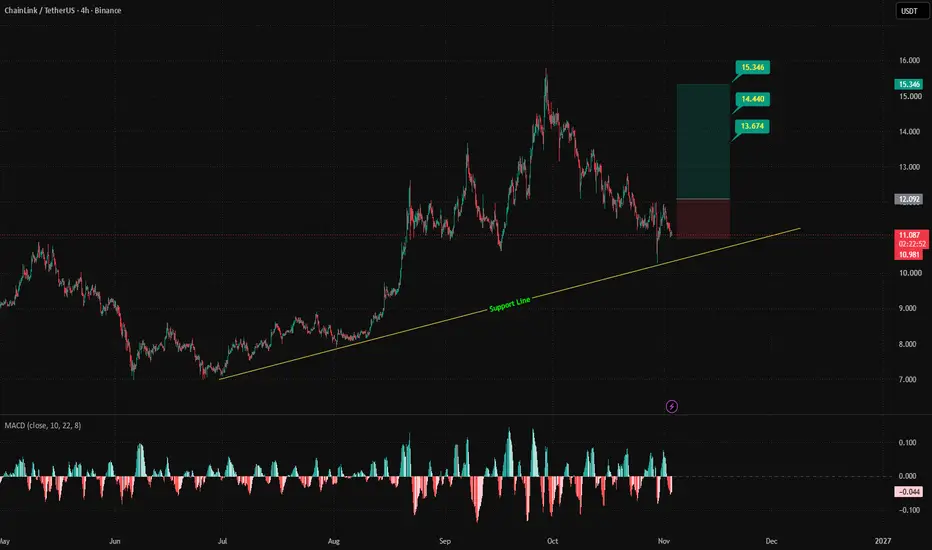
LINK ForecastBINANCE:LINKUSDT LINKUSDT | 4H | Bullish Setup
LINK is approaching a major ascending support trendline that has remained intact since July, making the current price area an important structural zone to watch.
Despite the recent corrective decline from the $15.30 region, price is now testing this long-term dynamic support. A successful defense of this trendline could provide the foundation for a potential bullish recovery.
Trade Rationale:
The primary idea is to capitalize on a potential bul
CHAINLINK H4: 10.13 to 10.83 in a Day, 11.09 Above 10.78Sunday night looked ugly for Chainlink. One 4H candle dropped from 10.68 to 10.13, and the week opened near 10.41.
Monday took the whole move back. A morning dip to 10.22 was bought, and the afternoon candle ran from 10.52 to 10.83 and closed at 10.79, just above the Pivot at 10.78. From Sunday's low to Monday's high that is about 7% in less than a day. The evening candle pulled back to 10.58, stayed well above 10.47, and price now sits near 10.72, a few cents under the Pivot.
So LINK is back
LINK | One Close Above 12.015 Opens The RunChainlink broke its downtrend, swept the liquidity, and ran. It has now given most of that leg back. One level decides whether the next one starts.
━━━━━━━━━━━━━━━━━━━━
THE STRUCTURE
━━━━━━━━━━━━━━━━━━━━
The decline that ran from May into August was contained by a descending trendline, and that trendline was broken in August. Price then printed a bullish MSS , followed it with a BOS , and delivered a second BOS in September.
The detail that matters is what happened on that last brea
LINK Prespective BINANCE:LINKUSDT The previous analysis required an update, as price once again reacted to the ascending trendline, similar to its previous reaction.
Following a minor correction, the bullish scenario remains valid, and the trade setup has been re-established based on this renewed support reaction.
We continue to monitor price action for further confirmation.
FOREDNA | Decode the DNA of the Market
LINK is still in a bearish wave (8H)LINK | Bearish Wave D Scenario
LINK appears to be in the middle of Wave D, and we may see another downward move toward the green zone to complete this wave before price potentially transitions into Wave E.
Price is currently trading below the descending trendline, which supports our bearish outlook and suggests that downside pressure may continue in the short term. As long as price remains below this trendline, we will be watching for another drop toward the marked target levels.
Trading Plan
$LINK | 1H | SELL SETUP |🚨 BINANCE:LINKUSDT ’s Reserve bought $5.3M of LINK in October. The price still slid.
The narrative is hard to miss: Reserve accumulation, institutional products, ETF access. Surely that supports price.
📊 The numbers are smaller than the headlines:
Reserve holds 6.48M LINK, under 1% of the ~767M circulating
October’s 427K LINK ≈ $5.3M
Daily volume has been around $260M
So a full month of Reserve buying is about 2% of one day’s volume
The Reserve is real, consistent and long-term bullish. But
LINK/USDT: Macro Resistance Test & Support Bounce SetupChainlink ( BINANCE:LINKUSDT ) is currently consolidating on the 1D timeframe after two testing the macro descending ATH trendline originating from 2021 and also strong resistance area.
Key Technical Highlights:
Macro Trend Rejection & Pullback: Following the test of the strong resistance area, price has cleanly retreated back to a critical structural support zone.
The Support Confluence: Price is hovering right above the strong horizontal support area (~$8.80 - $9.75), which aligns
CHAINLINK H4: 5 Candles Under 10.47 Since CPI, 9.75 NextChainlink is bouncing after Tuesday's CPI drop, and the bounce keeps stopping under 10.47. I'm bearish below that line, with 9.75 as the target.
Entry: 10.47
Why I like it: this week LINK fell from 10.83 to 10.10, and 10.47 is exactly half of that drop. It is also the line price lost on Tuesday morning. Five 4H candles have closed since the CPI candle, and the best any of them did was 10.45. A line that was a floor two days ago and now stops every bounce is where I want to lean bearish. The can
CHAINLINK H4: One Close Above 10.47, Then Back Under10.47 is the line that matters for Chainlink this week, and Monday has already tested it from both sides.
Sunday night's 4H candle dropped from 10.68 to 10.13, a 5% flush, and the low stopped one cent under the next line at 10.14. The week opened at 10.41. The first 4H candle climbed to 10.62 and closed above 10.47, then the next one gave all of it back and fell to 10.22. Price now sits near 10.42, back under the line.
That keeps LINK in bearish territory on the 4H chart. Here price tends to d
CHAINLINK Weekly: First Close Under 11.00 Since August?Chainlink has not closed a week under 11.006 since the middle of August. Tonight it might.
Some context first. From August to late September LINK almost doubled, from 8.17 to 15.78. That is the bull market. Since then it has been handing part of it back, and last week's dip to 10.27 still got bought, with the candle closing at 11.39.
This week is different so far. Price is at 10.65, under the 11.006 line and in quarterly bearish territory. Down here it tends to grind lower slowly, choppy, with
Chainlink Bounced 14% Off the Low. Back to 11.00 Next?Chainlink started this quarter near 14.28. On Thursday it lost 10% in a day, and on Friday it hit 10.27. Then it bounced hard, up about 14% to 11.75 earlier today.
But look where that bounce stalled. It's already back near 11.37, and it never got close to 12.53, the pivot for this quarter. Chainlink hasn't closed a day above that level since October 13th.
So I think this is a bounce inside a downtrend, not a bottom. My read is that it comes back to about 11.00 from here. That's the next level
LINK/USDT analysisLINK appears to be recovering from its previous bearish structure after establishing a potential bottom around the $7.50 demand area.
Following the initial bullish rally towards the $15.510 resistance level, the price is now declining towards the $9.748 demand area, where a potential bullish reversal could develop.
If the demand area holds, LINK could continue its bullish recovery towards $11.200, followed by $13.152, $15.510 and $18.220.
For the final target, we will use the supply area at $
Wave Analysis - CHAINLINK (4H)As you can clearly see on the chart, a five-wave impulsive pattern ended a while ago.
I believe the pattern Chainlink is currently in is a Zigzag.
This Zigzag follows a corrective wave structure known as ABC, and we are currently in wave C.
Inner waves suggest that a minor upward move for wave 4 is still possible, but it won't last long.
LINK should head DOWN.
The target is the liquidity pool indicated on the chart.
Once this pool is swept, there will be a large wave B. LINK will rise once
LINK/USDT – Trendline Break Open Wave Higher🔵 BINANCE:LINKUSDT is testing a breakout above the descending H4 trendline after building a base around the recent lows.
I’m watching the 11.309–12.061 buy zone. If buyers defend this area and hold above the broken structure, the recovery setup remains intact.
🎯 Target: 13.44
Market Context: Chainlink received another institutional adoption boost after Further Asset Management integrated Chainlink’s compliance infrastructure into its tokenized-asset platform within Abu Dhabi’s ADGM.
A