LINK | Downtrend Broken, One Pool Sits AboveBy analyzing the #LINK (Chainlink) chart on the Daily timeframe, we can see a market that spent nine months in a downtrend, swept the liquidity beneath it, and has now broken both the structure and the trendlines that defined the entire decline.
━━━━━━━━━━━━━━━━━━━━
DAILY TIMEFRAME
━━━━━━━━━━━
LINKUSDT: Rising Wedge at $13.24 — Breakdown Needs ConfirmationAccording to Chainlink’s Q2 2026 review, more than $7B in token value migrated to CCIP during the quarter, while CCIP volume reached $4.9B, up 353% YoY. This supports the long-term institutional narrative, although the figures are reported by Chainlink and do not guarantee an immediate price breakou
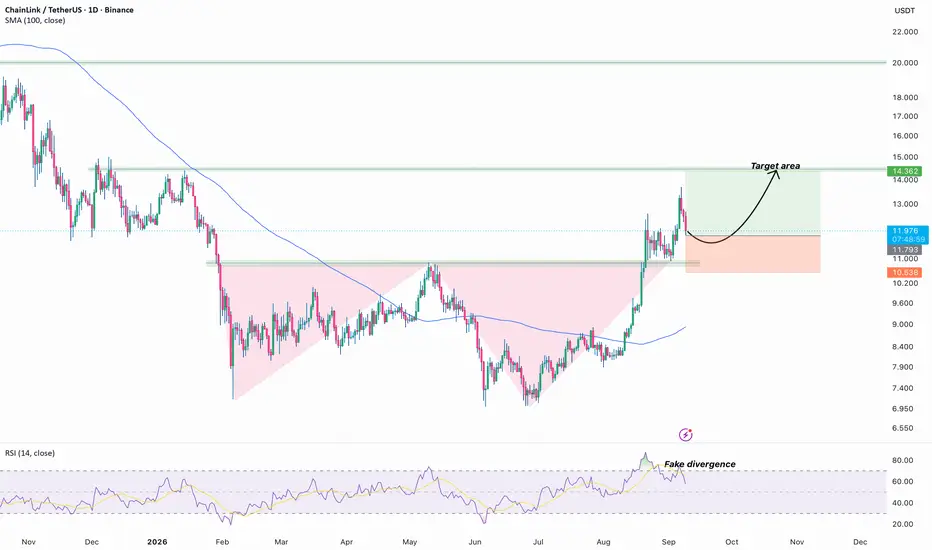
ChainLink/USDT (1D)Hi!
Trend: After a multi-month downtrend (price below SMA100), the 100-day SMA has flattened and turned up, an early sign of regime change from bearish to base-building.
Structure: a Double bottom (Feb–Apr, Jun–Aug) resolved as bullish continuations. The August breakout cleared the 11.000 resistan
LINK: Replicates Historical Multi-Month Base AccumulationLINK: Replicates Historical Multi-Month Base Accumulation – Macro Breakout Long Targeting $100 Ceiling
Chainlink (LINK) is flashing extraordinary macro accumulation signals on the weekly timeframe (1W), indicating that a major new expansion cycle is preparing to unfold. Over multi-year horizons, pri
Chainlink Is Waking Up | Is LINK Finally Ready to Run?Chainlink is showin renewed strength as the tokenization narrative continues to accelerate.
LINK is currently trading around $13.9, up 5% over the last 24 hours and 15% over the past 7 days, with roughly $925 million in daily trading volume. Its market cap is around $10.45 billion, while about 750
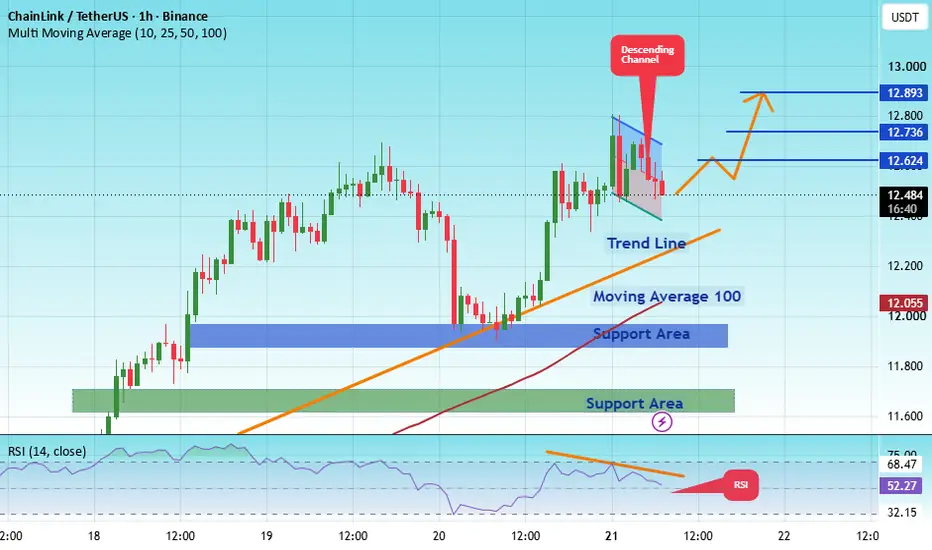
LINKUSDT – Triangle Pattern Breakout Loading?#LINK
The price is moving within a bearish channel on the 1-hour timeframe; it has reached the lower boundary and appears poised for a rebound, suggesting a potential upward move upon retesting this level.
The Relative Strength Index (RSI) indicates a bearish trend, but an upward breakout is likel
LINK / LINKUSDT Long Setup | Breaker Block ReclaimMARKET ANALYSIS
LINK is currently reacting from a key technical area highlighted on the chart.
As long as the protected support zone remains intact, the bullish market structure remains valid and higher liquidity targets may continue to attract price action.
A breakdown below the invalidation
$LINK | 1H | BUY SETUP |BINANCE:LINKUSDT just reclaimed $14 — but the number traders should be watching isn't on this chart.
Everyone's framing this as a clean breakout: the order block ($13.556–$13.341) held, price is defending it, next stop $13.980, then $14.806.
Here's what the setup doesn't price in. LINK's circulat
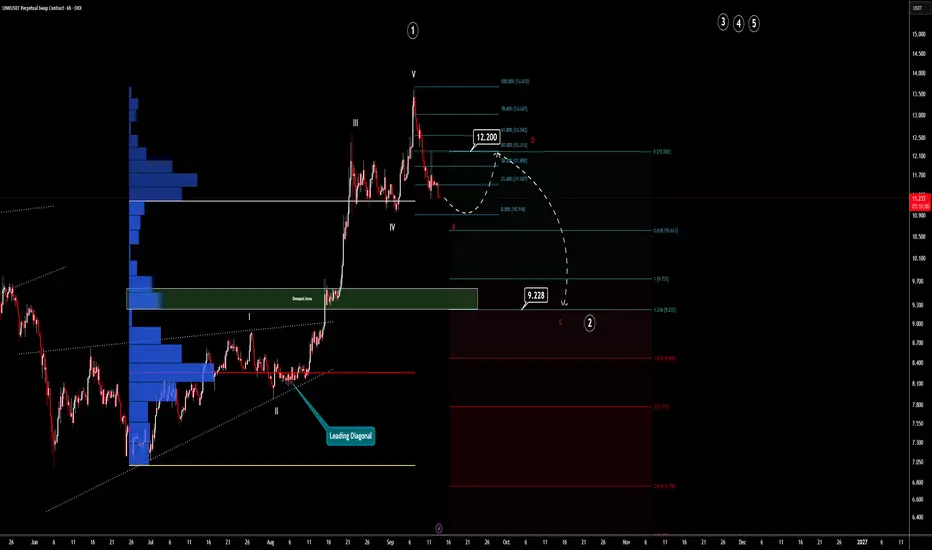
Textbook Wave Analysis (Link) 6HChainlink shows a clear sign that an inner impulsive move is coming to an end.
This chart shows a clear textbook illustration of Elliott Wave analysis.
After forming the diagonal, an impulsive move has ended. Now is the time for an A-B-C correction, and that small correction is going to create a w
See all ideas
Summarizing what the indicators are suggesting.
Oscillators
Neutral
Oscillators
Neutral
Summary
Neutral
Summary
Neutral
Summary
Neutral
Moving Averages
Neutral
Moving Averages
Neutral
Displays a symbol's price movements over previous years to identify recurring trends.