#LPTUSDT It can go up from this zone#LPT
The price is moving within a descending channel on the 1-hour timeframe and has reached the lower boundary. It is now poised for a bounce and is expected to retest this boundary.
The Relative Strength Index (RSI) indicates a downward trend, which is likely to continue given the overbought conditions.
There is a key support zone in green at 0.01746. The price has bounced off this zone several times, making it a strong support level.
The price is trending towards the 100-period moving average, which we are approaching. This trend supports an upward move.
Entry Price: 1.45
Target 1: 1.48
Target 2: 1.52
Target 3: 1.558
Stop Loss: At the resistance zone in green
Remember this simple rule: Money Management.
Any questions? Please leave a comment.
Thank you.
In-depth trading ideas
LPTUSDT Forming Bullish MomentumLPTUSDT is forming a clear bullish momentum pattern, a classic bullish wave signal that often indicates an upcoming breakout. The price has been consolidating within a narrowing range, suggesting that selling pressure is gradually weakening while buyers are beginning to regain control. With consistent trading volume confirming accumulation at lower levels, the current setup hints at a potential bullish breakout in the near future. The projected move could lead to an impressive gain of around 70% to 80% once the price breaks above the key resistance level.
This bullish momentum pattern is typically seen at the end of downtrends or corrective phases, representing a potential shift in market sentiment from bearish to bullish. Traders closely watching LPTUSDT are noticing strengthening momentum as the price approaches a critical breakout zone. Strong trading volume adds confidence to this setup, showing that market participants are positioning early in anticipation of a sustained upward move.
Growing investor interest in LPTUSDT reflects increasing confidence in the project's long-term fundamentals and its improving technical outlook. If the breakout is confirmed with sustained buying volume, it could mark the beginning of a fresh bullish leg. The ongoing consolidation phase suggests steady accumulation, creating favorable conditions for a strong continuation rally once the resistance level is cleared.
Traders may find this an attractive medium-term opportunity, especially as the bullish momentum pattern nears completion and buying pressure continues to build. A confirmed breakout could attract additional market participation and accelerate the move toward the projected upside target.
✅ Show your support by hitting the like button.
✅ Leaving a comment below! (What is You opinion about this Coin)
Your feedback and engagement keep me inspired to share more insightful market analysis with you!
#LPTUSDT It can go up from this zone#LPT
The price is moving within a descending channel on the 1-hour timeframe and has reached the lower boundary. It is now poised for a bounce and is expected to retest this boundary.
The Relative Strength Index (RSI) indicates a downward trend, which is likely to continue given the overbought conditions.
There is a key support zone in green at 1.16, and the price has bounced off this zone several times, making it a strong support level.
The price is trending towards the 100-period moving average, which we are approaching. This trend supports an upward move.
Entry Price: 1.25
First Target: 1.287
Second Target: 1.315
Third Target: 1.53
Stop Loss: At the resistance zone in green
Remember this simple rule: Money Management.
Any questions? Please leave a comment.
Thank you.
#LPTUSDT It can go up from this zone#LPT
The price is moving within a descending channel on the 1-hour timeframe and has reached the lower boundary. It is now poised for a bounce and is expected to retest this boundary.
The Relative Strength Index (RSI) indicates a downward trend, which is likely to continue given the overbought conditions.
There is a key support zone (in green) at 1.45, and the price has bounced off this zone several times, making it a strong support level.
The price is trending towards the 100-period moving average, which we are approaching. This trend supports an upward move.
Entry Price: 1.50
Target 1: 1.53
Target 2: 1.55
Target 3: 1.58
Stop Loss: At the resistance zone (in green)
Remember this simple rule: Money Management.
Any questions? Please leave a comment.
Thank you.
#LPTUSDT It can go up from this zone#LPT
The price is moving within a descending channel on the 1-hour timeframe and has reached the lower boundary. It is now poised for a bounce and is expected to retest this boundary.
The Relative Strength Index (RSI) indicates a downward trend, which is likely to continue given the overbought conditions.
There is a key support zone (in green) at 1.56, and the price has bounced off this zone several times, making it a strong support level.
The price is trending towards the 100-period moving average, which we are approaching. This trend supports an upward move.
Entry Price: 1.73
Target 1: 1.76
Target 2: 1.83
Target 3: 1.89
Stop Loss: At the resistance zone (in green)
Remember this simple rule: Money management.
Any questions? Please leave a comment.
Thank you.
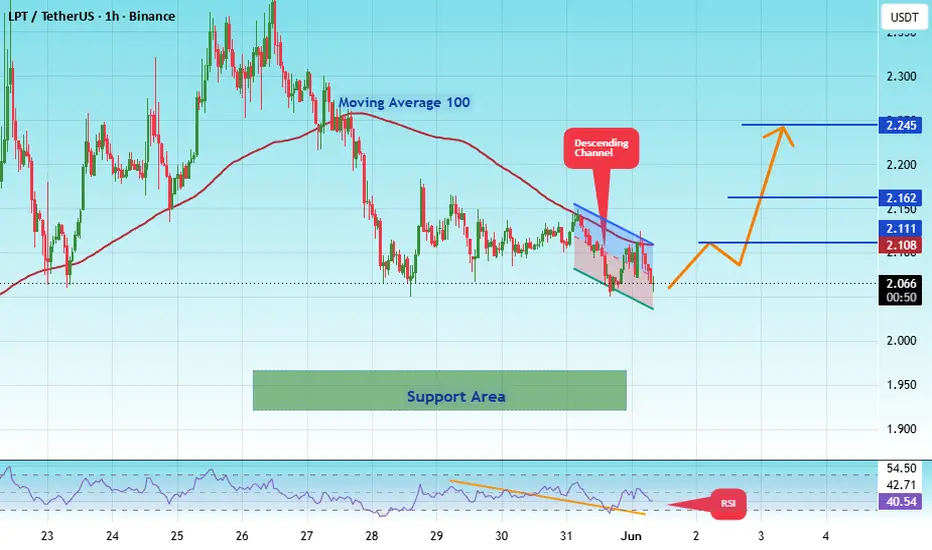
#LPTUSDT It can go up from this zone#LPT
The price is moving within a descending channel on the 1-hour timeframe and has reached the lower boundary. It is now poised for a bounce and is expected to retest this boundary.
The Relative Strength Index (RSI) indicates a downward trend, which is likely to continue given the overbought conditions.
There is a key support zone (in green) at 1.92, and the price has bounced off this zone several times, making it a strong support level.
The price is trending towards the 100-period moving average, which we are approaching. This trend supports an upward move.
Entry Price: 2.07
First Target: 2.11
Second Target: 2.16
Third Target: 2.24
You can stop at the first and second targets and close below them, or continue towards the third target.
Stop Loss: At the resistance zone (in green).
Remember this simple rule: Money Management.
Any questions? Please leave a comment.
Thank you.
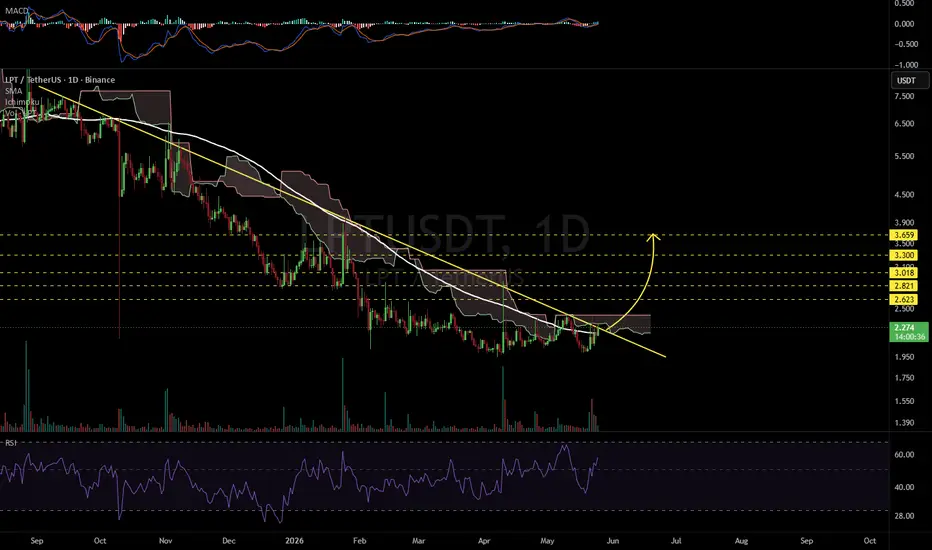
LPTUSDT 1D#LPT is attempting to break above a major resistance cluster, including the descending resistance, the Ichimoku cloud, and the daily SMA100. RSI and MACD are showing signs of a potential bullish move. In case of a breakout, the upside targets are:
🎯 $2.623
🎯 $2.821
🎯 $3.018
🎯 $3.300
🎯 $3.659
⚠️ Always use a tight stop-loss and maintain proper risk management.
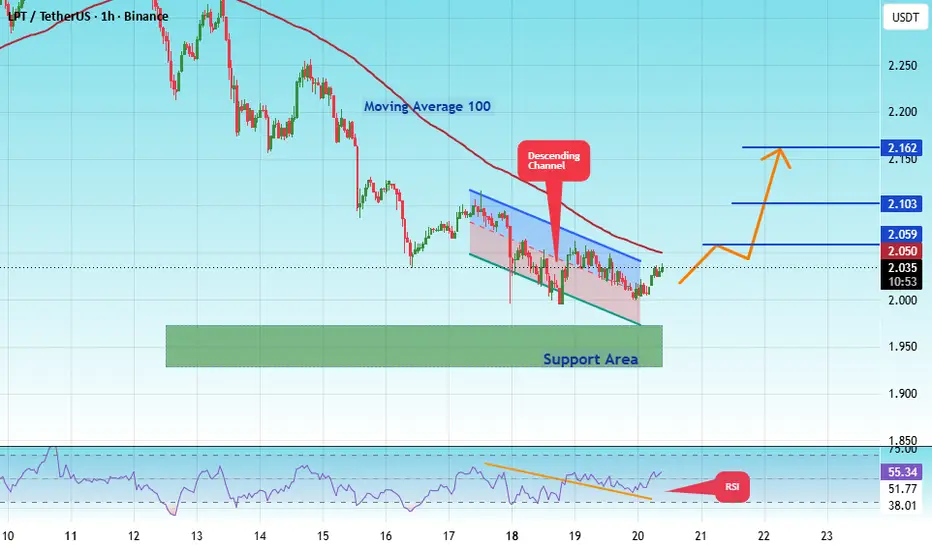
#LPTUSDT It can go up from this zone#LPT
The price is moving within a descending channel on the 1-hour timeframe and has reached the lower boundary. It is now poised for a bounce and is expected to retest this boundary.
The Relative Strength Index (RSI) indicates a downward trend, which is likely to continue given the overbought conditions.
There is a key support zone (in green) at 1.93, and the price has bounced off this zone several times, making it a strong support level.
The price is trending towards the 100-period moving average, which we are approaching. This trend supports an upward move.
Entry Price: 2.02
First Target: 2.06
Second Target: 2.10
Third Target: 2.16
You can stop at the first and second targets and close below them, or continue towards the third target. Stop Loss: At the resistance zone (in green).
Remember this simple rule: Money Management.
Any questions? Please leave a comment.
Thank you.
#LPTUSDT It can go up from this zone#LPT
The price is moving within a descending channel on the hourly timeframe. It has reached the lower boundary and is trending towards a bounce. A retest of this boundary is expected.
The Relative Strength Index (RSI) indicates a downward trend, and this trend is likely to continue due to the overbought condition.
A key support zone (in green) has been found at 1.96. The price has bounced off this zone several times, making it a strong support level.
The price is trending towards the 100-period moving average, which we are approaching. This trend supports an upward move.
Entry Price: 2.14
First Target: 2.167
Second Target: 2.20
Third Target: 2.25
You can close at the second target or wait for the third target to be reached. The choice is yours.
Stop Loss: At the resistance zone (in green).
Remember this simple rule: Money Management.
Any questions? Please leave a comment.
Thank you.
#LPTUSDT It can go up from this zone#LPT
The price is moving within a descending channel on the hourly timeframe. It has reached the lower boundary and is trending towards a bounce. A retest of this boundary is expected.
The Relative Strength Index (RSI) indicates a downward trend, and this trend is likely to continue due to the overbought condition.
A key support zone (in green) has been found at 1.95. The price has bounced off this zone several times, making it a strong support level.
The price is trending towards the 100-period moving average, which we are approaching. This trend supports an upward move.
Entry Price: 2.07
First Target: 2.11
Second Target: 2.15
Third Target: 2.20
You can close at the second target or wait for the third target to be reached. The choice is yours.
Stop Loss: At the resistance zone (in green).
Remember this simple rule: Money Management.
Any questions? Please leave a comment.
Thank you.
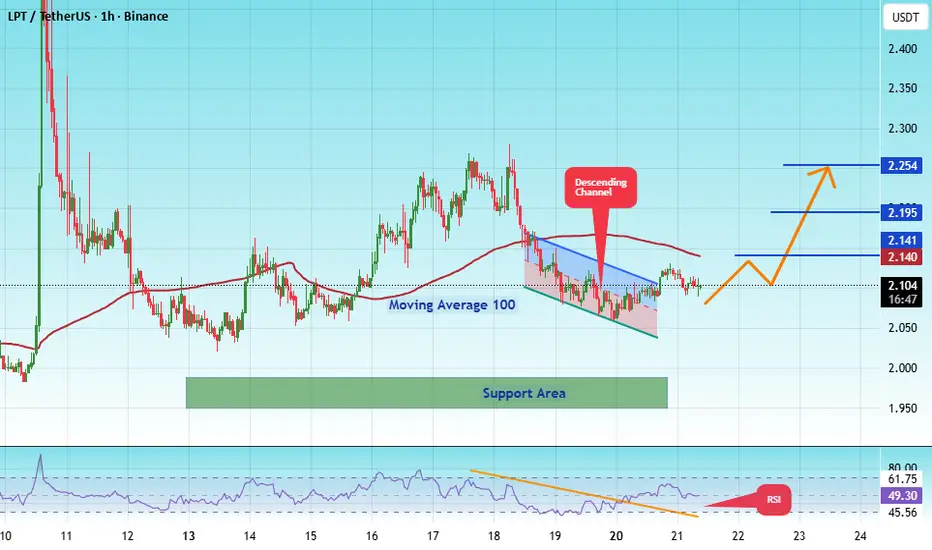
#LPTUSDT It can go up from this zone#LPT
The price is moving within a descending channel on the 1-hour timeframe and has reached the lower boundary. It is now poised for a bounce and is expected to retest this boundary.
The Relative Strength Index (RSI) indicates a downward trend, which is likely to continue given the overbought conditions.
There is a key support zone in green at 1.95, and the price has bounced off this zone several times, making it a strong support level.
The price is trending towards the 100-period moving average, which we are approaching. This trend supports an upward move.
Entry Price: 2.10
First Target: 2.14
Second Target: 2.19
Third Target: 2.24
You can stop at the first and second targets and close the price, or continue to the third target.
Stop Loss: At the resistance zone in green.
Remember this simple rule: Money Management.
Any questions? Please leave a comment.
Thank you.
LPTUSDT Forming Falling WedgeLPTUSDT is forming a clear falling wedge pattern, a classic bullish reversal signal that often indicates an upcoming breakout. The price has been consolidating within a narrowing range, suggesting that selling pressure is weakening while buyers are beginning to regain control. With consistent volume confirming accumulation at lower levels, the setup hints at a potential bullish breakout soon. The projected move could lead to an impressive gain of around 90% to 100% once the price breaks above the wedge resistance.
This falling wedge pattern is typically seen at the end of downtrends or corrective phases, and it represents a potential shift in market sentiment from bearish to bullish. Traders closely watching LPTUSDT are noting the strengthening momentum as it nears a breakout zone. The good trading volume adds confidence to this pattern, showing that market participants are positioning early in anticipation of a reversal.
Investors’ growing interest in LPTUSDT reflects rising confidence in the project’s long-term fundamentals and current technical strength. If the breakout confirms with sustained volume, this could mark the start of a fresh bullish leg. Traders might find this a valuable setup for medium-term gains, especially as the wedge pattern completes and buying momentum accelerates.
✅ Show your support by hitting the like button and
✅ Leaving a comment below! (What is your opinion about this Coin?)
Your feedback and engagement keep me inspired to share more insightful market analysis with you!
#LPT/USDT It can go up from this zone#LPT
The price is moving within a descending channel on the hourly timeframe. It has reached the lower boundary and is heading towards a breakout, with a retest of the upper boundary expected.
The Relative Strength Index (RSI) is showing a downward trend, approaching the lower boundary, and an upward bounce is anticipated.
There is a key support zone in green at 2.24, and the price has bounced from this level several times. Another bounce is expected.
The indicator is showing a trend towards consolidation above the 100-period moving average, which we are approaching, supporting the upward move.
Entry Price: 2.28
First Target: 2.39
Second Target: 2.50
Third Target: 2.63
Stop Loss: Below the green support zone.
Remember this simple thing: Money management.
For any questions, please leave a comment.
Thank you.
#LPT/USDT It can go up from this zone#LPT
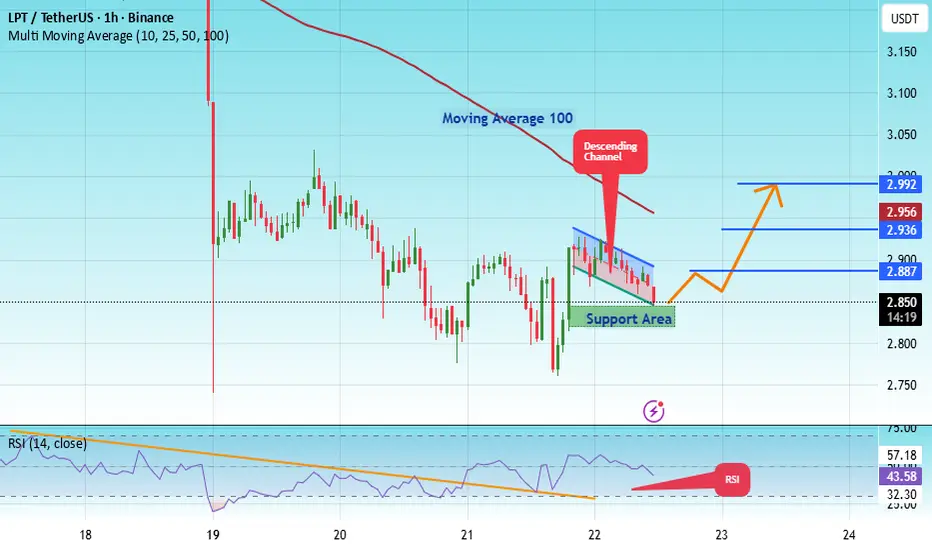
The price is moving within a descending channel on the hourly timeframe. It has reached the lower boundary and is heading towards a breakout, with a retest of the upper boundary expected.
The Relative Strength Index (RSI) is showing a downward trend, approaching the lower boundary, and an upward bounce is anticipated.
There is a key support zone in green at 2.83, and the price has bounced from this level several times. Another bounce is expected.
The RSI is showing a trend towards consolidation above the 100-period moving average, which we are approaching, supporting the upward move.
Entry Price: 2.85
First Target: 2.88
Second Target: 2.93
Third Target: 2.99
Stop Loss: Below the green support zone.
Remember this simple thing: Money management.
For any questions, please leave a comment.
Thank you.
LPTUSDT Forming Falling WedgeLPTUSDT is forming a clear falling wedge pattern, a classic bullish reversal signal that often indicates an upcoming breakout. The price has been consolidating within a narrowing range after the recent down move, suggesting that selling pressure is steadily losing its grip while buyers are beginning to step in more confidently. With consistent volume confirming accumulation at these lower levels, the setup is pointing toward a potential bullish breakout in the near term. Should the price break and hold above the upper wedge resistance, we could see a strong rally delivering gains in the range of 90% to 100% from the breakout point.
This falling wedge pattern is typically seen at the end of downtrends or during corrective phases, and it serves as a reliable sign that market sentiment may be shifting from bearish to bullish. Traders closely watching LPTUSDT are observing a similar strengthening momentum as it approaches its own breakout zone. The solid trading volume supporting the pattern adds real credibility, showing that market participants are getting positioned early in anticipation of a reversal.
The growing interest in LPTUSDT is fueled by increasing belief in the project’s long-term fundamentals combined with this attractive technical structure. A confirmed breakout backed by sustained volume could trigger the start of a fresh bullish leg. Traders might view this as a compelling setup for medium-term gains, especially once the wedge pattern fully resolves and buying pressure starts to accelerate.
✅ Show your support by hitting the like button and
✅ Leaving a comment below! (What is your opinion about this Coin)
Your feedback and engagement keep me inspired to share more insightful market analysis with you!
LPTUSDT About to Break Out or Break Down? Yello Paradisers! Have you been watching LPT sink deeper into the descending channel and wondering if it’s finally time for a reversal or if another trap is about to wipe out impatient traders again? This setup is shaping up to be one of those textbook opportunities where discipline will separate winners from losers.
💎#LPTUSDT has been moving inside a clear descending channel, with price action consistently printing lower lows and respecting both resistance and support lines. However, it has now reached a major inflection point. The asset is sitting right on a strong support zone, a level that has previously attracted demand and triggered significant reactions in the past. What makes this setup even more intriguing is the convergence of technical signals that could be indicating a short-term bullish reversal.
💎On the momentum side, the MACD is flashing a bullish crossover, and we’re also spotting a bullish divergence between the price and momentum. This is often one of the earliest signs of trend exhaustion in a downtrend. These signals become even more meaningful when combined with the current price position within the descending channel structure. If the support holds, and the divergence plays out, we could see a strong rally first into the minor resistance area near $3.00 and potentially into the major resistance zone above $3.10.
💎However, the invalidation level is clearly defined at $2.782. If the price is accepted below this level, the setup is no longer valid, and the idea must be abandoned immediately.
The market is full of noise, and fake breakouts are designed to punish the emotional and reward the disciplined. Be the latter. Stay sharp, Paradisers.
MyCryptoParadise
iFeel the success🌴
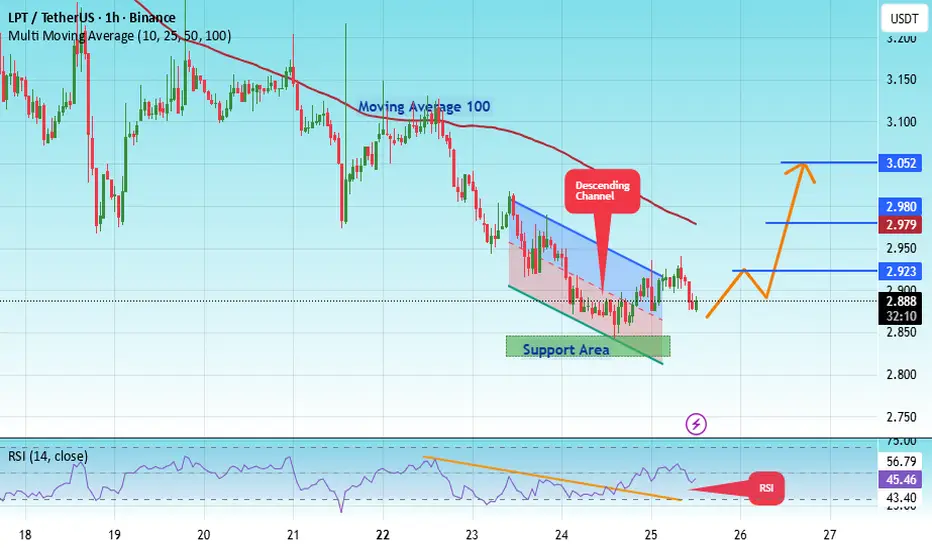
#LPT/USDT It can go up from this zone#LPT
The price is moving in a descending channel on the 1-hour timeframe. It has reached the lower boundary and is heading towards breaking above it, with a retest of the upper boundary expected.
We have a downtrend on the RSI indicator, which has reached near the lower boundary, and an upward rebound is expected.
There is a key support zone in green at 2.85. The price has bounced from this zone multiple times and is expected to bounce again.
We have a trend towards stability above the 100-period moving average, as we are moving close to it, which supports the upward movement.
Entry price: 2.90
First target: 2.99
Second target: 3.077
Third target: 3.18
Stop loss: Below the support zone in green.
Don't forget a simple thing: capital management.
For inquiries, please leave a comment.
Thank you.
#LPT/USDT Forming Falling Wedge#LPT
The price is moving in a descending channel on the 1-hour timeframe. It has reached the lower boundary and is heading towards breaking above it, with a retest of the upper boundary expected.
We have a downtrend on the RSI indicator, which has reached near the lower boundary, and an upward rebound is expected.
There is a key support zone in green at 2.83. The price has bounced from this zone multiple times and is expected to bounce again.
We have a trend towards consolidation above the 100-period moving average, as we are moving close to it, which supports the upward movement.
Entry price: 2.88
First target: 2.92
Second target: 2.97
Third target: 3.05
Don't forget a simple principle: money management.
Place your stop-loss below the support zone in green.
For any questions, please leave a comment.
Thank you.
#LPT/USDT Forming Falling Wedge#LPT
The price is moving in a descending channel on the 1-hour timeframe. It has reached the lower boundary and is heading towards breaking above it, with a retest of the upper boundary expected.
We have a downtrend on the RSI indicator, which has reached near the lower boundary, and an upward rebound is expected.
There is a key support zone in green at 3.40. The price has bounced from this zone multiple times and is expected to bounce again.
We have a trend towards consolidation above the 100-period moving average, as we are moving close to it, which supports the upward movement.
Entry price: 3.47
First target: 3.50
Second target: 3.57
Third target: 3.64
Don't forget a simple principle: money management.
Place your stop-loss below the green support zone.
For any questions, please leave a comment.
Thank you.
$LPT/USDT (Swing)TRADE – $LPT/USDT (Swing)
Type: LONG
Mode: Spot / Futures (Low Leverage)
Entry Zone: 3.40 – 3.70
This zone aligns with the weekly demand area where price has historically reacted and selling pressure is clearly slowing.
Targets:
TP1: 6.00
TP2: 9.20
TP3: 14.80
TP4: 25.50
Stop Loss: 2.65
This level sits below the weekly demand and invalidates the long-term support if broken.
On the 1-week chart, LPT/USDT is in a clear long-term bearish structure that started after the strong rally and distribution phase near the previous highs. Since that peak, price has consistently formed lower highs and lower lows, showing that sellers have remained in control for an extended period. The descending trendline drawn from the top has been respected multiple times, confirming that every major bounce has been sold into rather than accepted as a trend change. As price moved lower, momentum gradually weakened, and the recent decline has brought LPT back into a very important historical support zone around the 3.4–3.6 area. This zone acted as a base in the past and is now being retested after a full cycle of downside movement. On the weekly candles, the bodies are becoming smaller and the wicks are more visible near this level, which shows that selling pressure is no longer as aggressive as before and buyers are starting to absorb supply at this price. Even so, the overall market structure is still bearish because there is no higher high or higher low formed yet, and price is still trading well below the long-term descending resistance. At the same time, the downside momentum appears to be slowing, suggesting that the market may be entering a consolidation or accumulation phase rather than continuing a sharp drop. In summary, LPT is sitting at a major long-term support after a prolonged downtrend, selling strength is weakening, but the weekly trend remains negative until price can break the long-term descending trendline and show a clear structural shift.
#LPT/USDT Forming Falling Wedge#LPT
The price is moving within an ascending channel on the 1-hour timeframe and is adhering to it well. It is poised to break out strongly and retest the channel.
We have a downtrend line on the RSI indicator that is about to break and retest, which supports the upward move.
There is a key support zone in green at the price of 3.94, representing a strong support point.
We have a trend of consolidation above the 100-period moving average.
Entry price: 3.99
First target: 4.10
Second target: 4.20
Third target: 4.34
Don't forget a simple money management rule:
Place your stop-loss order below the support zone in green.
Once the first target is reached, save some money and then change your stop-loss order to an entry order.
For any questions, please leave a comment.
Thank you.
#LPT/USDT Forming Falling Wedge
#LPT
The price is moving within an ascending channel on the 1-hour timeframe and is adhering to it well. It is poised to break out strongly and retest the channel.
We have a downtrend line on the RSI indicator that is about to break and retest, which supports the upward move.
There is a key support zone in green at the 5.00 price level, representing a strong support point.
We have a trend of consolidation above the 100-period moving average.
Entry price: 5.13
First target: 5.25
Second target: 5.36
Third target: 5.52
Don't forget a simple money management rule:
Place your stop-loss order below the green support zone.
Once you reach the first target, save some money and then change your stop-loss order to an entry order.
For any questions, please leave a comment.
Thank you.