LQTYUSDT 2D#LQTY is trading within a falling wedge pattern on the 2-day timeframe. A confirmed breakout above both the 50-day SMA and the wedge resistance could trigger a bullish move toward the following upside targets:
🎯 $0.2612
🎯 $0.2925
🎯 $0.3238
🎯 $0.3683
🎯 $0.4250
⚠️ Always remember to use a tight stop-loss and maintain proper risk management.
In-depth trading ideas
LQTYUSDT: Descending Trendline Under Pressure Breakout Incoming?📊 Technical Analysis — LQTY/USDT
⏳ Time Frame: 2D
📐 Pattern: Descending Trendline 📉
💰 Current Price: ~0.2045 USDT
---
🔻📉 Trend Structure
📉 LQTY remains in a medium-to-long-term downtrend, characterized by a series of Lower Highs & Lower Lows 🔻🔻.
🟡📐 The Descending Trendline has acted as dynamic resistance since the peak around $1.65, making a trendline breakout an important signal for a potential momentum shift ⚡📈.
📍🎯 Price is currently approaching the $0.2100 area, which represents the init
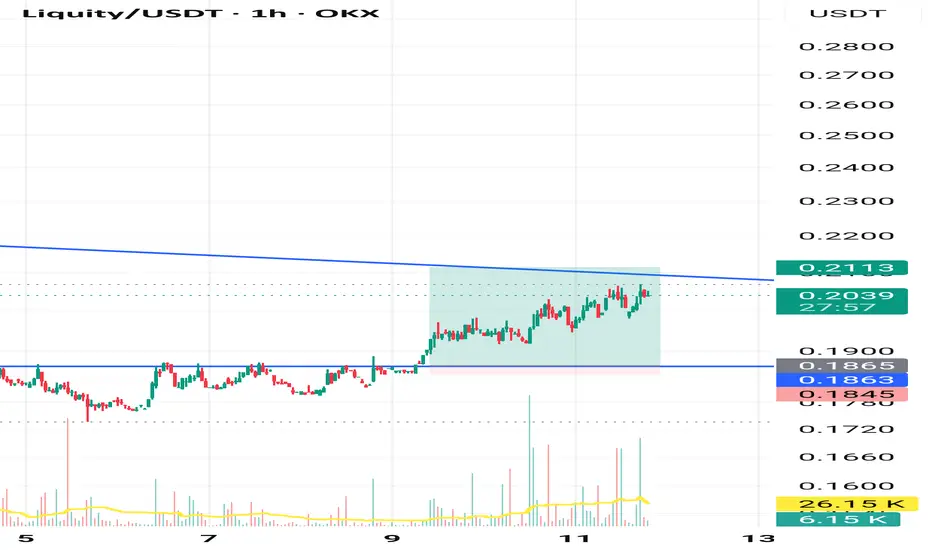
LQTYUSDT Forming Bullish MomentumLQTYUSDT is forming a clear bullish momentum pattern, a classic bullish wave signal that often indicates an upcoming breakout. The price has been consolidating within a narrowing range, suggesting that selling pressure is weakening while buyers are beginning to regain control. With consistent volume confirming accumulation at lower levels, the setup hints at a potential bullish breakout soon. The projected move could lead to an impressive gain of around 70% to 80% once the price breaks above the
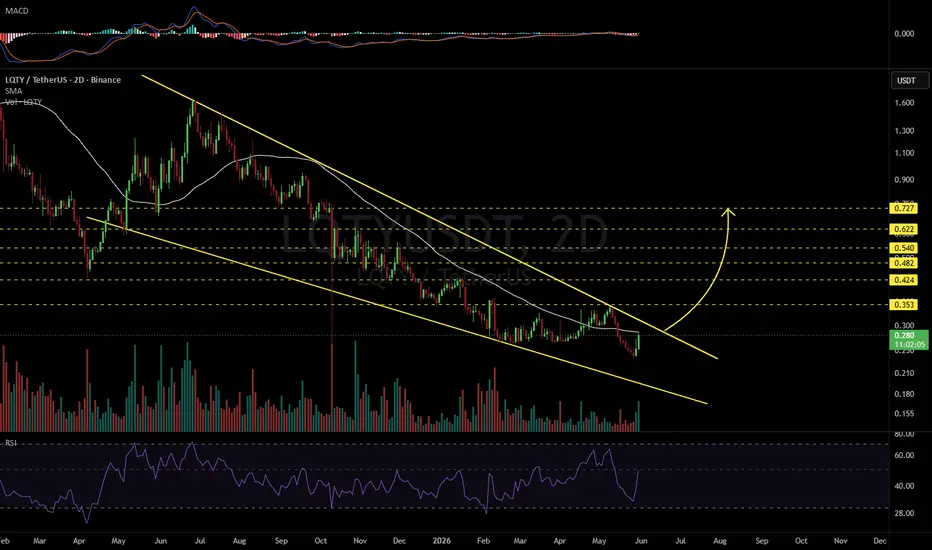
LQTYUSDT 2D#LQTY is currently trading within a falling wedge pattern on the 2-day chart. A confirmed breakout above both the wedge resistance and the 2-day SMA50 would strengthen the bullish outlook and open the path toward the following upside targets:
🎯 $0.353
🎯 $0.424
🎯 $0.482
🎯 $0.540
🎯 $0.622
🎯 $0.727
⚠️ Always remember to use a tight stop-loss and maintain proper risk management.
Liquity (LQTY) · Perfect Bottom · Bullish until March 2029A new bull market is starting now. Liquity (LQTYUSDT) went through a classic ABC correction. Dates from December 2024 until October 2025 followed by a higher low Feb-April 2026. This completes the entire bearish period coupled with a recovery. What I am calling a recovery here is nothing more than a bottom reversal signal. Recovery from a true bottom rather than a full price recovery. For a full recovery, we need a strong bullish wave and this is what comes next. Long-term growth—period.
Nothin
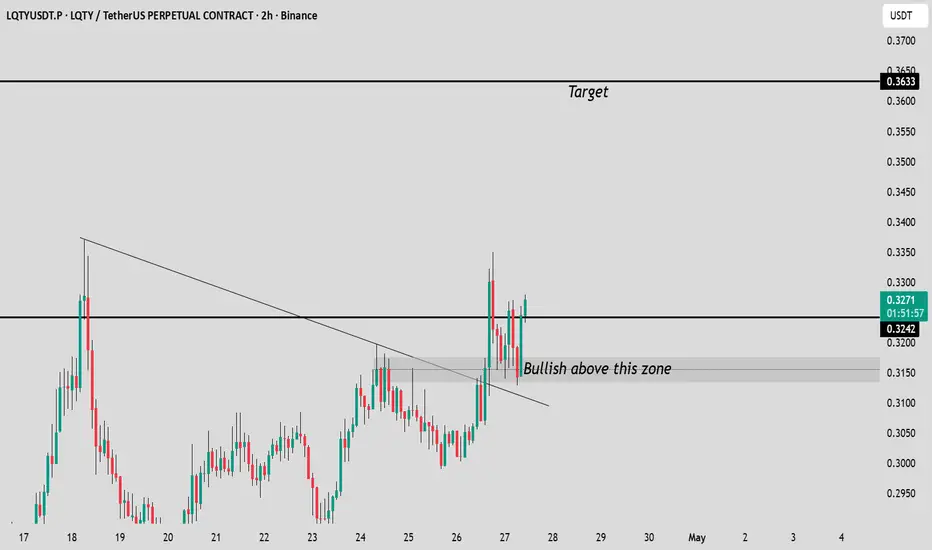
LQTY / USDT Holding Strength — Bullish Continuation Toward $0.36LQTY / USDT is showing solid strength and remains bullish as long as price holds above the $0.3150 support level. While this structure stays intact, there is a high probability of continuation toward and beyond the $0.3630 target. Wait for proper confirmation before entering and manage risk wisely to avoid unnecessary exposure. 🚀
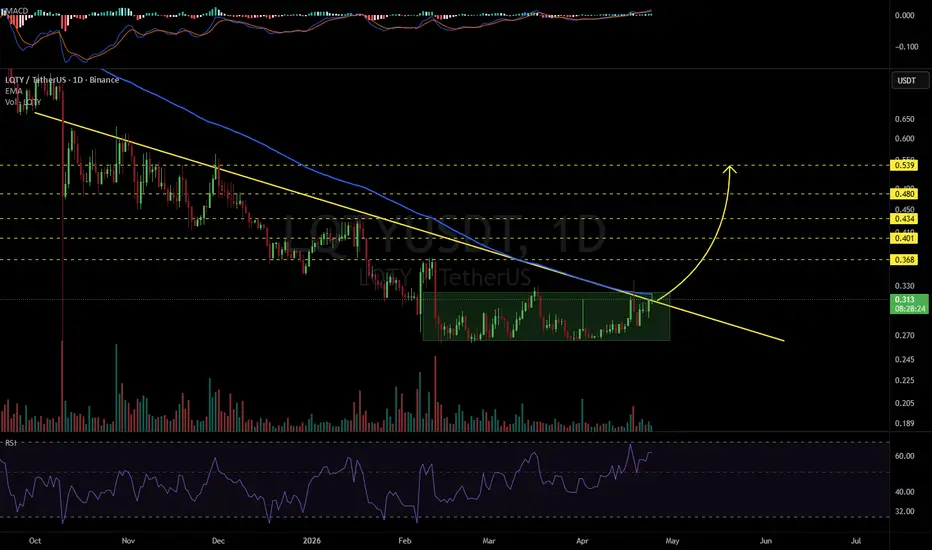
LQTYUSDT 1D#LQTY is trading within a range and is attempting to break out above the range and the descending resistance, along with the EMA100 on the daily chart. If that occurs, the upside targets are:
🎯 $0.368
🎯 $0.401
🎯 $0.434
🎯 $0.480
🎯 $0.539
⚠️ Always remember to use tight stop-losses and maintain proper risk management.
LQTYUSDT – Descending Triangle Breakdown Opens the Door to LowerThe weekly chart shows a clear descending triangle formation, characterized by a series of lower highs pressing toward a flat horizontal support zone. This type of structure is typically considered a bearish continuation pattern, reflecting consistent selling pressure.
Recently, price has broken below the horizontal support , confirming the triangle breakdown and signaling potential continuation to the downside. The market failed to reclaim the support area, which now acts as resistance.
Ke
LQTYUSDT 1D#LQTY is trading within a falling wedge pattern on the daily chart. If price breaks above both the wedge resistance and the daily SMA50, the potential upside targets are:
🎯 $0.403
🎯 $0.470
🎯 $0.525
🎯 $0.580
🎯 $0.657
🎯 $0.756
⚠️ Always apply tight stop-losses and maintain strict risk management.
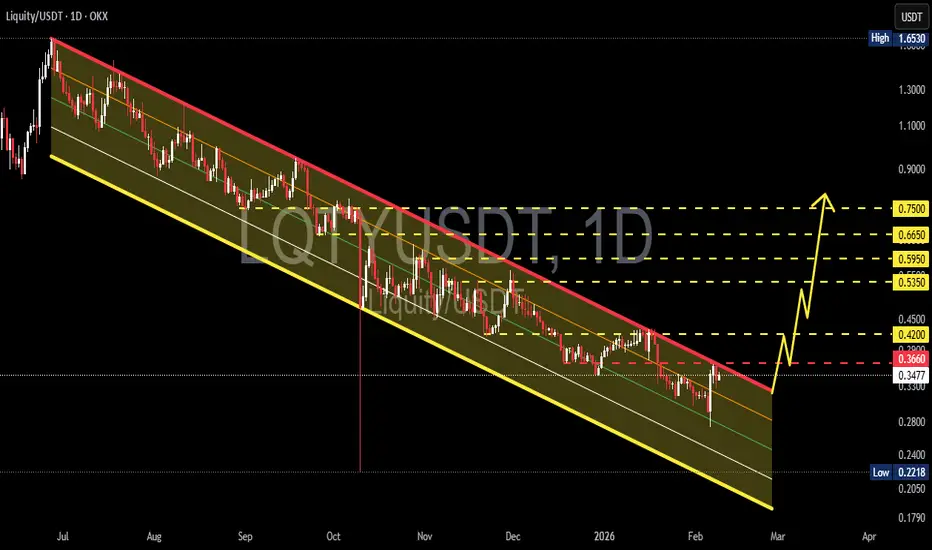
LQTY/USDT at a Critical Point — Breakout or Further Correction?On the 1D timeframe, LQTY/USDT remains in a well-defined mid-term downtrend structure. Price has been moving consistently inside a descending parallel channel since the mid-2025 peak.
The formation of lower highs and lower lows is still intact, indicating sellers remain in control. However, price is now approaching the upper channel resistance, opening the possibility of a transition phase — either a breakout reversal or another continuation rejection.
---
Pattern Explanation
Descending Par
LQTY - Flashing BullishLQTY Daily SuperTrend flashing possible bullish reversal. Seriously though its rarely a fake out on the daily...and even when it is it still produces a 25%+ gain and thats without adding leverage.
We should have a solid confirmation in 20 minutes if the current daily candle closes out green.
MACD been ramping up since November about to flip back to macro Bullish very soon.
LQTY/USDT at Critical Level — Break Trendline or Downtrend?LQTY/USDT on the Daily (1D) timeframe remains in a primary downtrend that has been in place since the price peaked around 1.65 USDT. Price is still moving below the descending trendline, indicating that selling pressure remains dominant despite a minor buyer reaction from the lower support area.
The overall price structure continues to form lower highs and lower lows, confirming that the market has not yet exited the bearish phase.
---
Pattern Analysis
The chart clearly shows a Descending C
LQTYUSDT 1D#LQTY daily chart looks promising. RSI and MACD are showing potential bullish momentum. Price has broken above the daily SMA50 and the Ichimoku cloud, but the daily candle hasn’t closed yet. Volume has increased and price has reached the descending resistance. The structure is bullish. In case of a breakout above the descending resistance, the potential targets are:
🎯 $0.680
🎯 $0.742
🎯 $0.832
🎯 $0.946
🎯 $1.056
⚠️ Always remember to protect your capital with a proper stop-loss and disciplined r
LQTYUSDT 1D#LQTY is moving toward the descending resistance on the daily chart, with a noticeable increase in trading volume. In case of a breakout above the daily SMA50 and the descending resistance, the potential upside targets are:
🎯 $0.667
🎯 $0.790
🎯 $0.890
🎯 $0.989
🎯 $1.130
🎯 $1.310
⚠️ Always remember to use a tight stop-loss and maintain proper risk management.
LQTYUSDT UPDATE#LQTY
UPDATE
LQTY Technical Setup
Pattern: Bullish Falling Wedge
Current Price: $0.530
Target Price: $1.118
Target % Gain: 100.46%
$LQTY is breaking out of a bullish falling wedge pattern on the 1D timeframe. The current price is $0.530 with a projected target near $1.118, offering around 100% potential upside. The breakout suggests growing bullish momentum and potential for further continuation.
Time Frame: 1D
Risk Management Tip: Always use proper risk management.
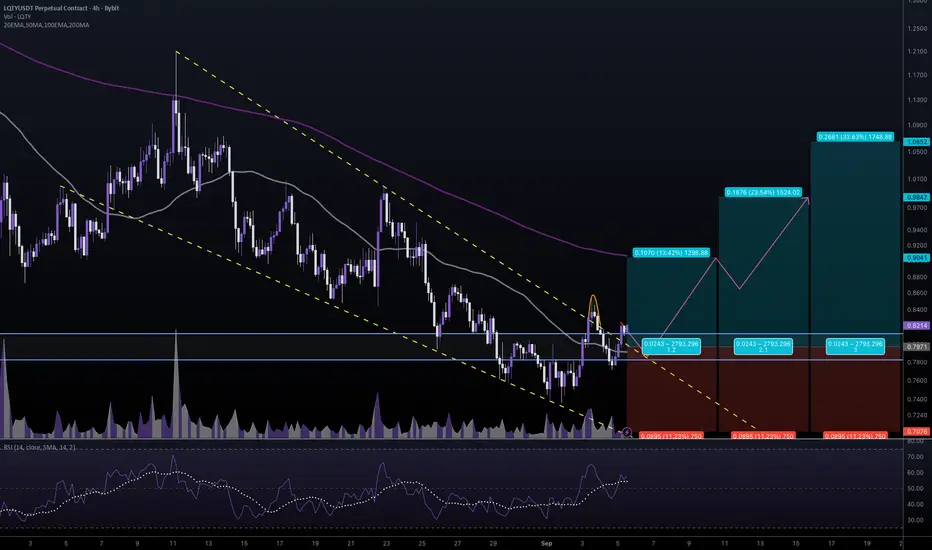
#LQTYUSDT #4h (Bitget Futures) Faling wedge breakout and retestLiquity just regained 50MA support after a first deviation, seems likely to resume bullish towards 200MA resistance and more.
⚡️⚡️ #LQTY/USDT ⚡️⚡️
Exchanges: Bitget Futures
Signal Type: Regular (Long)
Leverage: Isolated (4.0X)
Amount: 4.5%
Current Price:
0.8214
Entry Zone:
0.8116 - 0.7826
Take-Profit Targets:
1) 0.9041
2) 0.9847
3) 1.0652
Stop Targets:
1) 0.7076
Published By: @Zblaba
$LQTY BITGET:LQTYUSDT.P #4h #Liquity #DeFi liquity.org
Risk/Reward= 1:1.2 | 1:2.1 | 1:3.0
Expected Prof
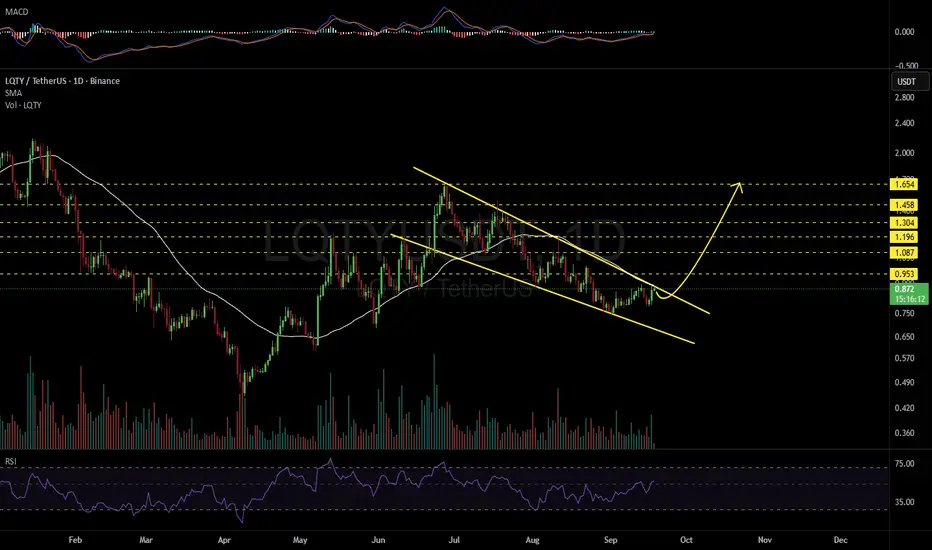
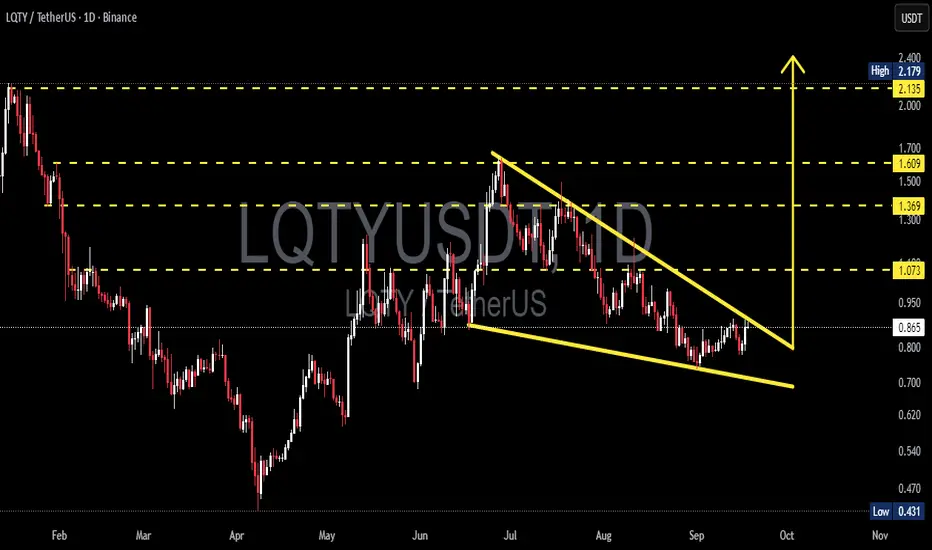
LQTY/USDT — Falling Wedge, Key Reversal Opportunity?On the daily timeframe (1D), the LQTY/USDT pair is showing an interesting setup. The price is currently trading around 0.862 USDT, approaching the upper boundary of a falling wedge pattern that has been developing since late July.
---
🔎 Main Pattern: Falling Wedge
A falling wedge forms when the market prints lower highs and lower lows within a narrowing range.
This formation is typically considered a bullish reversal pattern, often leading to an upside breakout if supported by strong volume.