Lrcusdt longInstructions:
Entry point: yellow
Stop loss: red
Take profit: green
👉Leverage x 5-10-20 for crypto
👉Leverage x 20-50-100 for commodities, stocks, indices, and forex
👉Margin 1-5% max.
Always practice risk and money management.
Invest a maximum of 5% on any trade or across all your trades.
Invest on
Lrcusdt longInstructions:
Entry point: yellow
Stop loss: red
Take profit: green
👉Leverage x 5-10-20 for crypto
👉Leverage x 20-50-100 for commodities, stocks, indices, and forex
👉Margin 1-5% max.
Always practice risk and money management.
Invest a maximum of 5% on any trade or across all your trades.
Invest on
lrcusdt longInstructions:
Entry point: yellow
Stop loss: red
Take profit: green
👉Leverage x 5-10-20 for crypto
👉Leverage x 20-50-100 for commodities, stocks, indices, and forex
👉Margin 1-5% max.
Always practice risk and money management.
Invest a maximum of 5% on any trade or across all your trades.
Invest on
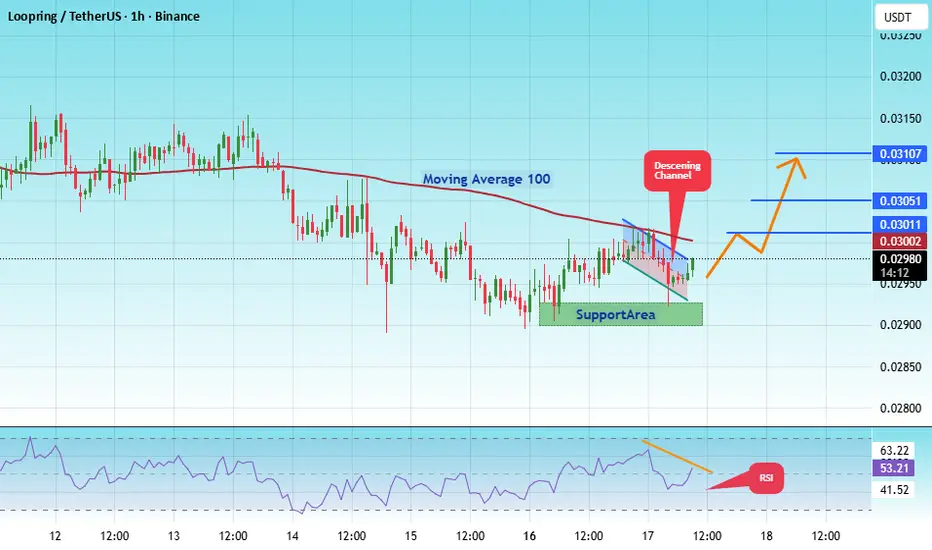
#LRC/USDT Ready to go up#LRC
The price is moving within a descending channel on the hourly timeframe. It has reached the lower boundary and is trending towards a bounce. A retest of this boundary is expected.
The Relative Strength Index (RSI) indicates a downward trend, and this trend is likely to continue due to the ove
LRC to print 3 cents to $3 in 100x move? - February 2026It’s Christmas out there and everyone is asking scrooge for a handout. Don’t you see it? Sellers want out at any cost, bills have to be paid. For us, the 5%, that’s a Gift horse. Now whip on your jodhpur's and ride this 100x idea before the FOMO gang shows up. Another opportunity like this will not
#LRC/USDT Ready to go up#LRC
The price is moving in a descending channel on the 1-hour timeframe. It has reached the lower boundary and is heading towards breaking above it, with a retest of the upper boundary expected.
We have a downtrend on the RSI indicator, which has reached near the lower boundary, and an upward reb
LRC Buy/Long Signal (4H)We have a liquidity pool on the chart that, if swept, could allow the price to rebound strongly upwards. There are two lows, with buyer stop-losses placed just below them.
We have two entry points, which can be entered using a DCA (Dollar-Cost Averaging) approach.
Targets are marked on the chart.
RLCUSDT LONG SIGNAL📢 Trade Setup – LRC/USDT
📈 Position: LONG
💰 Entry Zone:
0.04957 – 0.05050
(Reclaim & retest of broken descending trendline)
🛑 Stop-Loss:
0.04750
(Invalidation below recent higher low)
🎯 Take-Profit Targets:
• TP1: 0.05184
• TP2: 0.05361
• TP3: 0.05584
TP4, 05828
📊 Timeframe: 1H
⚖️ Risk/Reward: Favor
LRCUSDT Forming Falling WedgeLRCUSDT is forming a clear falling wedge pattern, a classic bullish reversal signal that often indicates an upcoming breakout. The price has been consolidating within a narrowing range, suggesting that selling pressure is weakening while buyers are beginning to regain control. With consistent volume
See all ideas
Summarizing what the indicators are suggesting.
Oscillators
Neutral
SellBuy
Strong sellStrong buy
Strong sellSellNeutralBuyStrong buy
Oscillators
Neutral
SellBuy
Strong sellStrong buy
Strong sellSellNeutralBuyStrong buy
Summary
Neutral
SellBuy
Strong sellStrong buy
Strong sellSellNeutralBuyStrong buy
Summary
Neutral
SellBuy
Strong sellStrong buy
Strong sellSellNeutralBuyStrong buy
Summary
Neutral
SellBuy
Strong sellStrong buy
Strong sellSellNeutralBuyStrong buy
Moving Averages
Neutral
SellBuy
Strong sellStrong buy
Strong sellSellNeutralBuyStrong buy
Moving Averages
Neutral
SellBuy
Strong sellStrong buy
Strong sellSellNeutralBuyStrong buy
Displays a symbol's price movements over previous years to identify recurring trends.