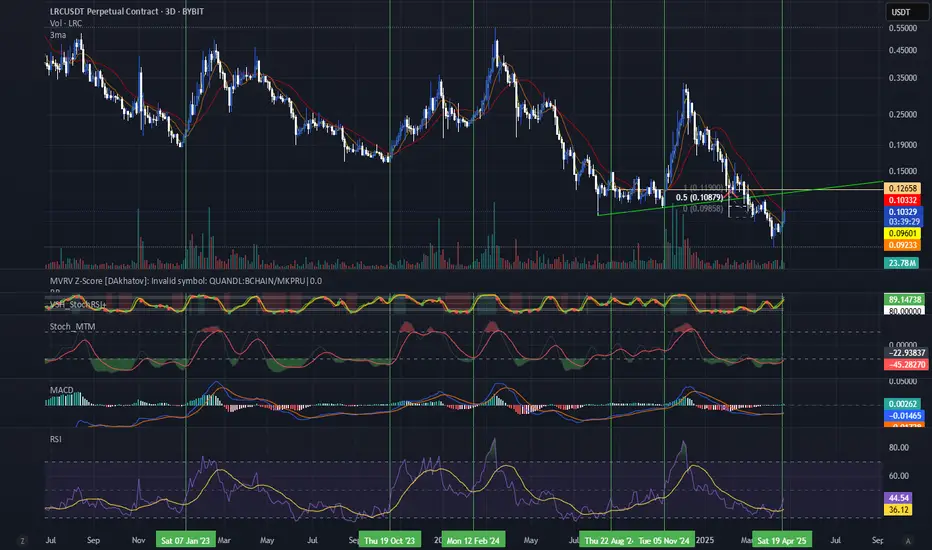
600% RUN in 3,2,1Is LRC about to RIP a massive Bull run any second?! It sure looks like it and I won't be missing it - neither should you. Longby BoswellTrader3
LRC to print 3 cents to $3 in 100x move? - February 2026It’s Christmas out there and everyone is asking scrooge for a handout. Don’t you see it? Sellers want out at any cost, bills have to be paid. For us, the 5%, that’s a Gift horse. Now whip on your jodhpur's and ride this 100x idea before the FOMO gang shows up. Another opportunity like this will not appear for 6-8 years. On the above 6 day chart price action has plummeted a whopping 99% as holders finally decide to make the losses real. Is now the time to join them? Let me give you a few reasonsLby without_worriesUpdated 1219
LRC Buy/Long Signal (4H)We have a liquidity pool on the chart that, if swept, could allow the price to rebound strongly upwards. There are two lows, with buyer stop-losses placed just below them. We have two entry points, which can be entered using a DCA (Dollar-Cost Averaging) approach. Targets are marked on the chart. If you would like us to analyze a coin or altcoin for you, first like this post, then comment the name of your altcoin below. LLongby iMoneyTeamUpdated 63
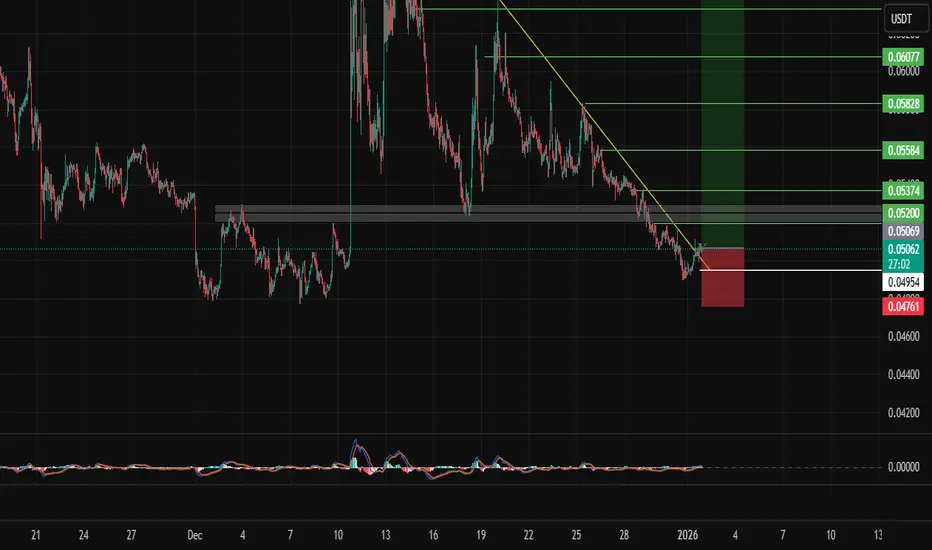
RLCUSDT LONG SIGNAL📢 Trade Setup – LRC/USDT 📈 Position: LONG 💰 Entry Zone: 0.04957 – 0.05050 (Reclaim & retest of broken descending trendline) 🛑 Stop-Loss: 0.04750 (Invalidation below recent higher low) 🎯 Take-Profit Targets: • TP1: 0.05184 • TP2: 0.05361 • TP3: 0.05584 TP4, 05828 📊 Timeframe: 1H ⚖️ Risk/Reward: Favorable ⚙️ Leverage: Spot or low leverage (max 3×)5 🧠 Technical Context: Price has broken above the descending trendline after a prolonged downtrend. A higher low is formed, indicating short-term bullishLLongby mastercrypto20201
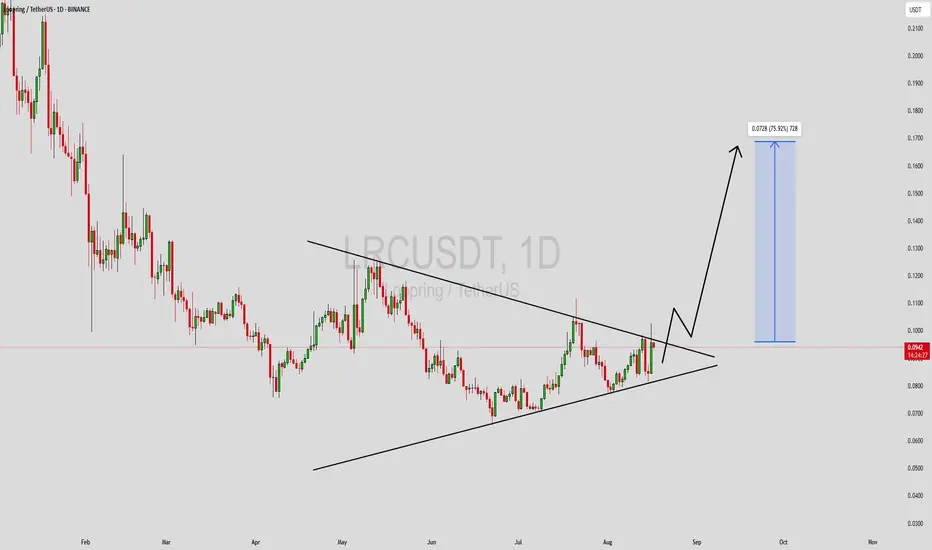
LRCUSDT Forming Falling WedgeLRCUSDT is forming a clear falling wedge pattern, a classic bullish reversal signal that often indicates an upcoming breakout. The price has been consolidating within a narrowing range, suggesting that selling pressure is weakening while buyers are beginning to regain control. With consistent volume confirming accumulation at lower levels, the setup hints at a potential bullish breakout soon. The projected move could lead to an impressive gain of around 90% to 100% once the price breaks above thLLongby Alpha-GoldFX419
LRC/USDT – Horizontal channel. Continuing to work.Loopring - is an open protocol designed for building decentralized crypto exchanges. CoinMarketCap : #262 Since the publication of my trading idea, the price has reached the resistance zone of the inner channel at $0.3338 (+158%). From there, it retraced back to the support of the outer channel, following the overall market movement. I've marked potential liquidity grabs (wicks) as well as future target zones in case of a trend reversal on the chart. Remember, if you're feeling scared right LLongby KECapitalUpdated 5
Keep Your Eyes on LRC (Short with tight stop or Long at BO)Attention traders! It's time to buckle up, because LRC is facing some serious rejection at a major resistance level on the 4-hour timeframe. But don't be intimidated by this wall of resistance, because we're not backing down. We're going to wait for the breakout before opening any long positions, or you can even consider shorting with a tight stop loss above this resistance. Remember, guys, risk management is key to success in the markets, so keep your cool and stay focused. Get ready for some wLby FortuneAIUpdated 2
LRCUSDT The multi-year resistance broke!!!$Loopring managed to break its multi-year resistance a few hours ago and we are expecting a growth of several hundred percent, just keep an eye on it. LLongby Me11326
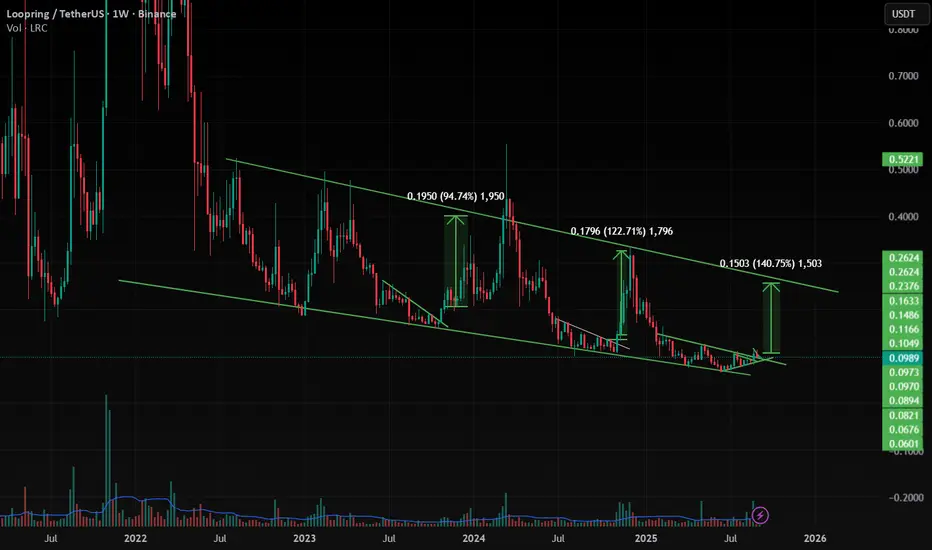
LRC/USDTLRC is moving inside the channel pattern in weekly , Now it is at support zone from where it can give amazing move (140% nearly) if the altcoins gain volume in market-cap . and at the same time Bitcoin dominance is decreasing and altcoins dominance is started increasing , so look on all the altcoins and follow proper risk management , it has very good chances to move UP side but first we have to protect the down side , where risk management comes into game .LLongby mahesh56a4
#LRC Ready for a Massive Recovery From Here | Must Watch Yello, Paradisers! Is #LRCUSDT finally ready for a breakout, or is it just another trap for early bulls? Let's break down the current structure of #LRC. 💎#Loopring ( CAPITALCOM:LRC ) has been moving within a descending wedge pattern for weeks, with price consistently making lower highs and lower lows—clearly respecting both descending resistance and support levels. However, we are now starting to see signs of change as it retests the upper trendline. 💎A breakout above the descending resistanceLLongby MyCryptoParadiseUpdated 920
3 RR less likely fillIf this fills it should be a good option! Target can be adjusted. entry as well. If there's a major bounce before fill cancel the trade.Lby Ian_Carsen0
LRCUSDT Forming Bullish PennantLRCUSDT is forming a bullish pennant pattern, which is one of the most reliable continuation setups in technical analysis. After a strong upward move, the price has entered into a consolidation phase, creating a pennant structure that often signals the possibility of another breakout to the upside. The consolidation indicates that buyers are holding their positions while sellers are unable to push the price significantly lower, showing strength in the trend. The trading volume behind LRCUSDT reLLongby Alpha-GoldFX13
LRCUSDT Forming Bullish PennantLRCUSDT is forming a bullish pennant pattern, which is one of the most reliable continuation setups in technical analysis. After a strong upward move, the price has entered into a consolidation phase, creating a pennant structure that often signals the possibility of another breakout to the upside. The consolidation indicates that buyers are holding their positions while sellers are unable to push the price significantly lower, showing strength in the trend. The trading volume behind LRCUSDT reLLongby Alpha-GoldFX14
LRCUSDT Forming Symmetrical TriangleLRCUSDT is currently trading within a well-defined symmetrical triangle pattern, indicating a phase of consolidation after a prolonged downtrend. This type of chart formation is often seen as a neutral setup that can break in either direction—but when combined with rising volume and improving market sentiment, the likelihood of a bullish breakout increases. Based on technical analysis, a breakout above the upper trendline resistance could trigger a strong rally, projecting a potential gain of 60LLongby Alpha-GoldFX10
Loopring Bullish Through 2026 · Bull Market DurationSome people are saying that the altcoins bull market will be over in two months. To me this sounds a little early, too soon I should say. The market is one but we have thousands and thousands of projects. Some will definitely grow for months, or years, others go down and hit new lows. It is always mixed and it will continue to be mixed because right now everything is already mixed. Bitcoin was hitting new all-time highs as everything was trading at bottom prices. Several altcoins now hit a nLLongby MasterAnanda216
LRC/USDT 1W – Final Test Before a Major Reversal?> Loopring (LRC) is currently sitting at a critical long-term support zone, and the next few weeks could determine whether a strong reversal or deeper decline will follow. --- 🧠 Macro Overview: After falling more than 97% from its all-time high (ATH) of $3.0596, LRC is now revisiting a historical demand zone between $0.0657–$0.0821. This area has acted as a powerful launchpad during previous cycles and remains a major accumulation zone. --- 🔎 Technical Structure & Price Action: ✅ HistoricaLLongby CryptoNuclear4
LRC – Breakout Watch in Motion📆 On the 2H timeframe, CAPITALCOM:LRC is attempting a breakout from the falling wedge structure — a bullish pattern gaining momentum ⚠️ A clean breakout and hold above resistance could open doors to a swift upside move 📈 👀 Keep this setup on your radar — structure is heating up! Not financial advice.Lby coin_mastermind10
LRCUSDT 1D#LRC has broken above the falling wedge resistance and is now facing the daily SMA100. For the bullish move to continue, it needs to break above the SMA100 as well. The best entry point would be on a successful retest of the pattern. Targets: 🎯 $0.1010 🎯 $0.1228 🎯 $0.1405 🎯 $0.1581 🎯 $0.1832 ⚠️ Always use a tight stop-loss and apply proper risk management.Lby DigitalChartist2
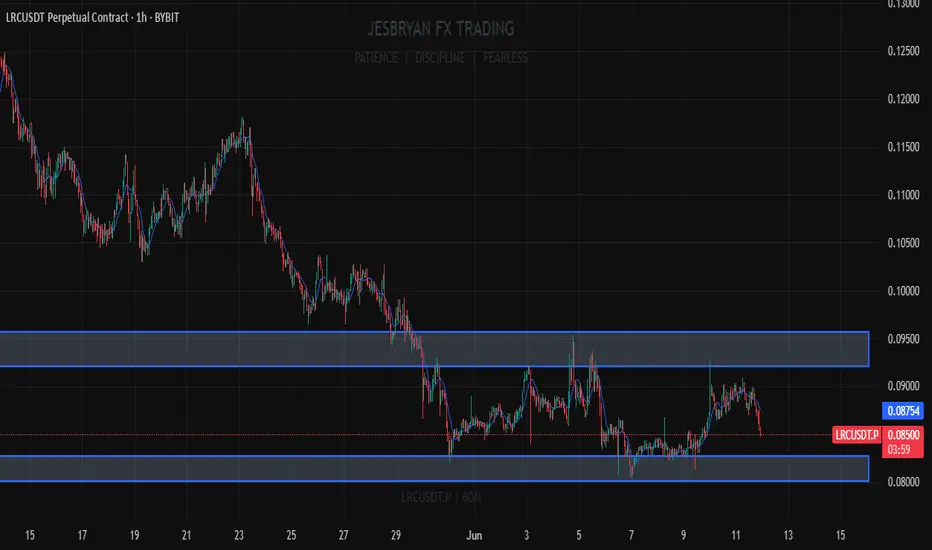
LRC analysisPrice is currently trading within a tight range and is approaching the resistance area. We'll see if the price can break above this resistance area. New positions will be opened after a breakout and retest. Resistance Area: $0.0920-$0.0956Longby Jesbryan2
LRC - Sine Line Says: Bullish!Hello TradingView Family / Fellow Traders! This is Richard, also known as theSignalyst. The picture says it all! 📈For the bulls to take over and ignite the next bullish wave in line with the Sine Line cycles, a break above the $0.12 structure marked in blue is needed. 📚 Reminder: Always stick to your trading plan — entry, risk management, and trade management are key. Good luck, and happy trading! All Strategies Are Good, If Managed Properly! ~RichLLongby TheSignalyst620
LRC long loopringIm just seeing opportunities to go long on good value tokens. None of this is financial advice, im just pointing out that if you are patient and know what you are looking for then the right times to trade are easy to spot. my long strat has triggeredLongby DiscosCryptos0
LRCUSDT | Weak Support, Strong Resistance — Proceed with CautionLRCUSDT is trading between clearly defined zones, where the red box acts as a significant resistance and the green box serves as a mild support level. However, the critical detail here is that the support does not appear very reliable — and that should make you extra cautious if you're planning to long from there. 🔴 Resistance: Respect the Sellers The red box is a zone where sellers have previously stepped in and where supply could easily overwhelm demand again. If price approaches this region LShortby UmutTrades9
LRCUSDT 1WLRC ~ 1W Analysis #LRC This is the lowest support at this time, maybe you can consider starting to buy back from here with a short -term target of at least 15%+LLongby CryptoNuclear1
 Long