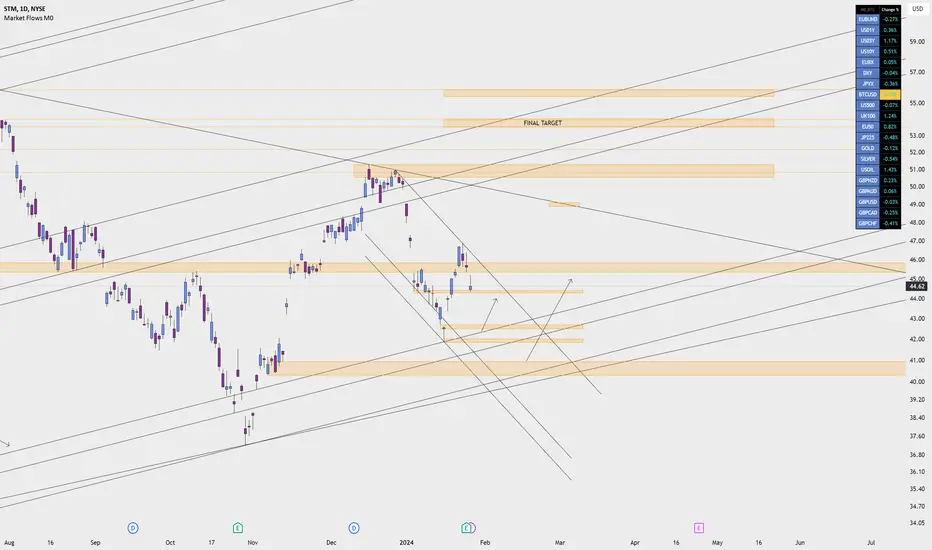
STMicroelectronics NV Sponsored ADR RegS
No trades
No trades
0.5 USD
166.51 M USD
11.84 B USD
892.55 M
Next report date
—
Report period
—
EPS estimate
—
Revenue estimate
—
Details
Sector
Industry
CEO
Jean-Marc Chéry
Website
Headquarters
Plan-Les-Ouates
Founded
1987
IPO date
Jul 18, 2000
ISIN
US8610121027
CUSIP
861012102
FIGI
BBG00JVJT046
Identifiers
ISIN US8610121027
STMicroelectronics NV is a global semiconductor company, which engages in the business of designing, developing, manufacturing, and marketing products used in a wide variety of applications for automotive, industrial, personal electronics and communications equipment, computers, and peripherals. It operates through the following segments: Automotive and Discrete Group (ADG), Analog, MEMS, and Sensors Group (AMS), Microcontrollers and Digital ICs Group (MDG), and Others. The ADG segment includes dedicated automotive integrated circuits and discrete and power transistor products. The AMS segment offers analog, smart power, MEMS sensors and actuators, and optical sensing solutions. The MDG segment focuses on general-purpose microcontrollers and microprocessors, connected security products, memories, and RF and communications products. The Others segment is involved in sales assembly services and other revenues. The company was founded in June 1987 and is headquartered in Plan-Les-Ouates, Switzerland.
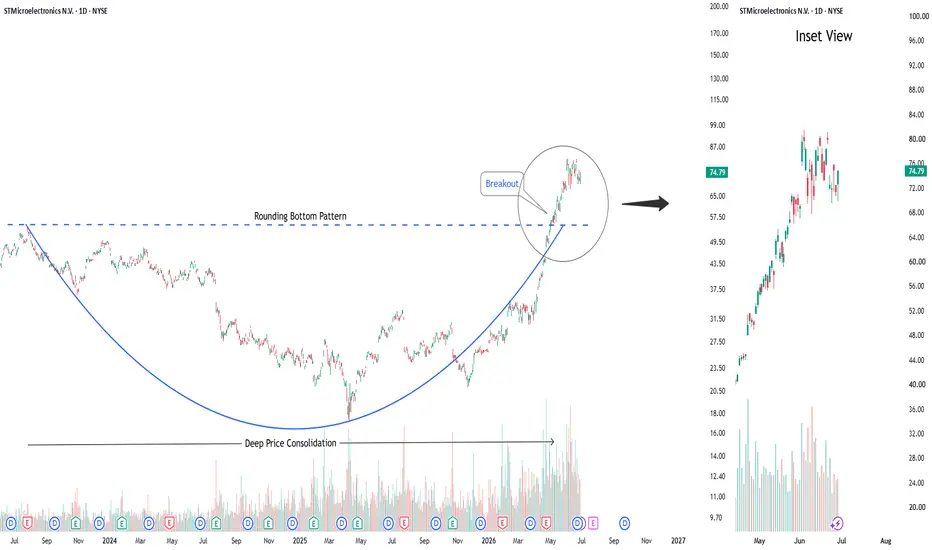
STM Long — STM reclaimed the 74.5-75 pullback shelf; long vs 73.HTF trend is still up and STM has pulled back sharply into a prior breakout/support area, then reclaimed the 74.5-75 shelf with a gap-up 1h trigger. The setup is actionable on a retest/hold of 75.05; losing 73.95 would put price back below the reclaimed shelf and invalidate the bounce. First target
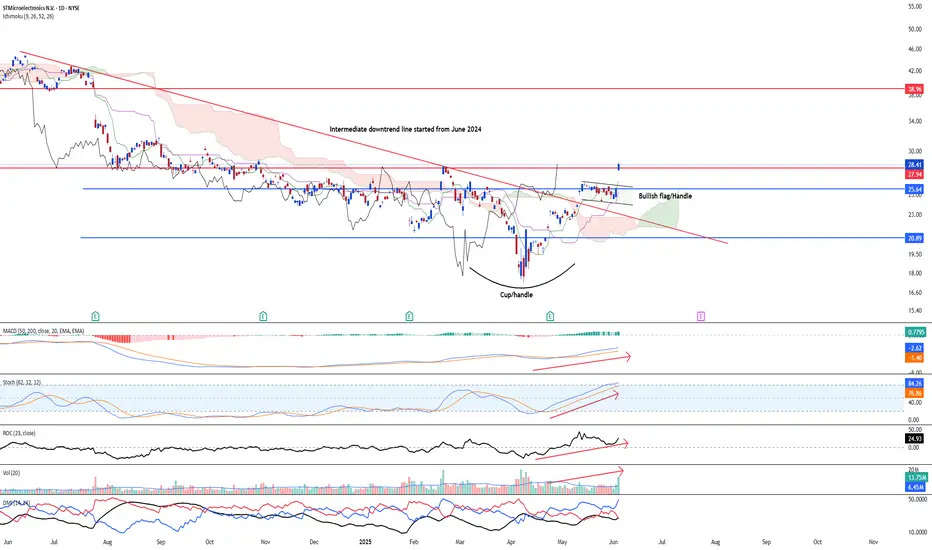
STM is looking at a strong bullish rebound to the upsideNYSE:STM has rebounded strongly and recent cup and handle formation has complete its 1st stage of confirmation, left only the breaking of its key resistance at 27.41.
The stock has also broken above the intermediate downtrend line which started since June 2024.
Bullish momentum from long to sho
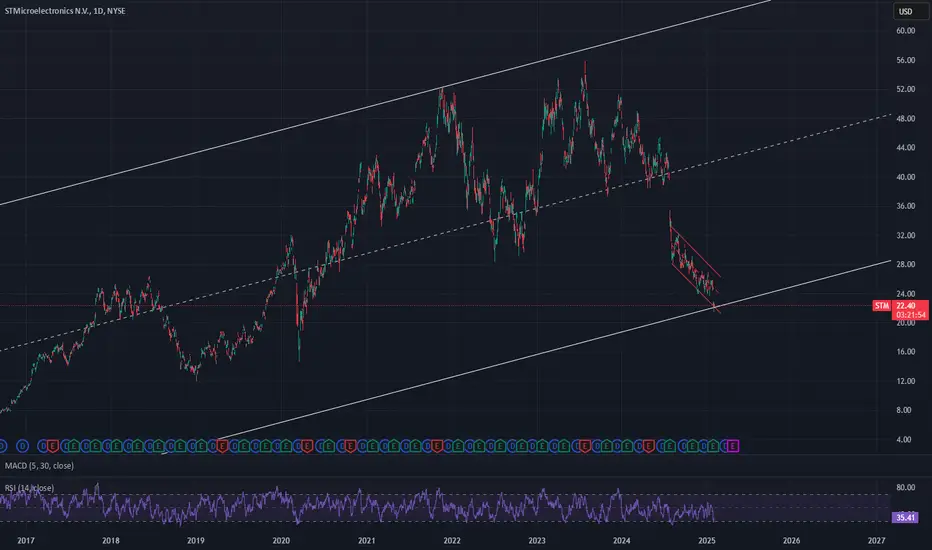
STM - could this be the bottom ?I have been watching STM for a while and looking for a possible bottom.
The best I could come up with is the channel shown above.
Weekly MACD and RSI could support this:
The current outlook for STM in 2025 isn't great, but they are one of the key players in the semiconductor sector and wil
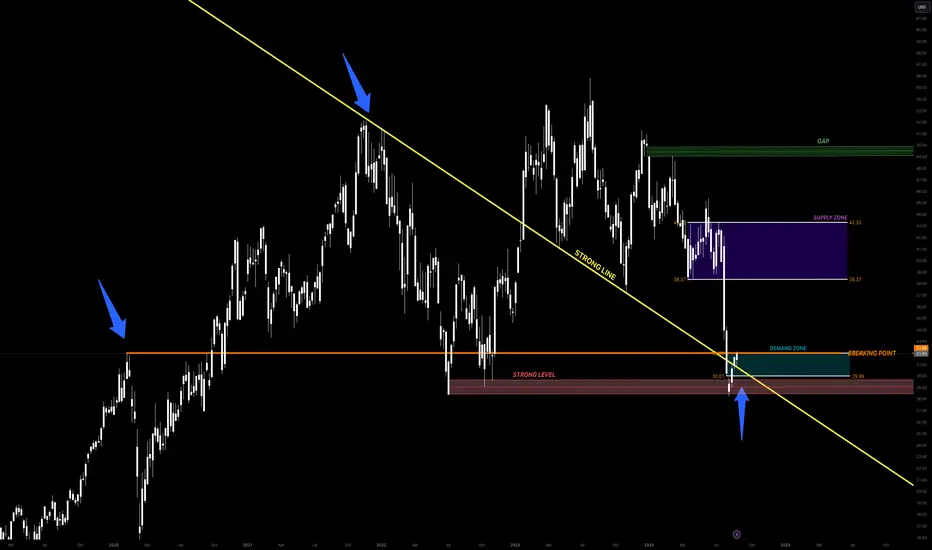
STM its time to buy ?? 📉 Downtrend Line: The downtrend line (marked in yellow) that started from the highest peaks serves as strong resistance. The stock has failed to break above this line several times, reinforcing it as a critical resistance level for the future.
🟠 Strong Support Level: The stock found stable support
STM is UndervaluedSTM is at an important support level and near the bottom of the uptrend channel I have drawn.
It is priced quite low according to both financial statements and many analysts. As a result, STM offers a good entry point for a long term investment.
Currently, the average buying zone is in the $30-3
See all ideas
Summarizing what the indicators are suggesting.
Neutral
SellBuy
Strong sellStrong buy
Strong sellSellNeutralBuyStrong buy
Neutral
SellBuy
Strong sellStrong buy
Strong sellSellNeutralBuyStrong buy
Neutral
SellBuy
Strong sellStrong buy
Strong sellSellNeutralBuyStrong buy
An aggregate view of professional's ratings.
Neutral
SellBuy
Strong sellStrong buy
Strong sellSellNeutralBuyStrong buy
Neutral
SellBuy
Strong sellStrong buy
Strong sellSellNeutralBuyStrong buy
Neutral
SellBuy
Strong sellStrong buy
Strong sellSellNeutralBuyStrong buy
Displays a symbol's price movements over previous years to identify recurring trends.
— YTM
Maturity dateJun 23, 2031
Coupon0% (Zero)
— YTM
Maturity dateJun 23, 2033
Coupon0.63% (Fixed)
See all 0L9Y bonds
Weight1.02%
Market value710.00 M
Weight0.66%
Market value298.51 M
Weight0.40%
Market value96.57 M
Weight0.57%
Market value50.07 M
Weight0.92%
Market value49.04 M
Weight3.00%
Market value33.52 M
Weight0.16%
Market value32.83 M
Weight0.32%
Market value24.99 M
Weight1.60%
Market value23.92 M
Weight0.16%
Market value23.01 M
Weight0.09%
Market value15.27 M
Explore more ETFs