DRM3 — 1H | REVERSAL BREAKOUT SETUPDRM3 is starting to look interesting after an absolutely savage reset from the June highs.
The ETP ran as high as **$24.10** before sellers took complete control. Since then, the tape has been a textbook sequence of **lower highs + lower lows**, with every relief rally getting sold and price eventu
Compare with IncomeShares S&P500 Options ETP
Key stats
Fund info
Home page
Inception date
Aug 28, 2024
Structure
Debt Security
Replication method
Physical
Dividend treatment
Distributes
Primary advisor
Leverage Shares Management Co. Ltd.
ISIN
XS2875106242
FIGI
BBG01PBV4SB4
Identifiers
ISIN XS2875106242
The return on the ETP Securities is linked to the performance of the LS S&P500 Options-Based Income Strategy.
Classification
#3NVD Leveraged 3x Long with Nvidia Corporation StocksAll the World chipmakers are on the rush this night, due to Nvidia ( NASDAQ:NVDA ) Q1'23 Earnings Report.
LSE:3NVD is the Leverage Shares 3x Nvidia ETP Securities that seeks to track the iSTOXX Leveraged 3x Nvidia Index, which is designed to provide 3x the daily return of Nvidia stock, adjus
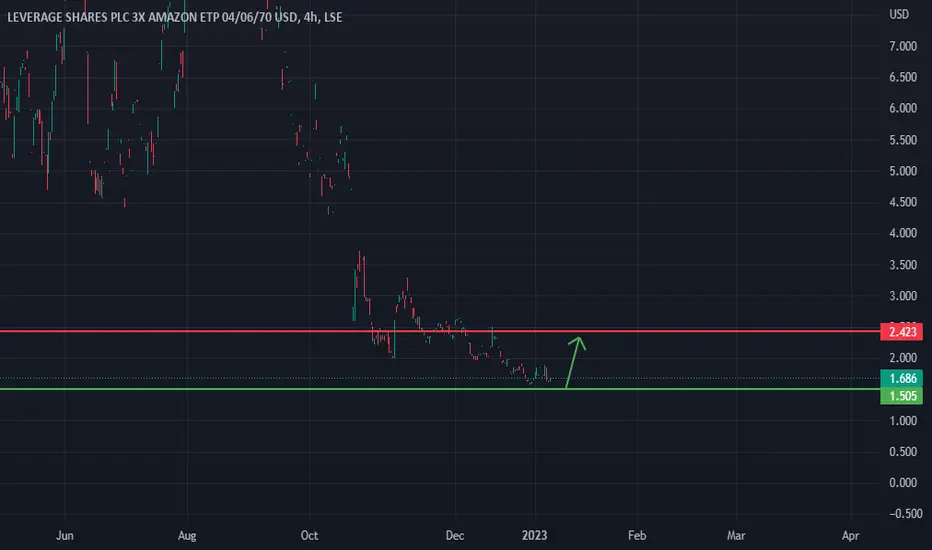
Amazon 3x Shares, Long OpportunityHi Traders, I hope you're all killing it in the markets, I'm looking at a potential long opportunity here on AMZ3. I am looking to capitalise on a what I believe to be a probable support area at the 1.5 significant number. This not purely a TA based trade, I have looked at Amazon from a fundamental
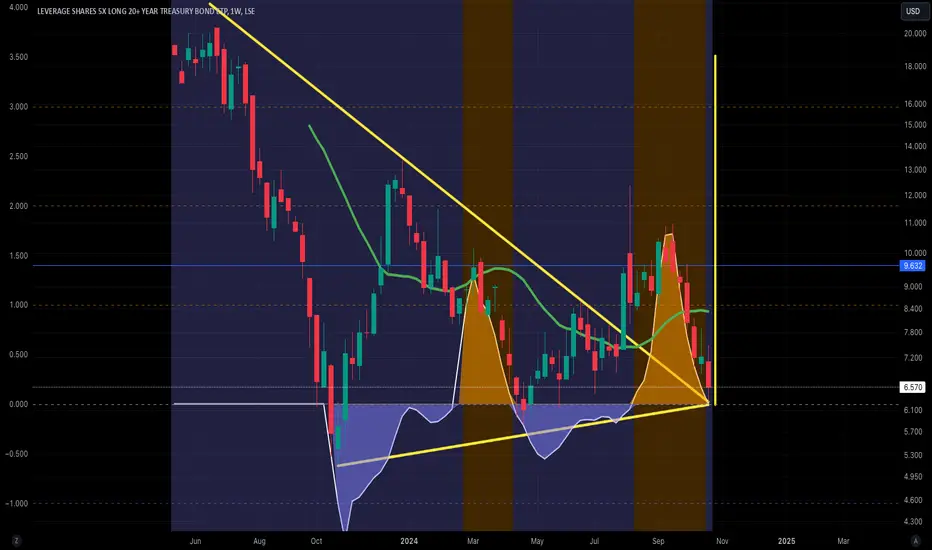
-3x Short ARKK ETP -> Santa Claus RallyGet on the sled of Santa Claus for your end of year rally. Take a look at Cathie Wood her picks in the ARKK ETF one more time and decide for yourself.
SARK has made some gains the past weeks, but now it's time to leverage this baby.
Buy in: 6.4 - 6.7
Target: 10.00
Stop-loss: 5.5
Not financial
I wish this fund would be made available on a US exchange.AAP3 is an absolutely wonderful investment opportunity. I just can't get in on it because I live in the US. Hopefully, this fund will be expanded to the US market. Those who live in the UK have a marvelous chance to make some very serious gains.
See all ideas
Summarizing what the indicators are suggesting.
Oscillators
Neutral
Oscillators
Neutral
Summary
Neutral
Summary
Neutral
Summary
Neutral
Moving Averages
Neutral
Moving Averages
Neutral
Displays a symbol's price movements over previous years to identify recurring trends.
Frequently asked questions
An exchange-traded fund (ETF) is a collection of assets (stocks, bonds, commodities, etc.) that track an underlying index and can be bought on an exchange like individual stocks.
SPYY trades at 4.417 USD today, its price has risen 1.02% in the past 24 hours. Track more dynamics on SPYY price chart.
SPYY net asset value is 4.39 today — it's risen 0.21% over the past month. NAV represents the total value of the fund's assets less liabilities and serves as a gauge of the fund's performance.
SPYY assets under management is 9.23 M USD. AUM is an important metric as it reflects the fund's size and can serve as a gauge of how successful the fund is in attracting investors, which, in its turn, can influence decision-making.
SPYY price has fallen by −2.07% over the last month, and its yearly performance shows a −23.02% decrease. See more dynamics on SPYY price chart.
NAV returns, another gauge of an ETF dynamics, showed a 1.61% increase in three-month performance and has increased by 13.14% in a year.
SPYY fund flows account for 3.69 M USD (1 year). Many traders use this metric to get insight into investors' sentiment and evaluate whether it's time to buy or sell the fund.
Since ETFs work like an individual stock, they can be bought and sold on exchanges (e.g. NASDAQ, NYSE, EURONEXT). As it happens with stocks, you need to select a brokerage to access trading. Explore our list of available brokers to find the one to help execute your strategies. Don't forget to do your research before getting to trading. Explore ETFs metrics in our ETF screener to find a reliable opportunity.
SPYY invests in cash. See more details in our Profile section.
SPYY expense ratio is 0.73%. It's an important metric for helping traders understand the fund's operating costs relative to assets and how expensive it would be to hold the fund.
No, SPYY isn't leveraged, meaning it doesn't use borrowings or financial derivatives to magnify the performance of the underlying assets or index it follows.
In some ways, ETFs are safe investments, but in a broader sense, they're not safer than any other asset, so it's crucial to analyze a fund before investing. But if your research gives a vague answer, you can always refer to technical analysis.
Today, SPYY technical analysis shows the sell rating and its 1-week rating is sell. Since market conditions are prone to changes, it's worth looking a bit further into the future — according to the 1-month rating SPYY shows the sell signal. See more of SPYY technicals for a more comprehensive analysis.
Yes, SPYY pays dividends to its holders with the dividend yield of 0.00%.
SPYY trades at a premium (0.39%).
Premium/discount to NAV expresses the difference between the ETF’s price and its NAV value. A positive percentage indicates a premium, meaning the ETF trades at a higher price than the calculated NAV. Conversely, a negative percentage indicates a discount, suggesting the ETF trades at a lower price than NAV.
SPYY shares are issued by Leverage Shares LLC
SPYY follows the No Underlying Index. ETFs usually track some benchmark seeking to replicate its performance and guide asset selection and objectives.
The fund started trading on Aug 28, 2024.
The fund's management style is active, aiming to outperform its benchmark index by actively selecting and adjusting assets. The goal is to achieve returns that exceed those of the index the fund tracks.