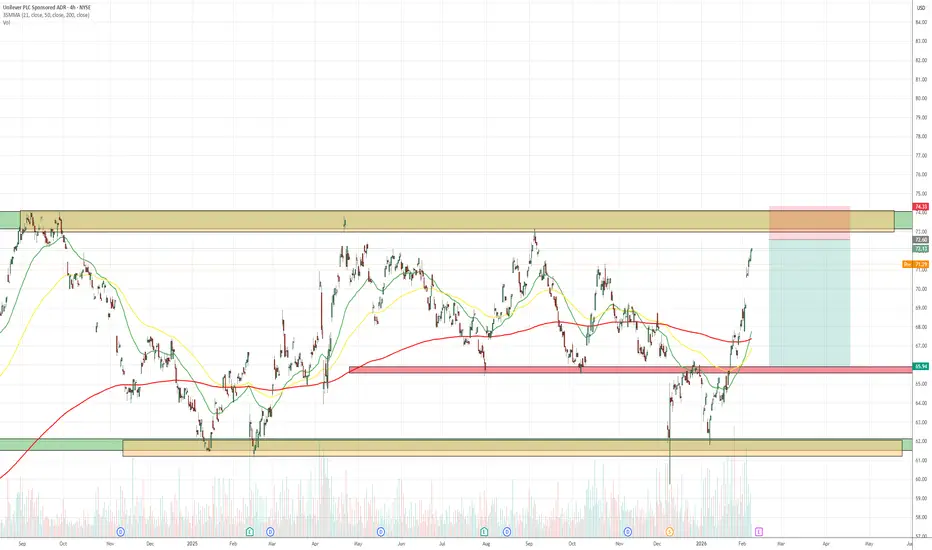
UNILEVER Critical Crossroads and/or Nice Longterm Entrypoint! Unilever is currently trading at a highly significant technical level . Looking at the long-term historical price structure, the stock has pulled back into an area that has repeatedly acted as major support over the years. At the same time, price action continues to respect the ascending support t
Unilever PLC
No trades
No trades
Compare with Unilever PLC
Key facts today
2.5 GBP
5.22 B GBP
43.25 B GBP
2.09 B
Next report date
—
Report period
—
EPS estimate
—
Revenue estimate
—
Profile
Sector
Industry
CEO
Fernando Fernandez
Website
Headquarters
London
Founded
1930
ISIN
GB00BVZK7T90
FIGI
BBG000C0M8X7
Identifiers
ISIN GB00BVZK7T90
Unilever Plc engages in the manufacture and sale of consumer goods. It operates through the following segments: Beauty & Wellbeing, Personal Care, Home Care, Nutrition, and Ice Cream. The Beauty & Wellbeing segment offers hair care, skin care, and prestige beauty and health & wellbeing. The Personal Care segment consists of sales of skin cleansing, deodorant, and oral care products. The Home Care segment comprises of sales of fabric care and a wide range of cleaning products. The Nutrition segment refers to sales of scratch cooking aids, dressings, and tea products. The Ice Cream segment covers primarily ice cream products. The company was founded by Antonius Johannes Jurgens, Samuel van den Bergh, and William Hulme Lever in 1930 and is headquartered in London, the United Kingdom.
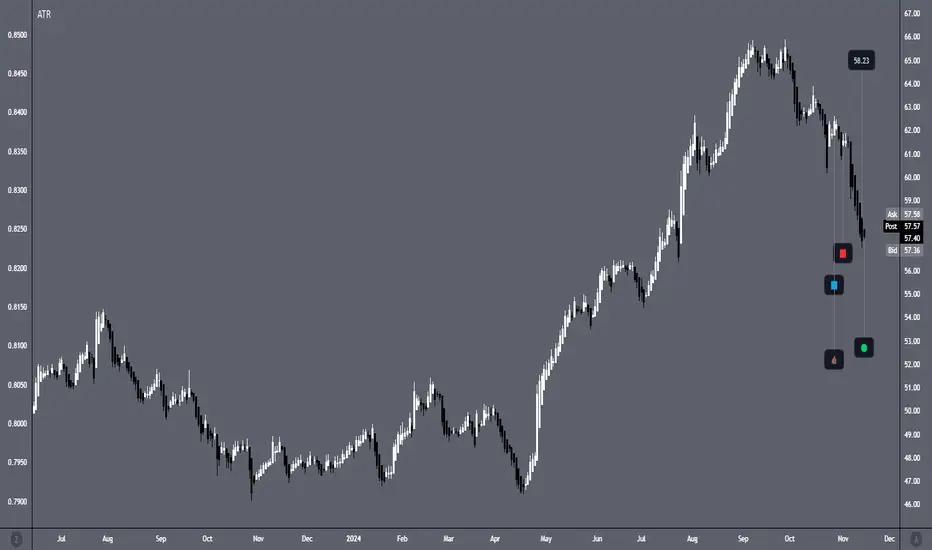
5/8/25 - UL: new SELL mechanical trading signal.5/8/25 - UL: new SELL signal chosen by a rules based, mechanical trading system.
UL - SELL SHORT
Stop Loss @ 65.43
Entry SELL SHORT @ 62.58
Target Profit @ 56.37
Analysis:
Higher timeframe: Prices have stayed below the upper channel line of the ATR (Average True Range) Keltner Channel and revers
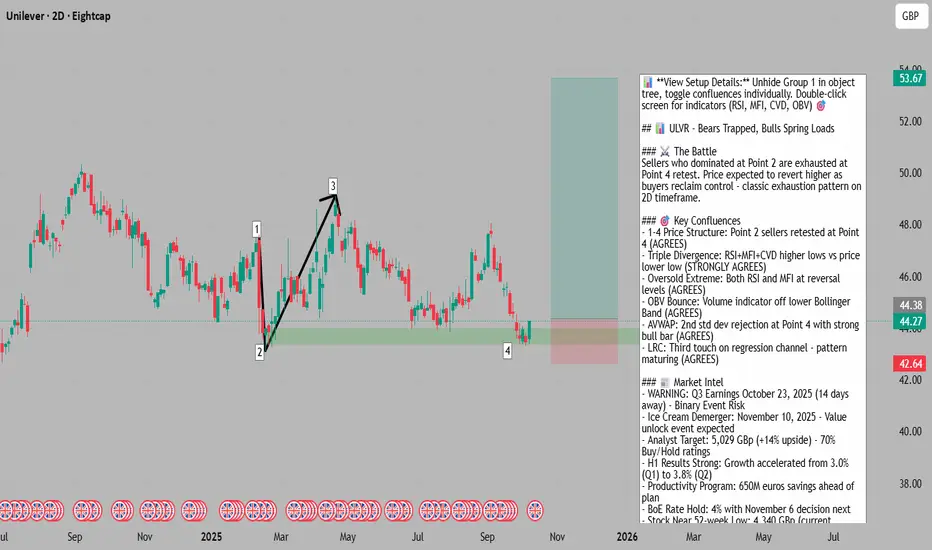
Bears Exhausted at Support - Bulls Load Spring📊 **To view my confluences and linework:**
Step 1️⃣: Grab the chart
Step 2️⃣: Unhide Group 1 in the object tree
Step 3️⃣: Hide and unhide specific confluences one by one
💡 **Pro tip:** Double-click the screen to reveal RSI, MFI, CVD, and OBV indicators alongside divergence markings! 🎯
Title: 🎯 UL
Bears Exhausted at Support - Bulls Load Spring📊 **To view my confluences and linework:**
Step 1️⃣: Grab the chart
Step 2️⃣: Unhide Group 1 in the object tree
Step 3️⃣: Hide and unhide specific confluences one by one
💡 **Pro tip:** Double-click the screen to reveal RSI, MFI, CVD, and OBV indicators alongside divergence markings! 🎯
Title: 🎯 UL
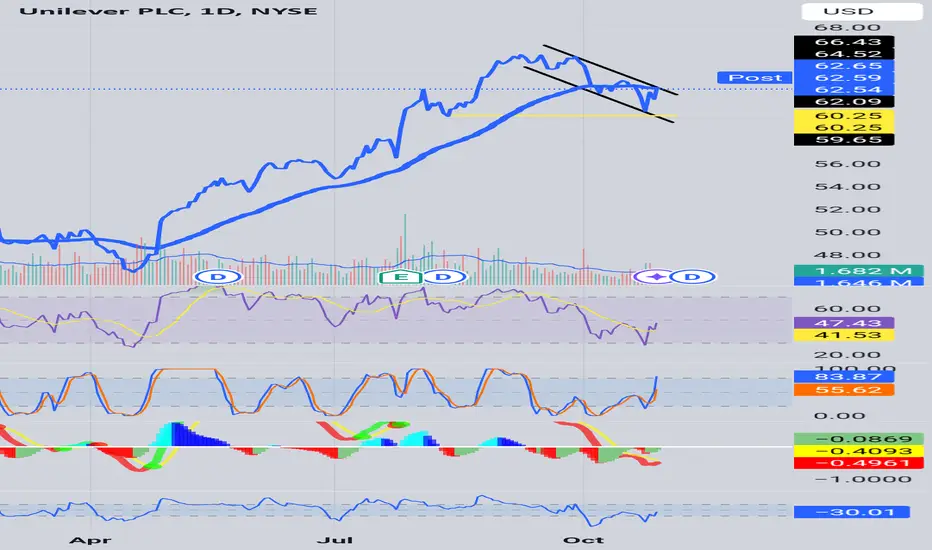
Unilever will continue to perform exceptionally wellUnilever has been growing steadily and healthily for years, offering increasing dividend yields.
Companies like NYSE:UL are always i deal to have in your portfolio. Right now, after hitting all-time highs, it has pulled back to its support level, offering a chance to buy the stock at a good dis
Unilever: The most BORING stock in the UK, now INTERESTING?This analysis is provided by Eden Bradfeld at BlackBull Research.
Unilever is one of those stocks I’m aware of but have never had much interest in — it’s a large conglomerate that makes very boring things, like Dove soap (they also make Ben and Jerry’s ice cream). However, the great thing with b
See all ideas
Summarizing what the indicators are suggesting.
Neutral
SellBuy
Strong sellStrong buy
Strong sellSellNeutralBuyStrong buy
Neutral
SellBuy
Strong sellStrong buy
Strong sellSellNeutralBuyStrong buy
Neutral
SellBuy
Strong sellStrong buy
Strong sellSellNeutralBuyStrong buy
An aggregate view of professional's ratings.
Neutral
SellBuy
Strong sellStrong buy
Strong sellSellNeutralBuyStrong buy
Neutral
SellBuy
Strong sellStrong buy
Strong sellSellNeutralBuyStrong buy
Neutral
SellBuy
Strong sellStrong buy
Strong sellSellNeutralBuyStrong buy
Displays a symbol's price movements over previous years to identify recurring trends.
6.061% YTM
Maturity dateOct 15, 2097
Coupon5.60% (Fixed)
5.556% YTM
Maturity dateAug 12, 2051
Coupon2.63% (Fixed)
4.943% YTM
Maturity dateAug 12, 2034
Coupon4.63% (Fixed)
4.882% YTM
Maturity dateDec 8, 2033
Coupon5.00% (Fixed)
4.790% YTM
Maturity dateNov 15, 2032
Coupon5.90% (Fixed)
4.720% YTM
Maturity dateAug 12, 2031
Coupon1.75% (Fixed)
4.601% YTM
Maturity dateSep 14, 2030
Coupon1.38% (Fixed)
4.592% YTM
Maturity dateSep 15, 2029
Coupon1.88% (Fixed)
4.514% YTM
Maturity dateFeb 28, 2028
Coupon2.13% (Fixed)
4.455% YTM
Maturity dateSep 6, 2029
Coupon2.13% (Fixed)
4.403% YTM
Maturity dateMar 22, 2028
Coupon3.50% (Fixed)
See all ULVR bonds
Weight0.28%
Market value1.86 B
Weight0.39%
Market value1.24 B
Weight0.54%
Market value997.86 M
Weight3.90%
Market value843.79 M
Weight3.90%
Market value843.79 M
Weight3.90%
Market value843.79 M
Weight0.63%
Market value478.64 M
Weight1.25%
Market value342.66 M
Weight3.56%
Market value324.12 M
Weight3.56%
Market value324.12 M
Weight0.79%
Market value304.49 M
Explore more ETFs
Frequently asked questions
The current price of ULVR is 4,553.0 GBX — it has decreased by −0.73% in the past 24 hours. Watch Unilever PLC stock price performance more closely on the chart.
Depending on the exchange, the stock ticker may vary. For instance, on LSE exchange Unilever PLC stocks are traded under the ticker ULVR.
ULVR stock has risen by 0.74% compared to the previous week, the month change is a 12.07% rise, over the last year Unilever PLC has showed a −8.75% decrease.
We've gathered analysts' opinions on Unilever PLC future price: according to them, ULVR price has a max estimate of 5,900.15 GBX and a min estimate of 3,784.34 GBX. Watch ULVR chart and read a more detailed Unilever PLC stock forecast: see what analysts think of Unilever PLC and suggest that you do with its stocks.
ULVR reached its all-time high on Sep 4, 2019 with the price of 5,999.5 GBX, and its all-time low was 732.5 GBX and was reached on Apr 11, 1996. View more price dynamics on ULVR chart.
See other stocks reaching their highest and lowest prices.
ULVR stock is 1.89% volatile and has beta coefficient of 0.50. Track Unilever PLC stock price on the chart and check out the list of the most volatile stocks — is Unilever PLC there?
Today Unilever PLC has the market capitalization of 99.75 B, it has increased by 1.95% over the last week.
Yes, you can track Unilever PLC financials in yearly and quarterly reports right on TradingView.
Unilever PLC is going to release the next earnings report on Jul 28, 2026. Keep track of upcoming events with our Earnings Calendar.
Unilever PLC revenue for the last half-year amounts to 21.79 B GBX, despite the estimated figure of 23.33 B GBX. In the next half-year revenue is expected to reach 21.91 B GBX.
ULVR net income for the last half-year is 2.25 B GBP, while the previous report showed 2.96 B GBP of net income which accounts for 0.00% change. Track more Unilever PLC financial stats to get the full picture.
Yes, ULVR dividends are paid quarterly. The last dividend per share was 0.40 GBP. As of today, Dividend Yield (TTM)% is 3.73%. Tracking Unilever PLC dividends might help you take more informed decisions.
Unilever PLC dividend yield was 3.55% in 2025, and payout ratio reached 72.16%. The year before the numbers were 3.26% and 67.47% correspondingly. See high-dividend stocks and find more opportunities for your portfolio.
As of Jul 21, 2026, the company has 96.09 K employees. See our rating of the largest employees — is Unilever PLC on this list?
EBITDA measures a company's operating performance, its growth signifies an improvement in the efficiency of a company. Unilever PLC EBITDA is 9.66 B GBP, and current EBITDA margin is 22.56%. See more stats in Unilever PLC financial statements.
Like other stocks, ULVR shares are traded on stock exchanges, e.g. Nasdaq, Nyse, Euronext, and the easiest way to buy them is through an online stock broker. To do this, you need to open an account and follow a broker's procedures, then start trading. You can trade Unilever PLC stock right from TradingView charts — choose your broker and connect to your account.
Investing in stocks requires a comprehensive research: you should carefully study all the available data, e.g. company's financials, related news, and its technical analysis. So Unilever PLC technincal analysis shows the sell today, and its 1 week rating is sell. Since market conditions are prone to changes, it's worth looking a bit further into the future — according to the 1 month rating Unilever PLC stock shows the sell signal. See more of Unilever PLC technicals for a more comprehensive analysis.
If you're still not sure, try looking for inspiration in our curated watchlists.