Axis Bank in good levels - potential upside 15%, SL-5%Axis Bank in good levels - potential upside 15%, SL-5%Longby sudtintin1
AXISBANKTechnical Note: Let the market come to your zones and show its hand. Trade safely and manage your risk! Always wait for your own confirmations before entering the market. Risk Disclaimer: This analysis is for educational purposes only and does not constitute financial advice. Always practice proper risk and position sizing. The market is supreme; no one can make a 100% accurate prediction. Stop Loss Must if you want to be a profitable Trader. MARKET VIEW:- Current Bias: BULLISH Preferred Strategy: – Buy on Dip ......Wait for ConfirmationLongby askbiswanath20250
AXIS Option TradeAxis Bank Lot Size 625 July Series Strike : 1300 CE CMP 33.7 SL 25 Expected Tgt 45-55 TSL MUSTLongby NareshG_SEBI_REGISTERED_RA222
$AXISBANK: HVF Squeeze — Pre-Breakout, But wants new highs!⚡ 🏛️ 📈 ⚡ 🏛️ 📈 ⚡ 🏛️ 📈 1. The Setup: High-Compression HVF Look at the 3-hour chart. Axis Bank has spent months executing a high-precision Hunt Volatility Funnel (HVF). @TheCryptoSniper The Compression: After hitting local resistance near 1,418 in March, price action underwent a structural, narrowing consolidation. The Inflection Point: Right now, price is sitting at 1,360.10, wedged perfectly at the absolute apex of the funnel. Volatility is completely choked out, which means a violent momentum expansion is imminent. The Breakout Blueprint: A clean daily/weekly close outside this descending upper rail will activate the structural extension lines into outside expansion space. 2. What is Fuelling the Indian Banking Sector? The perkiness across the banking index is backed by powerful, structural macro dynamics:Net Interest Margin (NIM) Expansion: With the RBI and global central banks maintaining a hawkish "higher-for-longer" rate stance, banks are winning. Floating-rate loans reset higher immediately, while deposit costs lag behind, driving temporary but significant NIM expansion. The LCR Liquidity Boost: The RBI's final guidelines on the Liquidity Coverage Ratio (LCR) turned out to be a massive positive surprise. By reducing the run-off factors on specific wholesale and mobile-enabled deposits, the central bank effectively freed up roughly ₹2.3 to ₹2.5 trillion in liquid assets across the system, immediately boosting banks' ability to fund aggressive credit expansion. Cleanest Balance Sheets in a Generation: Gross Non-Performing Assets (GNPAs) sit at multi-year lows (~2.0-2.2%), meaning banks are entering the second half of the year unburdened by bad asset legacy costs and fully primed for pure credit growth. 3. Private vs. Government (PSU) Banks: The Operational Divergence To trade Indian banking efficiently, you must understand the deep systemic divide between how private players like Axis Bank operate versus State-Owned/PSU giants like SBI or PNB. PRIVATE BANKS (e.g., Axis, HDFC, ICICI) Pure Profit Maximisation: Focused sharply on high-margin retail lending, premiumisation, wealth management, and technology adoption. Must compete aggressively via high-tech retail ecosystems and finer rates to pull in term deposits. Highly automated, data-driven credit profiling. They move fast but can face pockets of sudden stress in aggressive unsecured retail segments. Government/PSU Banks (e.g., SBI, PNB) Socio-Economic Development: Tasked with financial inclusion, massive government direct-benefit transfer schemes, and heavy corporate infrastructure lending. Benefit from an unparalleled, deeply sticky, and incredibly cheap rural/semi-urban CASA (Current & Savings Account) deposit franchise. Historically slower, bureaucratic credit processing, making them structurally exposed to massive chunky corporate CapEx loan write-offs during historical downturns. 4. Target Coordinates & Invalidation Axis Bank is acting as a premier vehicle to ride this private banking breakout: Pattern Invalidation: A structural breakdown below the local consolidation floor at 1,340 delays the bullish trigger. Target 1: 1,394.95 Log Target 2: 1,548.95 Log Target 3:1,679.50 The squeeze is running out of time. Position early, map the structural parameters, and flip it smoothly. #AXISBANK #NiftyBank #PrivateBanks #VolatilitySqueeze #PriceAction #IndianEquities #BankBreakout #TradingView #TechnicalAnalysisby BallaJiUpdated 116
Axis Bank Ltd.Axis Bank looks well placed both fundamentally and technically — the bank has delivered steady operating performance over the last four quarters with improving loan growth, margin stability, and controlled credit costs, which supports a constructive outlook for the coming quarter and year. Technically, momentum indicators and other trend measures are in bullish zones, supporting a tactical buy while keeping risk management strict. Fundamental view — Last 4 quarters & guidance Over the last four quarters Axis Bank has shown sequential improvement in core metrics: healthy loan growth across retail and corporate segments, stable net interest margins, and improving asset quality with lower slippages and higher provisioning coverage; these trends have supported stronger operating profits and helped the bank build a firmer earnings base. For the coming quarter and financial year, the Street will watch loan growth sustainability, margin resilience as funding cost dynamics evolve, CASA traction, and management guidance on credit costs and capital deployment, all of which will determine near-term sentiment. Technical view — RSI, MACD & bullish indicators On the chart, RSI is in a constructive zone, showing strength without extreme overbought signals, and MACD is positive with the signal line supporting upward momentum, which together indicate continuation potential for the current up-move. Other technicals like price above short- and medium-term moving averages, bullish moving-average alignment, rising volume confirmation, and a clean higher-high/higher-low structure add conviction that buyers remain in control as long as key supports hold. Recommendation Buy Axis Bank at 1380 with stoploss 1334.00 for targets 1407.05, 1434.65, 1462.80, 1491.50, and 1520.75. This is a momentum-plus-fundamental trade: enter with defined risk, trail stops as targets are reached, and re-evaluate if price breaches the stoploss or if fundamental guidance disappoints. Disclosure Disclosure: I am not a SEBI registered analyst or technical advisor. This post is for educational and informational purposes only and should not be taken as investment advice.Longby raigvivek0
AXIS BANK | Intraday Analysis | 18 Jun 2026📈 Intraday Market Update Axis Bank has generated a fresh BUY signal after reversing from recent lows and reclaiming the highlighted Entry Zone. The recovery from support suggests improving short-term momentum, with buyers attempting to build a higher-low structure. Price is currently consolidating above support, which keeps the bullish setup active while the risk level remains clearly defined. Key Levels 🟢 Potential T-1: ₹1368.60 🟢 Potential T-2: ₹1380.40 🟢 Potential T-3: ₹1392.20 🔴 Potential Risk Level (SL): ₹1345.00 Price Action Observations ✅ Fresh BUY signal generated. ✅ Strong rebound from recent swing lows. ✅ Entry Zone successfully reclaimed. ✅ Higher-low formation developing. ✅ Buyers maintaining control above support. Intraday Trading View • Holding above the Entry Zone keeps the bullish bias intact. • A sustained move above recent highs may increase the probability of reaching T-1. • Continued buying momentum could extend toward T-2 and T-3 over the coming sessions. • A breakdown below the defined risk level would invalidate the current bullish structure. Market Structure The recent recovery indicates a shift from bearish pressure toward short-term bullish momentum. As long as price remains above the Entry Zone, buyers retain an advantage. Risk Management Every trade setup carries risk. Use proper position sizing and predefined stop-loss levels to manage capital effectively. ⚠️ This analysis is based on current market structure and price action. It is an educational market view and not a prediction of future results. #AxisBank #BankingStocks #IntradayTrading #PriceAction #TechnicalAnalysis #NSE #MarketStructure #RiskManagement #TradingViewIndia #BKQuantDeskLongby BK_QuantDesk1
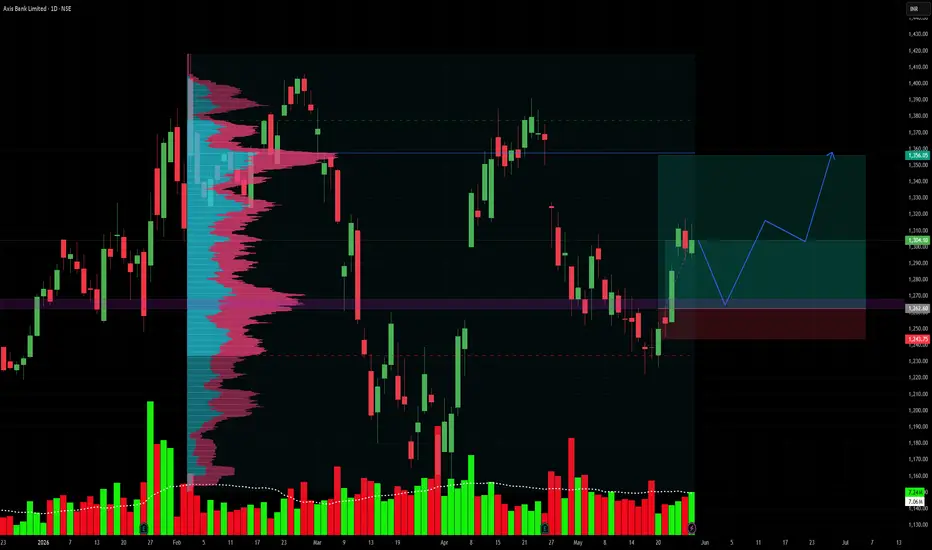
My View on AXISBANK — Daily ChartAXISBANK is currently trading around ₹1304. After the strong move from the lower zone, price is now near a short-term resistance/supply area. A healthy pullback toward the ₹1262–₹1270 zone can be treated as a retest area. The May 22 candle created a Fair Value Gap / imbalance zone, and price may come back to fill or retest that area before attempting the next move upward. If buyers defend this zone with a bullish rejection candle, the upside structure can remain valid. Key Levels Level View ₹1262–₹1270 Retest / FVG support zone ₹1243–₹1240 Invalidation zone if price closes below ₹1315–₹1325 First upside hurdle ₹1355 Major resistance / target area ₹1375–₹1385 Extended upside zone if momentum continues AXISBANK — Retest of FVG Before Next Move? AXISBANK has shown a good recovery from the lower levels and is currently trading near ₹1304 on the daily chart. My view is that price may first come for a retest around the ₹1262–₹1270 zone, where the May 22 candle created a Fair Value Gap / imbalance area. This zone can act as a demand area if buyers step in again. I will watch for a bullish rejection, strong green candle, or volume support near this level. If the retest holds, AXISBANK can again attempt an upside move toward ₹1315–₹1325, followed by ₹1355 and possibly higher levels. The setup becomes weak if price breaks and closes below ₹1243–₹1240, because that would mean the demand/FVG zone has failed. Plan: Wait for retest → observe price action near ₹1262 → enter only after confirmation → avoid chasing at current level. I am not a SEBI-registered analyst. This idea is shared purely for educational and study purposes. Please do your own analysis or consult a certified financial advisor before taking any trades.Longby salaisargunansp5
NSE – NIFTY 750 | AXIS BANK | 11 FEB 2026Axis Bank – Monthly Structural View Range → regime-shift → sustained impulsive continuation observed. Post-2009 structural transition established a multi-year uptrend. 2020 correction behaved as a reset within trend. Current phase: higher-range consolidation within an established uptrend. No directional prediction — structure study only. This is a structural study for educational purposes only. Not investment advice. #NIFTY750 #AxisBank #MarketStructure #EquityStructure #IndianMarketsby kacraj4
Axis Bank Ltd (NSE) – Bullish Continuation SetupTimeframe: Daily Trend Bias: Bullish Current Price: ~₹1,370 Technical Overview Axis Bank is trading in a strong uptrend, respecting higher highs and higher lows. Price has recently broken above a consolidation range and is sustaining above the key Fibonacci 0.382 retracement zone, indicating strength and acceptance at higher levels. The structure suggests a bullish continuation rather than exhaustion, with momentum favoring buyers as long as price holds above the breakout base. Key Levels (as per chart) Immediate Support: ₹1,325 – ₹1,335 (Fibonacci base & prior range high) Secondary Support: ₹1,285 – ₹1,270 (demand zone / value area) Immediate Resistance: ₹1,395 – ₹1,405 (Fibonacci -0.382 to -0.618 zone) Major Target: ₹1,590 – ₹1,600 (measured move / higher timeframe projection) Trade Plan Bullish Scenario (Preferred): Entry: Buy on dips near ₹1,335–₹1,350 or on a decisive daily close above ₹1,395 Targets: T1: ₹1,440 T2: ₹1,520 T3: ₹1,590+ Bearish Invalidation: A daily close below ₹1,315 would weaken the bullish structure and may lead to a deeper retracement towards ₹1,285. Indicator Confluence Volume: Expansion visible during the recent breakout, confirming participation Momentum (RSI/Trend strength): Positive and trending upward, no bearish divergence Market Structure: Clean breakout + retest behavior Conclusion Axis Bank remains structurally bullish on the daily timeframe. As long as price holds above the ₹1,315–₹1,325 zone, the probability favors further upside toward ₹1,590+. Traders should focus on pullback entries or breakout confirmation for optimal risk-reward. ⚠️ This is a technical view only. Not financial advice.Longby TEDXTradesindia2
AXIS BANKAXIS BANK – ATH HIGH BREAKOUT Price ATH resistance ke upar close diya hai with strong volume. Trend clearly bullish – 20 EMA > 200 DMA, pullbacks shallow. Buy: Retest near 1,340–1,350 or fresh high sustain. SL: 1,290 (20 EMA) | Targets: Trail with trend, higher highs expected. ATH breakout + volume = continuation bias. 📈Longby DEVA4351
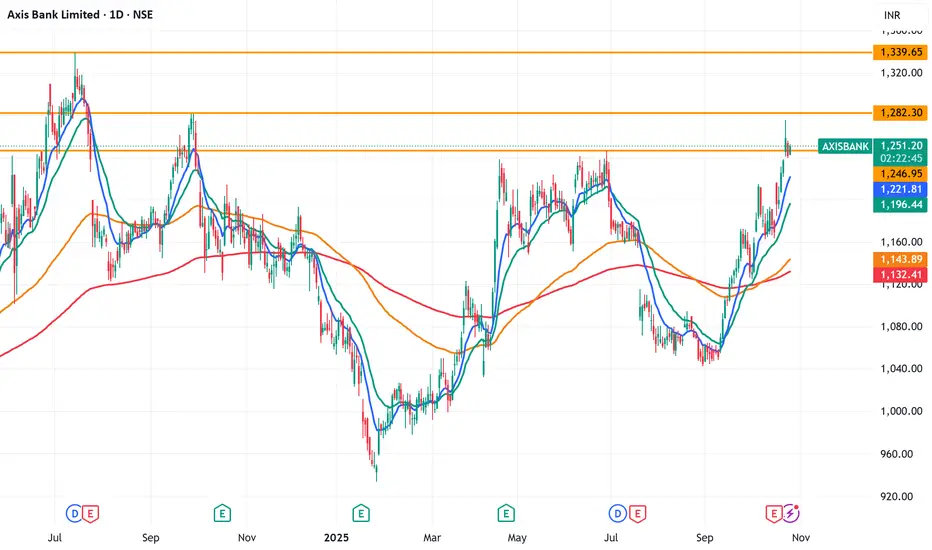
Breakout confirmation in Axis BankAfter forming a rounding bottom on daily chart, and consolidation near 1247 level, finally it has given breakout and trading above the level. If it sustains, 1282 should be easily achievable and next would be 1338 in short termLongby RahulBaidUpdated 2
Axis Bank | Gann Square of 9 – 45° Reaction Zone | 12 Apr 2022This idea highlights a historical intraday case study on Axis Bank Ltd, demonstrating how Gann Square of 9 price-degree mapping helps identify logical reaction zones. On 12 April 2022, Axis Bank showed a textbook example of degree-based price behavior using Gann’s geometric framework. 📈 Price–Degree Structure 0° reference: ₹777.80 45° projection: ₹791.81 90° projection: ₹805.94 Price advanced from the 0° base and completed the 45° distance well within the intraday time window. ⏱️ Gann Time Principle As per Gann’s intraday methodology: When 45° is reached before 2:30 PM, it often acts as a reaction or resistance zone In this session, price touched the 45° level and showed a clear reaction, validating the relevance of degree-based price geometry. 📐 Key Observation Although price later moved toward the 90° level, it remained confined between the 45°–90° range, illustrating how Gann degrees often act as natural market boundaries rather than arbitrary levels. 🧠 Conclusion This case demonstrates how converting price into degrees using the Gann Square of 9 allows traders to: Anticipate logical reaction zones Avoid emotional decision-making Understand structure instead of chasing momentum Disclaimer: This idea is shared strictly for educational and analytical purposes only. It does not constitute any investment advice or trade recommendation. Educationby WD_Gann_Theory2
Axis Bank | Gann Square of 9 – No Trade Day Case StudyThis idea shares a historical intraday case study on Axis Bank Ltd, demonstrating how Gann Square of 9 degree + time rules help traders identify sessions with no valid trading opportunity. On 11 April 2022, Axis Bank presented two separate Gann reference structures, yet neither fulfilled the conditions required for a high-probability trade. 📈 Upside Structure 0° reference: ₹786.05 Projected 45° level: ₹800.13 Price moved upward from the 0° base but failed to reach the 45° level within the intraday time window, resulting in no valid sell-side setup. 📉 Downside Structure 0° reference: ₹794.25 Projected 45° level: ₹780 Later in the session, price declined from the new 0° base, but once again did not complete the 45° downside move, eliminating any valid buy-side opportunity. ⏱️ Gann Time Rules Applied As per Gann’s intraday principles, a tradable setup generally forms when: 45° is reached before 2:30 PM, or 90° is reached before 2:45 PM Neither condition was met during this session. 🧠 Conclusion April 11, 2022 stands out as a clear “No Trade Day”. This chart reinforces a core Gann principle: Capital protection begins with patience. Not every session offers opportunity — and recognizing that is a skill. Disclaimer: This idea is shared strictly for educational and analytical purposes only. It does not constitute any trading advice or recommendation. Educationby WD_Gann_Theory1
Axis Bank | Gann Square of 9 – No-Trade Case Study This idea presents a historical intraday case study on Axis Bank Ltd, highlighting how Gann Square of 9 degree rules help traders identify non-tradable sessions with clarity. On 8 April 2022, Axis Bank initiated an upward move from the 0° reference near ₹789. Using Gann Square of 9 calculations, the next key projection was the 45° level near ₹803. Throughout the session, price failed to complete the 45° movement within the intraday time window, and no meaningful interaction occurred at the projected degree level. As per Gann’s methodology, when price does not reach the expected degree within time, the session is classified as a no-trade day. 📐 Observed Gann Levels 0° → ₹789 45° → ₹803 🧠 Key Learning Gann theory is not only about finding trades — it is equally about avoiding low-probability conditions. This chart demonstrates: Respect for degree boundaries Absence of forced entries Importance of patience and structure Sometimes, no trade is the best trade. Disclaimer: This chart is shared strictly for educational and analytical purposes. It does not represent any trading recommendation. Educationby WD_Gann_Theory0
Axis Bank | Gann Square of 9 – 45° Reversal Case Study | 4 Apr 2This idea documents a historical intraday case study on Axis Bank Ltd, demonstrating how Gann Square of 9 degree levels act as precise resistance zones. On 4 April 2022, Axis Bank initiated an upward move from the 0° reference near ₹767. Using the Gann Square of 9 calculation, the 45° projection was identified near ₹781. Price advanced steadily and formed a high at ₹780.55, coming within 0.5 points of the calculated 45° level. This reaction fell well within the acceptable tolerance range and resulted in a clear intraday rejection from the 45° degree zone. 📐 Key Gann Levels Observed 0° → ₹767 45° → ₹781 🧠 Concept Highlight According to Gann’s price-degree structure, when price approaches a 45° level within the intraday time window, it often behaves as a temporary resistance or reversal zone. This example shows: Respect for angular resistance Precision of degree-based levels How small deviations can still validate Gann structure Disclaimer: This chart is shared for educational and analytical purposes only. It does not constitute a buy or sell recommendation. by WD_Gann_Theory0
Axis Bank | Gann Square of 9 – 45° Reversal Case Study | 4 Apr 2This idea documents a historical intraday case study on Axis Bank Ltd, demonstrating how Gann Square of 9 degree levels act as precise resistance zones. On 4 April 2022, Axis Bank initiated an upward move from the 0° reference near ₹767. Using the Gann Square of 9 calculation, the 45° projection was identified near ₹781. Price advanced steadily and formed a high at ₹780.55, coming within 0.5 points of the calculated 45° level. This reaction fell well within the acceptable tolerance range and resulted in a clear intraday rejection from the 45° degree zone. 📐 Key Gann Levels Observed 0° → ₹767 45° → ₹781 🧠 Concept Highlight According to Gann’s price-degree structure, when price approaches a 45° level within the intraday time window, it often behaves as a temporary resistance or reversal zone. This example shows: Respect for angular resistance Precision of degree-based levels How small deviations can still validate Gann structure Disclaimer: This chart is shared for educational and analytical purposes only. It does not constitute a buy or sell recommendation. by WD_Gann_Theory0
Axis Bank | Major Gann Levels – Neutral Day Case Study | 31 Mar This idea presents a historical intraday case study on Axis Bank Ltd, highlighting how Gann degree levels help traders identify when to stay out of the market. On 31 March 2022, Axis Bank respected Gann geometry on both the upside and downside, but no valid degree completion occurred, resulting in a neutral, no-trade session. 🔹 Downside Analysis Initial 0° reference was marked near ₹760.95 Price moved lower but failed to reach 45° at ₹751 As per Gann Totaliser rules, no long trade was allowed 🔹 Upside Analysis After rebounding near ₹751.30, this low became the new 0° Upside 45° was calculated near ₹765 Price did not touch the 45° level Hence, no short trade was triggered 📐 Major Gann Degree Levels Used Upside Degrees 0° → 751 45° → 765 90° → 779 135° → 793 180° → 807 Downside Degrees 0° → 761 45° → 747 90° → 734 135° → 720 180° → 707 🧠 Key Learning Gann’s method is not about constant trading. When price does not complete a degree within time, the correct decision is no trade. This session clearly demonstrates: Respect for angular boundaries Market neutrality Discipline over prediction Disclaimer: This idea is shared strictly for educational and chart-analysis purposes only. It is not a buy or sell recommendation. by WD_Gann_Theory0
Axis Bank | Gann Numbers – No Trade Day Case Study | 29 Mar 2022This idea shares an intraday historical case study on Axis Bank Ltd, demonstrating how Gann Numbers and price geometry help traders decide when NOT to trade. On 29 March 2022, Axis Bank opened near the 0° reference level at ₹741.50. Using Gann Number calculations, the following degree-based levels were projected for the session: 0° = ₹741 45° = ₹727 90° = ₹714 135° = ₹701 180° = ₹688 During the session, price moved lower from the 0° zone but failed to reach the 45° level within the valid time window. As per Gann Circle rules, no angular completion meant no valid trade setup. This resulted in a NO-TRADE DAY, which is an equally important outcome in rule-based trading. 📌 Gann Rule Highlighted Trade consideration only when: 45° is reached before 14:30 or 90° is reached before 14:45 If no degree is completed → stand aside 🧠 Key Learning Gann’s methodology is not about trading every day. It is about waiting for mathematical alignment between price and time. When conditions are not met, discipline protects capital. Disclaimer: This idea is shared strictly for educational and analytical purposes only. It is not a trading recommendation. by WD_Gann_Theory0
Axis Bank | Gann Square of 9 – Intraday Case Study | May 20, 202This idea shares a historical intraday case study on Axis Bank Ltd using WD Gann’s Square of 9 to observe price movement through angular degrees. On 20 May 2022, Axis Bank began the session near ₹658, which was treated as the 0° reference level for the day. From this base, price started a steady upward movement. Using Gann Square of 9 calculations, the 45° level for the session was derived at ₹671. By mid-session, the stock reached this 45° degree value, completing its normal angular rotation. Although there was no sharp rejection at that moment, price respected the 45° level and continued to trade around it, eventually closing near the same angular zone. This behavior aligns with Gann’s principle that markets often move in measured geometric steps, where completion of key degrees highlights areas of balance, pause, or potential reaction. 📌 Key Observations 0° reference at ₹658 guided the session structure 45° level at ₹671 acted as an important angular milestone Price respected the degree level even without a strong reversal Degree completion reflects market rhythm, not prediction 📘 Educational Insight This example demonstrates how price–angle geometry can help traders study intraday behavior logically. Gann methods focus on structure and timing, allowing traders to analyze market movement without emotional bias. Disclaimer: This idea is shared strictly for educational and analytical purposes only. It is not a trading recommendation. by WD_Gann_Theory0
Axis Bank | Gann Degrees & Intraday Reversal | May 25, 2022This idea presents a historical intraday case study on Axis Bank using WD Gann degree calculations to analyze price behavior and reversal zones. On 25 May 2022, Axis Bank opened with a downward bias. The intraday reference was established using the day’s high at ₹672, marked as the 0-degree (0°) level. Based on Gann degree progression, the following levels were derived: 0° → ₹672 45° → ₹659 90° → ₹646 As price declined during the session, it approached the 45° level but did not complete the full degree movement before the late afternoon. Around 12:45 PM, the stock reacted sharply from ₹660.05, which was within 1 point of the calculated 45° level (₹659). This reaction occurred inside acceptable price tolerance and aligned with Gann’s concept of degree-based support, after which the stock moved higher toward ₹667, forming a clean intraday recovery. 📌 Key Observations Degree levels help define logical support and resistance Minor deviations around exact levels are normal Time + price alignment improves trade structure Not every move needs indicators to be explained 📘 Educational Takeaway This example shows how Gann geometry converts price movement into measurable zones, helping traders analyze intraday behavior with structure instead of emotion. Disclaimer: This chart study is shared for educational and analytical purposes only. It is not a trade recommendation. by WD_Gann_Theory0
Axis Bank | Gann Numbers & 45° Reversal – Intraday Case Study | This idea presents a historical intraday case study on Axis Bank Ltd, highlighting the use of Gann Numbers and angular price movement to study reversals. On 14 September 2022, Axis Bank opened with bullish momentum. The 0° reference level for the session was identified at ₹794, based on the day’s price structure. Using Gann Number calculations, the next key angular projection was derived: 0° = ₹794 45° = ₹808 As the session progressed, price advanced steadily and completed the 45° level before 14:30, which aligns with Gann’s time–price principles. After reaching this degree, Axis Bank showed clear rejection from the 45° zone, indicating a potential intraday SELL setup. Although the full downside target was not achieved, price respected the angular level, validating the mathematical structure behind Gann’s approach. 📌 Key Takeaways 0° acts as the base reference for intraday structure Completion of 45° before 14:30 often signals exhaustion Rejection from degree levels reflects market balance Focus is on geometry and timing, not prediction 📘 Educational Note WD Gann’s methodology emphasizes that markets move in measured degrees, where price and time work together. Such case studies help traders analyze logical reversal zones without relying on indicators or emotions. Disclaimer: This idea is shared strictly for educational and analytical purposes only and is not investment advice. by WD_Gann_Theory0
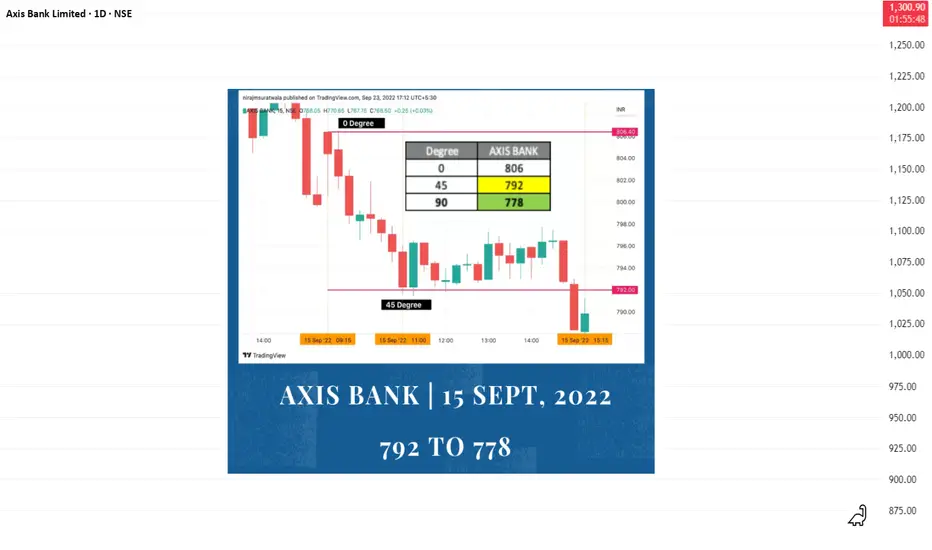
Axis Bank | Gann Square of 9 Intraday Case Study | 15 Sept 2022This idea documents a historical intraday study of Axis Bank using the WD Gann Square of 9 to understand how price reacts at degree-based levels. On 15 September 2022, Axis Bank showed downward momentum, with the day’s high at ₹806 taken as the 0-degree (0°) reference point. Using Square of 9 calculations, the important projected levels were: 45° → ₹792 90° → ₹778 By before 2:30 PM, price completed its 45° movement and reached ₹792, aligning with Gann’s concept of normal intraday capacity. At this level, price stabilized and showed a supportive reaction, leading to a short-term upward move. Although the rebound was limited and did not extend significantly beyond the intraday range, the price behavior respected the mathematical structure of the Square of 9, reinforcing how degree-based levels can act as logical support zones. This case demonstrates that: Not every setup produces large profits Structure, timing, and discipline matter more than outcome Gann levels help traders avoid emotional decision-making 📌 Key Square of 9 Levels 0° → ₹806 45° → ₹792 90° → ₹778 📘 Educational Notes 45° completion before 2:30 PM often marks a reaction zone Minor tolerance around levels is common Square of 9 provides price clarity, not prediction certainty Disclaimer: This idea is shared strictly for educational and chart-study purposes only. It is not trading advice. by WD_Gann_Theory0
 Long
Long