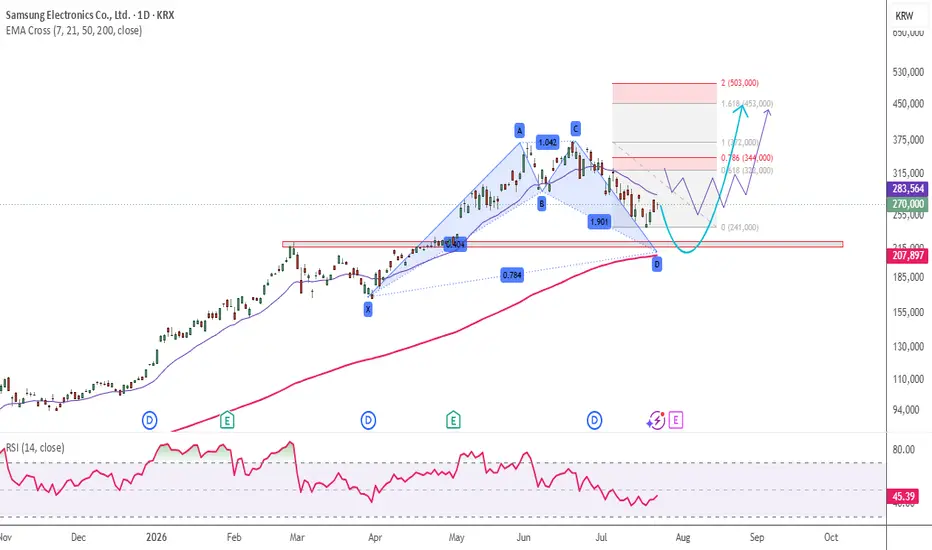
Samsung Electronics — Bearish Roadmap | 275 First, 230Samsung Electronics is presenting a two-stage market scenario in which price can first extend higher toward 275, followed by a potential bearish reversal toward the 230 target.
The important part of this setup is the sequence. The immediate move is not being treated as a direct decline. Instead, th
Samsung Electronics Co Ltd Sponsored GDR Pfd
No trades
No trades
Key facts today
Samsung Electronics (005930) shares climbed ~3.3% to 285,500 won in Seoul after CXMT announced mass production of 5th‑gen DRAM and LPDDR5X, raising memory‑market competition and price pressure. 1
385 USD
31.20 B USD
235.15 B USD
Company info
Sector
Industry
Website
Headquarters
Suwon-si
Founded
1969
IPO date
Jun 11, 1975
ISIN
US7960502018
CUSIP
796050201
FIGI
BBG000BSD1N3
Identifiers
ISIN US7960502018
Samsung Electronics Co., Ltd. engages in the manufacturing and selling of electronics and computer peripherals. The company operates through following business divisions: Device Experience (DX), Device Solutions (DS), Samsung Display (SDC), and Harman. The DX division offers televisions, monitors, refrigerators, washing machines, air conditioners, smartphones, network systems, and computers. The DS division deals with semiconductor components including DRAM, NAND Flash, and mobile APs. The SDC division provides OLED panels for smartphones. The Harman division consists of digital cockpits, car audio, and portable speakers. The company was founded on January 13, 1969 and is headquartered in Suwon-si, South Korea.
What Is the Most Important Level at the Current Price???
Hello, traders.
If you follow me, you'll be able to receive new market updates and analysis quickly.
I hope you have a successful trading day.
================================================================
===================================================
The most important price level
Samsung Electronics (SMSN) Samsung Electronics (SMSN)
Hello everyone and welcome back, dear TradingView followers! 👋📊
I hope you're all doing great and that your trading journey is going smoothly with proper risk management and discipline. 🙏
Today, let's take a look at Samsung Electronics – SMSN on the 4-hour timeframe and
Samsung Electronics : Pullback Before the Next Rally ?KRX:005930 Daily Chart
📈 Key Decision Zone Ahead: Pullback Before the Next Rally? 👀
The stock has staged an impressive recovery after rebounding from the 0.55 Fibonacci retracement zone, confirming strong buying interest from a major technical support area.
However, the next challenge has arrive
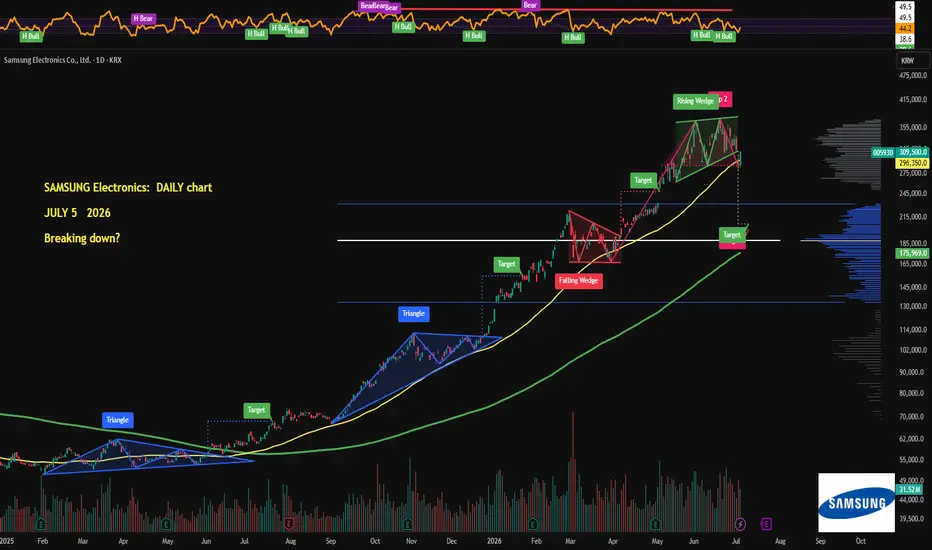
SAMSUNG -10% this WEEK, correction uinderway!Samsung is down more than 10% this week, while NASDAQ:SMH (VanEck Semiconductor ETF) is down 6%.
So those two nearly identical Rising Wedge breakdowns - one in Korea, one in the US, both in the semiconductor sector - probably weren't a coincidence. Looks more like the correction is underway.
The
Samsung Electronics vs $SMH: RISING WEDGES' breakdowns!
Samsung accounts for roughly 9% of AMEX:EEM , one of my main long-term portfolio positions, so I follow it closely. Unfortunately, the chart isn't looking great right now. After a roughly 600% rally over the past year and a series of record quarterly results, the daily chart looks quite close to
$Samsung 36 Analysts Say Buy. HBM Revenue to Triple!Samsung Electronics just posted the strongest quarter in its entire corporate history. 🏆 Operating profit surged 756% year over year to ₩57.2 trillion ($39 billion). 🤯
Revenue hit a record ₩133.9 trillion ($91 billion), up 69% year over year. The AI memory supercycle is real and Samsung is sitting
The Three Events That Could Move Global Indices This WeekGlobal stock indices enter the week with several major events to worry about:
the G7 response to the Strait of Hormuz closure,
Nvidia’s earnings on Wednesday,
and pressure on Korean technology stocks.
These events come at a delicate time for equities. The S&P 500 and Nasdaq hit fresh
See all ideas
Summarizing what the indicators are suggesting.
Oscillators
Neutral
Oscillators
Neutral
Summary
Neutral
Summary
Neutral
Summary
Neutral
Moving Averages
Neutral
Moving Averages
Neutral
Displays a symbol's price movements over previous years to identify recurring trends.