ltcbtc bulishThe price has touched my historical simple moving average "crash" band. I would not be shocked to see the price drop further into the $260s before a rise. However, the near-term doom could go further into the year. I am anticipating another drop to the "major crash" simple moving average band into the $190s and $220s to close out the remaining price gaps on the daily chart that occurred during the COVID crash.
In-depth trading ideas
Repeat Of 2017 About To Happen Dont Sleep On This OneIt looks to me that the long multi year downtrend for LTC BTC is finally coming to an end. Massive bullish divergence on the RSI that is extremely similar to the 2016-2017 divergences we had INCLUDING the massive scam wick. I think Litecoins time to shine is right around the corner and holders of Litecoin who have held through thick and thin will be massively rewarded and a "notable class of millionaires within our society" - Clif High. Not financial advice.
LTC is hitting max profitLitecoin is setting up like Nvidia in the bigger picture. I see mass adoption coming for crypto while most people are planning for a big, multi-year bear market. Last time we had bear markets in crypto, everything was very overvalued, but this time we are seeing that everything is super undervalued. Because of this, I see this as a really good chance to buy Litecoin and most altcoins.
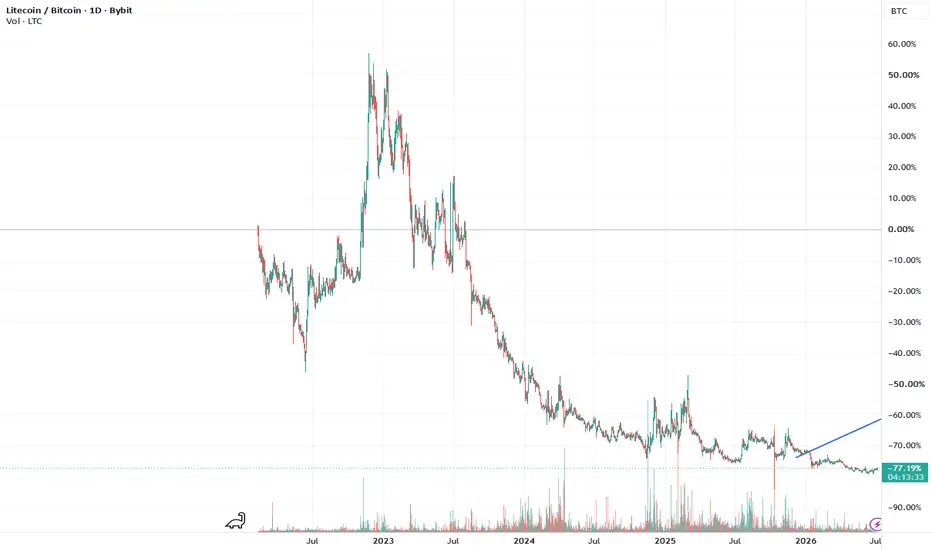
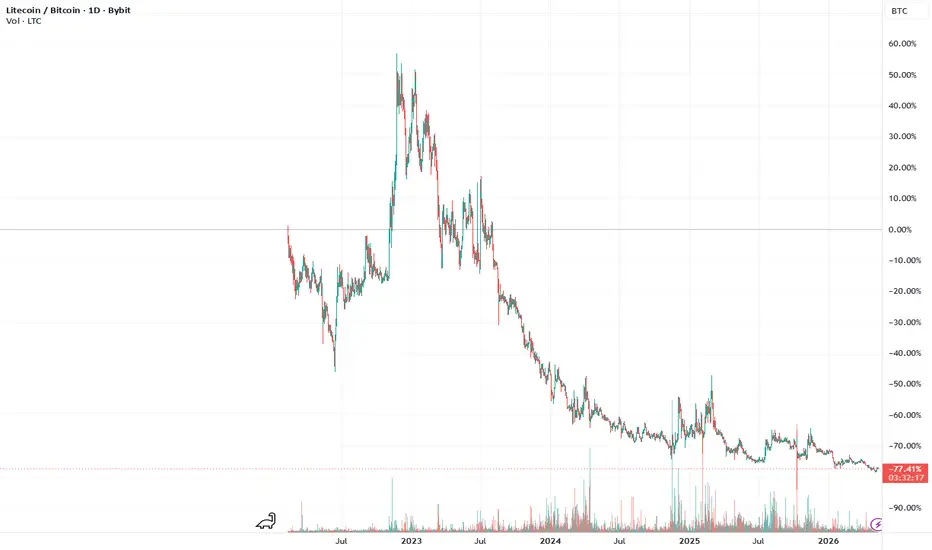
LTCBTC: CLEAR AS DAYOTHERS Marketcap shows reversal, with confluence on LTCUSDT
Each & every time LTC has gotten to these levels, it has been a good idea to buy.
Don't overthink it, sell some at $115 (2x), and make sure to leave a moonbag. $1k valuation isn't farfetched with such ledger history and utility (likely option for vendors that take BTC).
Stop loss: $49
Entry: $57
Local Target: $115
High reward, low risk. Make sure to leave a moonbag.
LTCBTC Monthly – Multi-Year Downtrend Nearing Exhaustion?RSI Structure Suggests a Major Reversal Brewing
Timeframe: 1M (Monthly)
LTCBTC has spent almost a decade grinding lower inside a clearly defined multi-channel descending structure. Every major rally has formed a lower high, respecting long-term trendlines dating back to 2014–2015.
Price is now compressing at the bottom of the macro falling wedge/channel, with volatility at historic lows and volume drying up—a structure that often precedes a major trend change.
📐 Price Structure
1. Macro Downtrend Channels
Red support line marks the absolute long-term floor, tested several times since 2023–2025.
Price is currently sitting right on that red long-term support, with early signs of demand returning.
2. Volume Profile
Volume has been steadily decreasing for years.
This type of volatility + volume contraction at major support has historically preceded large expansions (both bullish or bearish, but combined with RSI, the bullish case is stronger).
📊 RSI Momentum Analysis
This is the strongest part of the chart.
1. Long-Term RSI Downtrend (Orange)
RSI has been respecting a 10-year descending trendline, creating lower highs since 2017.
Price is approaching this trendline again from below.
A monthly breakout above this RSI resistance would be the first macro bullish confirmation in nearly a decade.
2. RSI Higher Lows (Red)
Despite price making flat or lower lows, RSI is making higher lows, creating:
A long-term bullish divergence
A tightening momentum structure, signaling diminishing seller strength
This is the exact structure seen before previous LTCBTC macro reversals.
📈 Bullish Case
If LTCBTC holds the red support and RSI continues upward:
Key bullish triggers:
🔵 Monthly RSI breakout above the orange resistance line
🟢 Monthly close above the orange descending price channel
🟩 Volume expansion returning after multi-year compression
Targets on breakout (from conservative to aggressive):
0.0022 (bottom of mid-green channel)
0.0040 (mid of macro channel)
0.0060–0.0080 (top of the long-term green channel)
📉 Bearish Case
If LTCBTC loses the red macro support:
Structure invalidation
Retest of historical lows
Continuation of multi-year bleed
This would require RSI also rejecting at the orange line and rolling over.
📌 Conclusion
LTCBTC is sitting on a once-per-cycle support zone while RSI prints a multi-year bullish divergence and approaches a key breakout trendline.
This is one of the most interesting long-term setups on the chart in 2025.
Price compression + RSI compression + long-term support often leads to explosive moves.
Not financial advice — just a chart-based idea.
Is Litecoin finally ready to pop for real this time? 1600% gainAs many of you have been, I'm watching crypto prices closely since the BTC jump to $123k, waiting for the next move. Well, today we see that move and the entire market is blood red, except for...
Litecoin.
The patiently waiting little brother of the "big 3", waiting for his time to grow up and shine. Well today I'm impressed, mr. Litecoin is the only green coin in my entire Watchlist.
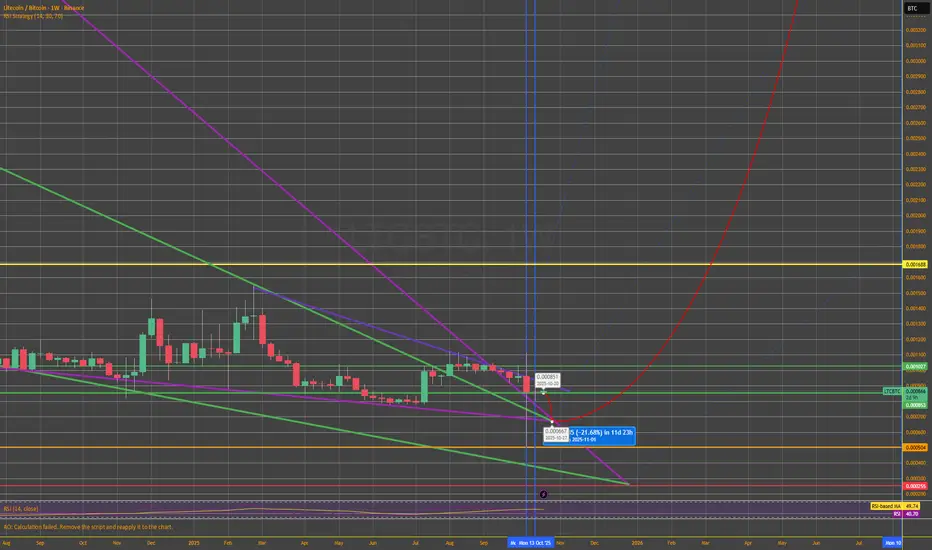
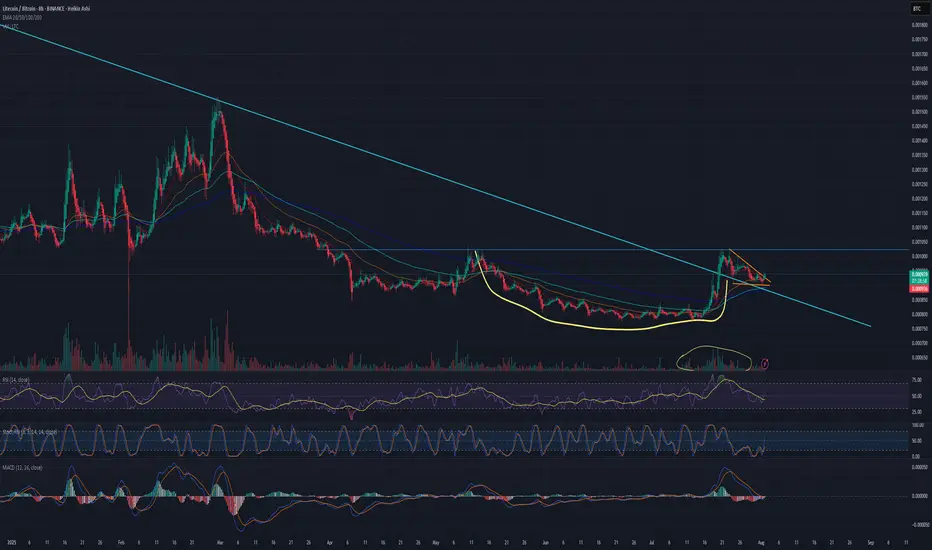
Zooming in on the chart: there’s a clean, rounded cup and a crisp handle forming, and that handle looks like it’s already breaking out. If Bitcoin can hold the $112K level, I think this could be the start of some serious moves from LTC.
The perfect bull flag that's formed on the chart has good volume too.
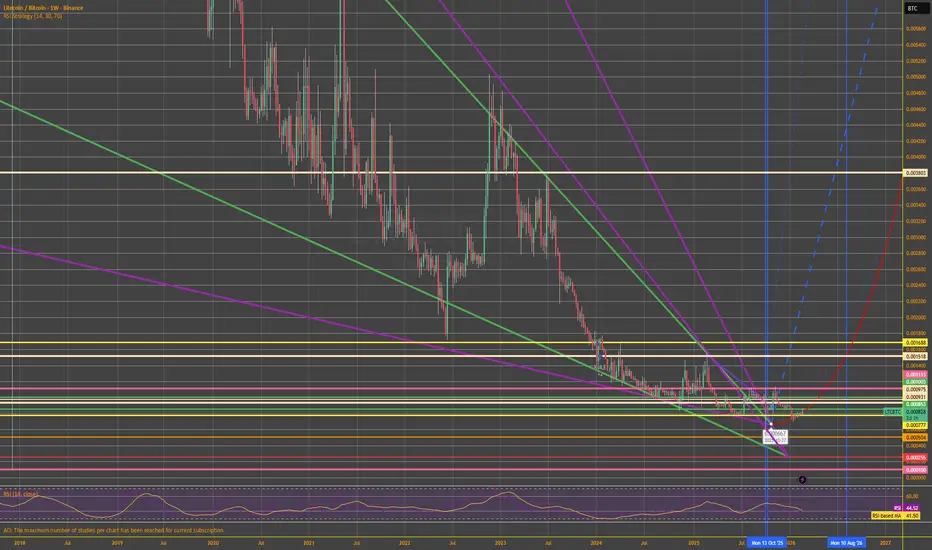
That blue line coming down is a long term trendline, and price is consolidating above it.
Still thinking about that "1600%"?
If you zoom out, there's a massive descending wedge forming since 2014 (11 years!!!). If Litecoin finally breaks out of it, the first fib level (.236) is at .01275BTC, that's 1600% up from here.
We'll see.
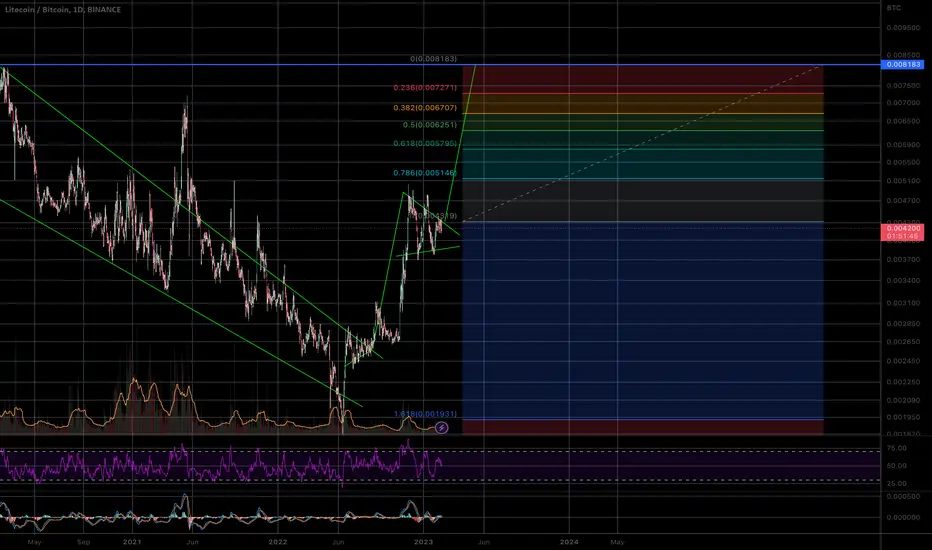
LTCBTC Secular Low launching into the Golden Ratio.One of the biggest sleepers in the cryptoverse. Watch it launch into the Golden Ratio as BTC calms down into the 161.8 grand mark.
Not too sure where the bottom is for LTCBTC, but who cares? The final trajectory here looks to be around 0.01, which puts LTCUSD around $1618 per piece.
This is in fact the silver bullet that will kill the upcoming altseason - be forewarned.
Litecoin vs Bitcoin —The Institutional Wave? Consider the ETFsStarting November 2022 LTCBTC (Litecoin vs Bitcoin) went on a major downtrend, until November 2024. After November 2024 this downtrend is no more.
There was a bounce late last year and this event changed the chart. The latest low last month, June 2025, ended up as a technical double-bottom. Less than 5% below the November 2024 low and this low happened after 217 days. This means that in seven months sellers became exhausted and they couldn't produce a new major low. This reveals that the bearish trend is over. Once the downtrend ends, we get a change of trend, a change of trend implies an uptrend, an uptrend implies long-term growth. We are looking at a long-term bottom and... From the bottom we grow.
This is not an opportunity that presents itself often. The BTC trading pairs are hard to trade. These are for experts only. A new opportunity is developing that can lead to exponential growth. It is amazing how this section of the market works. LTCBTC will grow as Bitcoin and the rest of the market grows. This tends to produce a multiplier effect that is hard to explain. You will understand when you see it in action.
LTCBTC is hitting bottom. The bottom is already established, several weeks old. The candles low is flat, we can expect massive growth; excitement and institutional adoption on Litecoin thanks to the ETFs, it will be the first time this pair grows in years and the type of chart it will produce it is hard to tell.
We are entering uncharted territory. The bullish phase can be mild just as it can be ultra-strong. There is no limit to the upside. It can grow for years or for 4 to 8 months. Both scenarios look good.
The best part is to catch the bottom; an early wave. Prices are low now, easy to buy and hold. Focus on the long-term.
Litecoin has good potential for this incoming 2025 bull market.
Thank you for reading.
Namaste.