Litecoin (LTC): Biggest Buy Zone in Years? Multi-Year AccumulatiAfter analyzing Litecoin on the monthly timeframe, I believe we are currently trading inside one of the best risk-to-reward buy zones the asset has offered in years.
For almost five years, LTC has been forming a broad accumulation structure while respecting a major long-term support area around $40
LTCUSD BUY 46.0On the daily chart, LTCUSD has formed an inverse head-and-shoulders pattern. Attention should currently be focused on the support level near 46.0; if the price pulls back and stabilizes there, further buying could be considered. To the upside, watch the previous supply zone at 51.0–52.7.
LITECOIN [$LTC] EWP TC FIB ANALYSIS WEEKLY TFLTCUSD – The final shakeout before the next impulsive cycle?
Litecoin continues to respect the larger structural roadmap. Price is now approaching the confluence of long-term channel support, historical horizontal demand, and the projected termination zone of the current Elliott Wave decline.
The
LTCUSD: Keep an eye on the demand zoneOn the daily chart, LTCUSD is currently trading at low levels; in the short term, focus on the demand zone between 39.2 and 42.1. If the price pulls back and stabilizes there, consider buying. Monitor resistance near 46.3; a breakout above this level could potentially form an inverse head-and-should
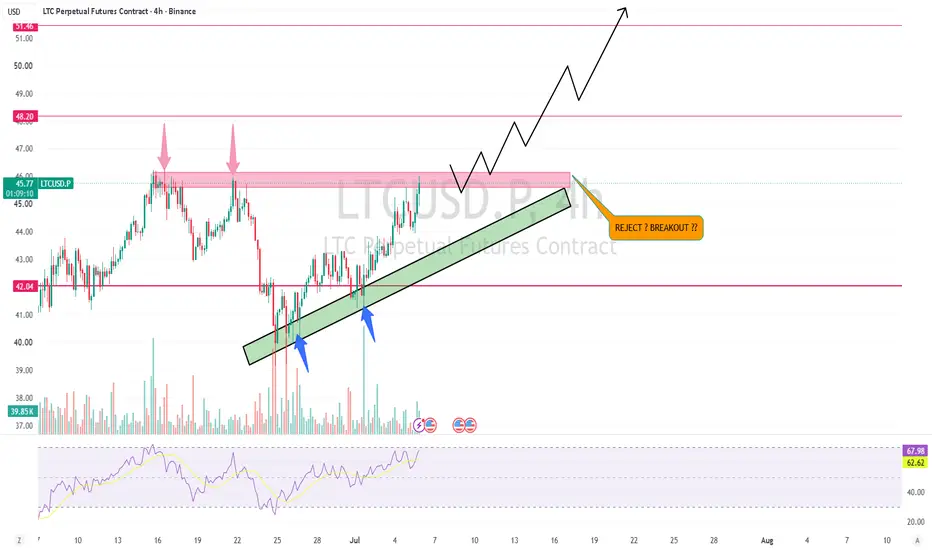
$LTC Is Testing a Key Resistance ZoneNYSE:LTC Is Testing a Key Resistance Zone
LTC has climbed back into a major resistance area that previously rejected price multiple times. This zone around $45.8 is the level bulls need to reclaim to confirm that momentum is shifting in their favor.What's encouraging is the series of higher lows f
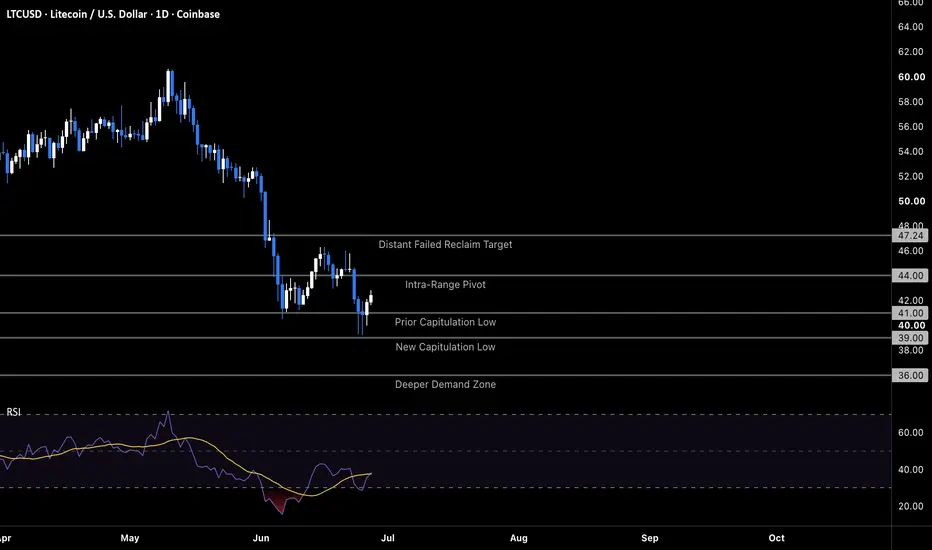
LTCUSD post-sweep decision: $44 pivot decides next legThe Macro Picture 🗺️
Two consecutive bullish theses on LTCUSD have been rejected by the chart since the May breakdown — first the $50 floor cracked, then the $41 divergence-led reclaim attempt failed when price swept to a new capitulation low at $39. Bulls have dragged price back to $42, putting t
LTCUSD divergence retest: targeting $46 reclaimThe Macro Picture 🗺️
LTCUSD continues to trade well below the prior $52–$60 range that broke down in late May, with the structure now operating inside a tighter $41–$46 corridor. The June 14 reclaim attempt got partway there — bulls pushed to $46 but failed to tag the $48 first-reclaim target, and
LTCUSD: The Death of a Legacy Narrative. Multi-Year Inverted HVF📉 🪙 🥶 📉
📉 🪙 🥶 📉
📉 🪙 🥶 📉
1. The Macro Structure:
An Inverted Volatility Trap.
When an asset fails to make higher macro highs over multiple market cycles, it’s not consolidation—it’s long-term distribution.
The Geometry: Looking at the weekly chart, the price action has carved out a massive Invert
Litecoin has maintained it's HVF and can STILL do a 10X...in the coming years.
This is a massive pattern formed over 7 years and I expect over performance of target 3 ultimately.
The day to week price action really does not matter when you have beautiful setups like this.
Keep stacking at these low prices.
@TheCryptoSniper
See all ideas
Summarizing what the indicators are suggesting.
Oscillators
Neutral
SellBuy
Strong sellStrong buy
Strong sellSellNeutralBuyStrong buy
Oscillators
Neutral
SellBuy
Strong sellStrong buy
Strong sellSellNeutralBuyStrong buy
Summary
Neutral
SellBuy
Strong sellStrong buy
Strong sellSellNeutralBuyStrong buy
Summary
Neutral
SellBuy
Strong sellStrong buy
Strong sellSellNeutralBuyStrong buy
Summary
Neutral
SellBuy
Strong sellStrong buy
Strong sellSellNeutralBuyStrong buy
Moving Averages
Neutral
SellBuy
Strong sellStrong buy
Strong sellSellNeutralBuyStrong buy
Moving Averages
Neutral
SellBuy
Strong sellStrong buy
Strong sellSellNeutralBuyStrong buy
Displays a symbol's price movements over previous years to identify recurring trends.