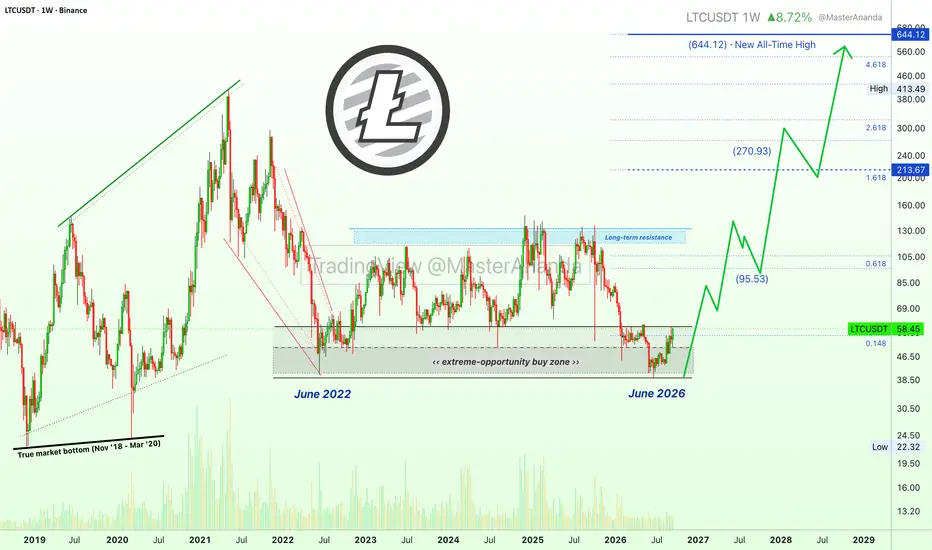
(LTC) Final call to get Litecoin below $60 (Crypto is going up!)This seems to be the last time we will see Litecoin (LTCUSDT) trading below $60 in 2026. This seems to be the last chance to buy Litecoin within the opportunity buy-zone, within long-term support, at bottom prices.
The bottom process in 2026, is a perfect replica of 2022. After the 2022 bottom the
Compare with LTC3xLong/Tether
LTC straight to $100 after breaking $60LTC update on the daily chart. Everything is bullish. Oscillator indicators up to trending indicators.
We can clearly see on the daily chart that we have a resistance level around the $60 range, and soon we will try to break it. After a successful breakout, LTC will immediately teleport into the $1
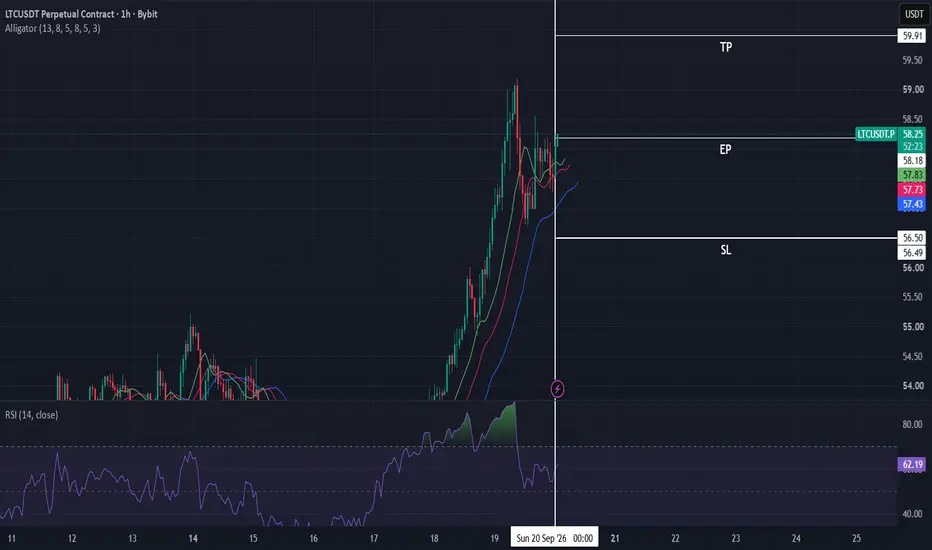
LTCUSDT | Trend-Following Long SetupLTCUSDT remains in a clear uptrend, supported by a consistent sequence of higher highs and higher lows. My overall analysis was completed on the 1 hour chart, where the bullish market structure remained intact and no bearish RSI divergence was present.
For execution, I moved to the 15 minute chart
LTC/USDT Buy Trade Scenario## 🟢 LTC/USDT — BUY Setup
📊 Asset: Litecoin / TetherUS ⏱️ Timeframe: 15 Minutes 📈 Bias: Bullish / BUY
🟢 Entry: 62.01 🛑 Stop Loss: 60.99 🎯 Take Profit: 63.85 ⚖️ Risk-Reward: Approx. 1:1.80
### 📌 Technical Analysis
LTC/USDT has shown a strong recovery from the marked swing low, followed by bullish
LTC Long-Term Reversal Is Taking ShapeLTC is developing an interesting long-term reversal structure after reacting strongly from the $39–47 support zone.
Price is now pushing higher toward the long-term descending trendline. A clean breakout and sustained acceptance above the trendline could shift the structure and bring $85.97 into fo
LTCUSDT Long Setup | Bullish RSI DivergenceLTC had been trading within a bearish structure, forming consecutive lower highs and lower lows. A bullish RSI divergence then developed, with price printing a lower low while RSI formed a higher low, suggesting that selling momentum was weakening.
I used the 1 hour timeframe for analysis and the 1
LTC just broke the level it was holdingLTC has broken structure to the downside, and the reversal is now unfolding in our favour.
🟠 Why This Level Matters:
Price rejected the 60.50 highs and broke clean through 59.96, confirming the shift lower. That level now flips to resistance and marks the origin of the continuation.
🟠 Gameplan
LITECOIN IS BUILDING..Depending on trend study Litecoin is building new increase, which we follow with live data, until now LTC seems interesting and is able to gain in the coming time to 83 usd+ This can take time, but the cycle of Bitcoin, the chance is good, That Litecoin will gain to next range of level 83 usd+ with
Very Important $LTCUSDT Chart: Broken from a major reversal resExpecting for LiteCoin to keep on going further to the upside, the beak-out above of the strongest local horizontal level of resistance is solid, and with strong bullish momentum, besides that the overall market seem to be bullish, so we could be expecting to see a very great move in the market. Bul
See all ideas
Summarizing what the indicators are suggesting.
Oscillators
Neutral
Oscillators
Neutral
Summary
Neutral
Summary
Neutral
Summary
Neutral
Moving Averages
Neutral
Moving Averages
Neutral
Displays a symbol's price movements over previous years to identify recurring trends.
Frequently asked questions
The current price of LTC3xLong/Tether (LTC) is 0.003323 USDT — it has fallen −3.70% in the past 24 hours. Try placing this info into the context by checking out what coins are also gaining and losing at the moment and seeing LTC price chart.
LTC3xLong/Tether price has risen by 46.46% over the last week, its month performance shows a 53.20% increase, and as for the last year, LTC3xLong/Tether has decreased by −98.07%. See more dynamics on LTC price chart.
Keep track of coins' changes with our Crypto Coins Heatmap.
LTC3xLong/Tether (LTC) reached its highest price on Feb 16, 2023 — it amounted to 3.731170 USDT. Find more insights on the LTC price chart.
See the list of crypto gainers and choose what best fits your strategy.
LTC3xLong/Tether (LTC) reached the lowest price of 0.001097 USDT on Jun 24, 2026. View more LTC3xLong/Tether dynamics on the price chart.
See the list of crypto losers to find unexpected opportunities.
The safest choice when buying LTC is to go to a well-known crypto exchange. Some of the popular names are Binance, Coinbase, Kraken. But you'll have to find a reliable broker and create an account first. You can trade LTC right from TradingView charts — just choose a broker and connect to your account.
Crypto markets are famous for their volatility, so one should study all the available stats before adding crypto assets to their portfolio. Very often it's technical analysis that comes in handy. We prepared technical ratings for LTC3xLong/Tether (LTC): today its technical analysis shows the buy signal, and according to the 1 week rating LTC shows the neutral signal. And you'd better dig deeper and study 1 month rating too — it's sell. Find inspiration in LTC3xLong/Tether trading ideas and keep track of what's moving crypto markets with our crypto news feed.
LTC3xLong/Tether (LTC) is just as reliable as any other crypto asset — this corner of the world market is highly volatile. Today, for instance, LTC3xLong/Tether is estimated as 14.08% volatile. The only thing it means is that you must prepare and examine all available information before making a decision.
You can discuss LTC3xLong/Tether (LTC) with other users in our public chats, Minds or in the comments to Ideas.