Litecoin Range Reclaim ? Litecoin (LTC) is currently trading below a major high-timeframe support level, placing price within a deviation region. A deviation occurs when price briefly moves outside an established range before potentially reversing back inside, often trapping breakout traders and creating the conditions for
Compare with LTC/USDT
LTC Weakness: Is a Deeper Drop Next…!Yello Paradisers! Are you prepared for a potential sharp downside move on #LTC, or are you still calling this “just a healthy pullback” while smart money quietly distributes above you? At first glance, the structure may look harmless. But when we remove emotions and read the chart objectively, the s
Litecoin ($LTC) — Daily Compression + 1H Reload Setup
LTC is beginning to build a constructive continuation structure here.
Higher-Timeframe Context
On the Daily, price has spent the last several weeks rebuilding after the June selloff. It is now compressing beneath a key decision area around $45.70–$46.05, while holding above the recent base and w
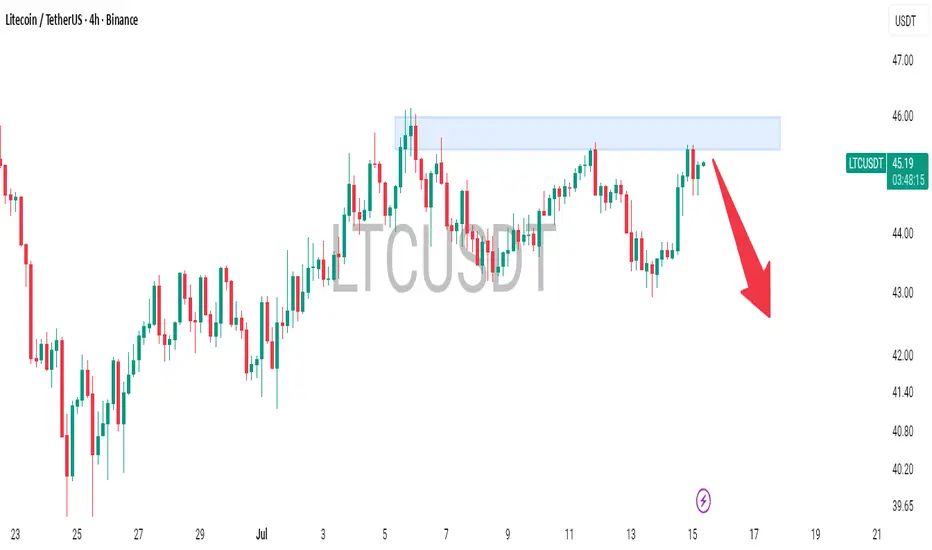
LTCUSDT Analysis | Litecoin Testing Major Supply Zone Litecoin has rallied back into a significant supply zone where sellers have previously taken control. The current price action shows signs of slowing momentum, suggesting buyers may be running into strong resistance.
Unless bulls can produce a decisive breakout above this zone, the probability favo
LTC USDT LONG SIGNAL#90 LTC/USDT – Trade Setup (LONG)
📈 Position Type: LONG
🕒 Timeframe: 1H
📊 Market: Futures
💰 Entry Zone:
45.96
44.53
🛑 Stop-Loss:
43.88
🎯 Take-Profit Targets:
• TP1: 47.09
• TP2: 48.13
• TP3: 49.30
• TP4: 51.30
⚙️ Leverage:
5 *10
▫️ After TP1, move SL to Entry + 0.2%.
▪️ Exit Plan:
LTCUSDT 1D#LTC is trading within a falling wedge pattern on the daily timeframe. Consider accumulating a small position at the current level and adding near key support zones. A confirmed breakout above the wedge resistance could drive the price toward the following upside targets:
🎯 $51.52
🎯 $58.07
🎯 $63.37
LTC to 50$?after the pair breakout the last wide range in the 30 min timeframe the LTC may continue up to get 50$, but the pair must break the 47.89 with high bearish volume. but if we see the volume shrinking after break out and the price break the RP 30 min and start correcting below it. the LTC may fall dow
LTC/USDT (4h) Testing an Inverse Head and Shoulders BreakoutLTC/USDT is testing the neckline of an inverse head and shoulders pattern on the 4H chart, signaling a potential bullish reversal.
A confirmed close above the 46.40 USDT neckline could open the way toward the measured target near 53.70 USDT. Rejection and a move back below the neckline would weaken
$LTC: Bears Continue to Defend Initial ResistanceInitial Resistance Still Holding
Litecoin has pushed back into the $46.00 resistance area, but sellers continue to defend it. Price is also testing the 50-day EMA, adding further confluence to this zone.
Bulls Need a Clear Breakout
A convincing move above $46.00 would improve the short-term stru
Is Litecoin About to Explode?Yello Paradisers! What if the recent pullback was never bearish at all, but simply the final shakeout before Litecoin starts its next impulsive rally?
💎#LTCUSDT continues to respect a textbook Wyckoff Accumulation structure. After printing a Selling Climax, Automatic Rally, Secondary Test, and a su
See all ideas
Summarizing what the indicators are suggesting.
Oscillators
Neutral
SellBuy
Strong sellStrong buy
Strong sellSellNeutralBuyStrong buy
Oscillators
Neutral
SellBuy
Strong sellStrong buy
Strong sellSellNeutralBuyStrong buy
Summary
Neutral
SellBuy
Strong sellStrong buy
Strong sellSellNeutralBuyStrong buy
Summary
Neutral
SellBuy
Strong sellStrong buy
Strong sellSellNeutralBuyStrong buy
Summary
Neutral
SellBuy
Strong sellStrong buy
Strong sellSellNeutralBuyStrong buy
Moving Averages
Neutral
SellBuy
Strong sellStrong buy
Strong sellSellNeutralBuyStrong buy
Moving Averages
Neutral
SellBuy
Strong sellStrong buy
Strong sellSellNeutralBuyStrong buy
Displays a symbol's price movements over previous years to identify recurring trends.
Frequently asked questions
The current price of LTCUSDT SPOT (LTC) is 46.75 USDT — it has risen 0.54% in the past 24 hours. Try placing this info into the context by checking out what coins are also gaining and losing at the moment and seeing LTC price chart.
LTCUSDT SPOT price has risen by 3.19% over the last week, its month performance shows a 13.13% increase, and as for the last year, LTCUSDT SPOT has decreased by −58.91%. See more dynamics on LTC price chart.
Keep track of coins' changes with our Crypto Coins Heatmap.
LTCUSDT SPOT (LTC) reached its highest price on Nov 10, 2021 — it amounted to 295.10 USDT. Find more insights on the LTC price chart.
See the list of crypto gainers and choose what best fits your strategy.
LTCUSDT SPOT (LTC) reached the lowest price of 39.28 USDT on Jun 25, 2026. View more LTCUSDT SPOT dynamics on the price chart.
See the list of crypto losers to find unexpected opportunities.
The safest choice when buying LTC is to go to a well-known crypto exchange. Some of the popular names are Binance, Coinbase, Kraken. But you'll have to find a reliable broker and create an account first. You can trade LTC right from TradingView charts — just choose a broker and connect to your account.
Crypto markets are famous for their volatility, so one should study all the available stats before adding crypto assets to their portfolio. Very often it's technical analysis that comes in handy. We prepared technical ratings for LTCUSDT SPOT (LTC): today its technical analysis shows the buy signal, and according to the 1 week rating LTC shows the sell signal. And you'd better dig deeper and study 1 month rating too — it's sell. Find inspiration in LTCUSDT SPOT trading ideas and keep track of what's moving crypto markets with our crypto news feed.
LTCUSDT SPOT (LTC) is just as reliable as any other crypto asset — this corner of the world market is highly volatile. Today, for instance, LTCUSDT SPOT is estimated as 0.77% volatile. The only thing it means is that you must prepare and examine all available information before making a decision. And if you're not sure about LTCUSDT SPOT, you can find more inspiration in our curated watchlists.
You can discuss LTCUSDT SPOT (LTC) with other users in our public chats, Minds or in the comments to Ideas.