Litecoin Range Reclaim ? Litecoin (LTC) is currently trading below a major high-timeframe support level, placing price within a deviation region. A deviation occurs when price briefly moves outside an established range before potentially reversing back inside, often trapping breakout traders and creating the conditions for a strong move in the opposite direction.
The key confirmation traders should watch for is a reclaim of the previous range. A decisive move back above high-timeframe support would confirm a failed auction, signalling that sellers were unable to maintain control below the range. Failed auctions frequently lead to sharp rotational moves as liquidity is absorbed and price seeks the opposite side of the range.
Despite this bullish possibility, Litecoin must first overcome its current resistance zone. Until resistance is broken, the market remains in a neutral-to-bearish position, with buyers needing to demonstrate enough strength to shift momentum back in their favour. A successful breakout would confirm the deviation and significantly increase the probability of a sustained rally toward the range highs.
If resistance continues to reject price, Litecoin may remain trapped below the range and extend its period of consolidation. However, reclaiming the range and breaking overhead resistance would provide strong technical confirmation that the failed breakdown has completed, opening the door for a higher-timeframe recovery and a rotational move back toward previous highs.
In-depth trading ideas
LTC Weakness: Is a Deeper Drop Next…!Yello Paradisers! Are you prepared for a potential sharp downside move on #LTC, or are you still calling this “just a healthy pullback” while smart money quietly distributes above you? At first glance, the structure may look harmless. But when we remove emotions and read the chart objectively, the story changes completely. This is not a random retracement. This is a high-risk zone where discipline matters more than opinions.
💎#LTC has clearly broken below its ascending support trend line and is now retesting it from underneath. This rejection increases the probability that the previous bullish structure has weakened and the sellers are beginning to take control.
💎#LTC broader market structure has also shifted toward the bearish side, further we have seen a clear divergence on RSI adding further weight to the downside scenario. As long as price remains rejected within the order block zone, the probability continues to favour another move lower.
💎The first important support level is located around $44. If selling pressure continues, this area could act as the next downside magnet. A decisive break below it would further strengthen the bearish structure and expose lower price targets.
💎From Volume Spread Analysis perspective, the sequence is even more revealing. We saw a buying climax followed by a climactic action bar. This combination typically shows distribution. In simple terms, institutions use these aggressive spikes to offload positions into retail enthusiasm. When the crowd feels confident, smart money distributes quietly.
💎#LTC also swept the upper trigger line of the buying climax and collected buy-side liquidity through an upthrust test. However, price failed to remain above that area and was followed by a candle closing below the lower trigger line.
💎#LTC also witnessed a two-bar reversal near the upper trigger line. This is an important probability that supply is dominating demand. If bearish momentum continues, the next major downside target is located around $41.10, and the move could develop faster than many traders expect.
💎If #LTC manages to break above the key resistance at $48.50 with a strong momentum candle, this whole bearish probability would be invalidated, and we could instead see a bullish continuation. As always, we let price confirm our bias.
Discipline is key, Paradisers! The charts may look volatile, but this is where professionals thrive and amateurs panic. Don’t let emotions guide your trades. Wait for clear confirmation and manage risk like a pro. Strive for consistency, not quick profits. Treat the market as a businessman, not as a gambler.
MyCryptoParadise
iFeel the success🌴
Litecoin ($LTC) — Daily Compression + 1H Reload Setup
LTC is beginning to build a constructive continuation structure here.
Higher-Timeframe Context
On the Daily, price has spent the last several weeks rebuilding after the June selloff. It is now compressing beneath a key decision area around $45.70–$46.05, while holding above the recent base and working back into the short EMA structure.
This is still a range until price proves otherwise, but the contraction is constructive. Rather than fully rejecting from the recent push, LTC has held its higher lows and is tightening directly beneath resistance.
Lower-Timeframe Structure
On the 1H, LTC reclaimed out of the descending structure and has since held above its fast EMA cluster.
We are now seeing a potential Recoil → Reload sequence:
Initial expansion → controlled pullback into the EMAs → tightening beneath local resistance
The key is that price is not giving back the entire impulse. It is holding the reclaim and building a smaller Coil near the highs.
Trade Plan
I am watching for Ignition through the local $45.30 area.
A clean break is not enough—I want to see acceptance above that level, ideally followed by a small lower-timeframe hold or Coil before continuation.
If confirmed, the upside levels I am watching are:
$45.70 — Daily area of interest / first major decision point
$46.05 — Local range high and larger breakout confirmation
If price cannot hold the 1H EMA structure and loses the recent higher-low area, the Reload thesis is invalidated and I will wait for price to rebuild.
Summary
LTC is not a chase at current levels. The setup is attractive because risk can stay defined beneath the Recoil structure while the daily has room to expand if it can clear the $45.70–$46.05 resistance zone.
Daily contraction → 1H Recoil → potential Reload.
Waiting for price to show acceptance before treating it as a confirmed breakout.
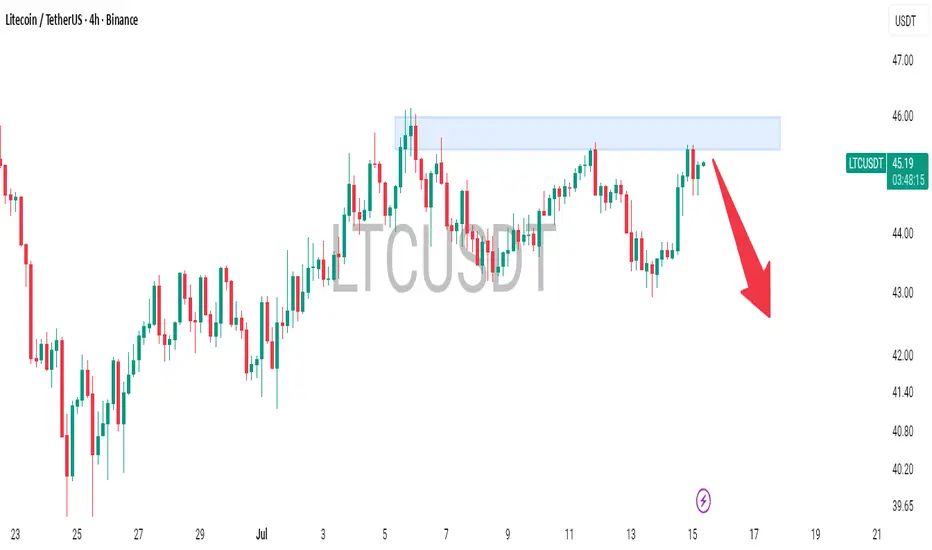
LTCUSDT Analysis | Litecoin Testing Major Supply Zone Litecoin has rallied back into a significant supply zone where sellers have previously taken control. The current price action shows signs of slowing momentum, suggesting buyers may be running into strong resistance.
Unless bulls can produce a decisive breakout above this zone, the probability favors a bearish rejection toward lower support levels.
---
🔍 Technical Analysis
LTCUSDT has recovered from its recent lows and is now testing the $45.50–$46.00 supply zone. This area has acted as resistance in the past and is once again attracting selling pressure.
Price is struggling to close above resistance, while the recent candles show signs of indecision. This suggests sellers are defending the zone and a pullback could develop if buyers fail to break through.
A confirmed bearish rejection from the supply zone would strengthen the case for a move toward the next demand area.
---
📊 Trade Idea
🔴 Sell Zone
Current supply zone ($45.50–$46.00) after bearish confirmation.
🎯 Target 1
$44.20
🎯 Target 2
$43.50
🎯 Target 3
$42.80
🛑 Stop Loss
Above the highlighted supply zone.
---
✅ Why I'm Bearish
Price is trading inside a major supply zone.
Sellers have previously rejected this area.
Bullish momentum is weakening near resistance.
Risk-to-reward favors a downside move if resistance holds.
Potential lower high formation on the 4H timeframe.
---
📈 Market Outlook
The next move depends on how price reacts within the highlighted resistance area. If sellers continue defending the supply zone, Litecoin could experience a corrective decline toward lower support levels.
However, if buyers manage a strong 4H close above $46.00, the bearish setup would weaken and could lead to a continuation toward higher resistance.
---
⚠️ Invalidation
A sustained breakout and close above the supply zone would invalidate the bearish setup and signal that buyers have regained control.
Wait for price confirmation before entering any position, and always apply disciplined risk management.
Do you think Litecoin will reject this supply zone and move lower, or will buyers finally break above $46.00? Share your analysis below!
#LTCUSDT #Litecoin #Crypto #TradingView #TechnicalAnalysis #PriceAction #SupplyAndDemand #SupportAndResistance #CryptoTrading #Bearish #SwingTrading #RiskManagement #MarketAnalysis
LTC USDT LONG SIGNAL#90 LTC/USDT – Trade Setup (LONG)
📈 Position Type: LONG
🕒 Timeframe: 1H
📊 Market: Futures
💰 Entry Zone:
45.96
44.53
🛑 Stop-Loss:
43.88
🎯 Take-Profit Targets:
• TP1: 47.09
• TP2: 48.13
• TP3: 49.30
• TP4: 51.30
⚙️ Leverage:
5 *10
▫️ After TP1, move SL to Entry + 0.2%.
▪️ Exit Plan:
• 40% at TP1
• 20% at TP2
• 20% at TP3
20% at. TP4
📌 Risk Management:
Risk only 1–2% of your capital per trade.
⚠️ Always check and confirm the setup on your chart before entering the trade.
LTCUSDT 1D#LTC is trading within a falling wedge pattern on the daily timeframe. Consider accumulating a small position at the current level and adding near key support zones. A confirmed breakout above the wedge resistance could drive the price toward the following upside targets:
🎯 $51.52
🎯 $58.07
🎯 $63.37
🎯 $68.67
🎯 $76.21
🎯 $85.82
⚠️ Always use a tight stop-loss and apply proper risk management.
LTC to 50$?after the pair breakout the last wide range in the 30 min timeframe the LTC may continue up to get 50$, but the pair must break the 47.89 with high bearish volume. but if we see the volume shrinking after break out and the price break the RP 30 min and start correcting below it. the LTC may fall down to get new daily lower low
LTC/USDT (4h) Testing an Inverse Head and Shoulders BreakoutLTC/USDT is testing the neckline of an inverse head and shoulders pattern on the 4H chart, signaling a potential bullish reversal.
A confirmed close above the 46.40 USDT neckline could open the way toward the measured target near 53.70 USDT. Rejection and a move back below the neckline would weaken the setup, while losing the right-shoulder area would invalidate it.
$LTC: Bears Continue to Defend Initial ResistanceInitial Resistance Still Holding
Litecoin has pushed back into the $46.00 resistance area, but sellers continue to defend it. Price is also testing the 50-day EMA, adding further confluence to this zone.
Bulls Need a Clear Breakout
A convincing move above $46.00 would improve the short-term structure and shift attention towards the next resistance zone around $50.00-$50.50. Until then, the recent recovery remains vulnerable to another rejection.
Support Remains Important
The first key support sits around $42.90, where buyers recently stepped in. Holding this level would keep the short-term range intact and give bulls another opportunity to challenge resistance.
Downside Risk Remains
A break below $42.90 would weaken the current recovery and increase the likelihood of a move back towards the recent lows around $39.30. The preceding downtrend means the bears still retain a slight technical advantage.
Momentum Offers Little Clarity
RSI remains close to 50, showing neither side has established clear control. StochRSI is approaching overbought territory, which may make an immediate breakout more difficult without stronger buying pressure.
In Summary
Litecoin continues to test the $46.00 resistance area, but sellers remain in control of this level for now. A breakout would shift attention towards $50.00-$50.50, while rejection keeps $42.90 in focus as the first support. With momentum largely neutral and the preceding trend still down, bulls need a convincing move above resistance before the short-term picture begins to improve.
Is Litecoin About to Explode?Yello Paradisers! What if the recent pullback was never bearish at all, but simply the final shakeout before Litecoin starts its next impulsive rally?
💎#LTCUSDT continues to respect a textbook Wyckoff Accumulation structure. After printing a Selling Climax, Automatic Rally, Secondary Test, and a successful Spring, the market has now formed a Last Point of Support (LPS) followed by a Backup to the Last Point of Support (BU/LPS). This is typically where stronger market participants quietly absorb the remaining supply while weaker hands exit their positions.
💎Price is currently holding inside a key demand zone around $42.80-$41.00, which also aligns with the rising trendline that has been supporting the entire recovery. As long as this demand area remains intact, the overall bullish structure stays valid despite the short-term volatility.
💎The first obstacle for the bulls sits around $46.00, where horizontal resistance intersects
with the descending trendline. A decisive breakout above this confluence would confirm a Break of Structure and significantly increase the probability of continuation toward the next internal resistance around $52.50. If momentum remains strong, Litecoin could eventually challenge the major resistance zone between $56.50 and $57.00, where a larger reaction would become more likely.
💎On the other hand, losing the demand zone would weaken the current accumulation scenario. A breakdown below the major support around $39.30, followed by a move under $38.30, would invalidate this bullish outlook and suggest that the market needs more time before any sustained upside can develop.
🎖 Strive for consistency, not quick profits. Treat the market as a businessman, not as a gambler.
MyCryptoParadise
iFeel the success🌴
LTC 6H – Rising Trendline Holding as Price Tests ResistanceLTC on the 6H timeframe is currently trading around 44.96 after recovering steadily along a rising trendline from the late June low near 40.00, with price now pressing into the 44.80–45.50 horizontal resistance zone that has capped the structure twice since early July.
The chart shows a rising trendline originating from the June 25 low near 40.00, connecting the June 30 higher low near 41.30 and the July 13 touch near 43.40 before price pushed higher again. That trendline has been the backbone of the recovery across the entire visible structure, with each pullback finding support at or near it before bouncing. Price pushed through the 44.80–45.00 horizontal level on July 4–5 reaching a high near 45.80–46.00 before pulling back, then recovered again into the same zone on July 10 where it stalled near 44.80–45.50 before another leg lower brought it back to the trendline on July 13 near 43.40. The current candle shows price breaking back above 44.80–45.00 following that trendline hold, now pressing into the 44.80–45.50 resistance zone for a third time. A secondary horizontal level near 45.30–45.50 sits just above as the upper boundary of the resistance cluster.
Price has now tested the trendline three times without a breakdown and is back pressing into resistance, with each trendline hold producing a stronger bounce, suggesting accumulating momentum behind the recovery structure.
Key Levels To Watch
→ 45.80–46.00 – Prior spike high, resistance above
→ 45.30–45.50 – Upper horizontal resistance, secondary level
→ 44.80–45.00 – Horizontal pivot, current test
→ 44.20–44.40 – Minor support, mid-range reference
→ 43.40–43.80 – Rising trendline, dynamic support (climbing)
→ 42.00–42.60 – Prior trendline touch zone, support below
→ Below 41.30 – Trendline breakdown, recovery structure at risk
A confirmed 6H close above 45.30–45.50 would clear the full resistance cluster and open a move toward the prior spike high near 45.80–46.00 and potentially above it on continuation, with the rising trendline continuing to support the structure from below.
A rejection at 44.80–45.50 and a return toward the rising trendline near 43.40–43.80 would keep the range intact, but a confirmed close below the trendline would break the structure that has supported every low since late June and expose price to a move toward 42.00–42.60 and below.
Third test of resistance after repeated trendline holds, momentum building from below. Break above 45.30–45.50 → resistance cleared, eyes on 46.00 and above. Reject here and lose trendline near 43.40 → recovery over, downside toward 42.00–42.60. Bias bullish above rising trendline. Shift only on confirmed close below 43.40–43.80.
LTC USDT SHORT SIGNAL# 67 LTC./USDT – Trade Setup (SHORT)
📈 Position Type: SHORT
🕒 Timeframe: 1 H
📊 Market: Futures
💰 Entry Zone:
44.55
🛑 Stop-Loss:
46.26
🎯 Take-Profit Targets:
• TP1: 43.48
• TP2: 42.33
• TP3: 40.91
• TP4: 39.49
TP5:
TP6:
⚙️ Leverage:
5- 10
⚠️ After reaching TP1, move Stop-Loss to Entry Price.
📌 Risk Management:
Risk only 1–2% of your capital per trade.
Always confirm the setup on your chart before entry
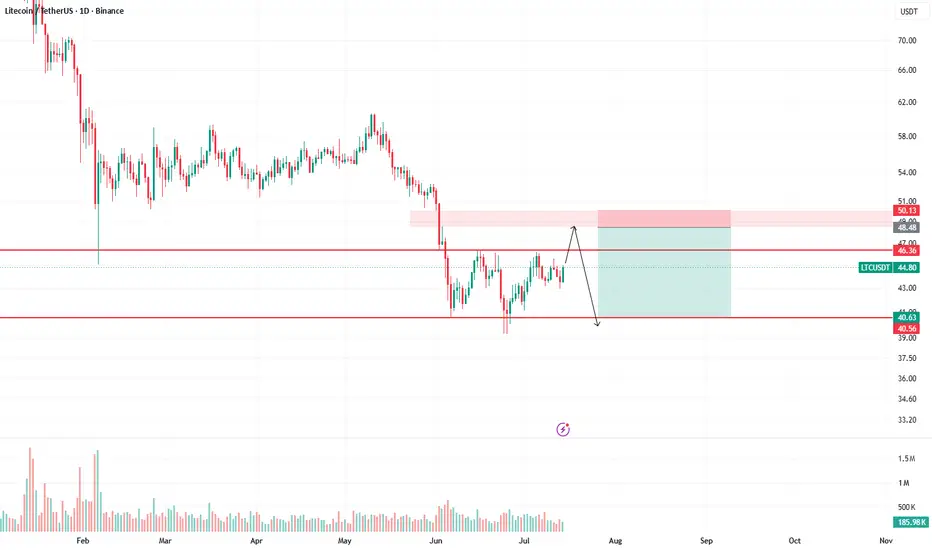
LTCUSDT - Bear Flag, Will Support Hold or Collapse?📈🔍 Technical Analysis – LTC/USDT (1D)
💰 Coin: NYSE:LTC #LTC
⏳ Time Frame: 1D
📉 Pattern: 🐻 Bear Flag
🎯 Bias: 🔴 Bearish Continuation
Litecoin is currently forming a 🐻 Bear Flag pattern on the 1D timeframe, one of the most common 📉 bearish continuation patterns that typically develops after a sharp sell-off (🚩 Flagpole). Following the strong downward impulse, the price has been moving gradually higher within an ascending channel (📈 Flag), indicating that this rally is more likely a 🔄 retracement rather than a trend reversal.
📌 From a technical perspective, this pattern suggests that 🐻 sellers remain in control, as long as the price fails to break above the 🚧 major resistance at the upper boundary of the channel.
---
📐🐻 Bear Flag Pattern Overview
🔻🚩 Flagpole
📉 A sharp decline from approximately $51 to $39 created the Flagpole, reflecting strong selling pressure.
⚠️ This impulsive move serves as the foundation of the Bear Flag pattern.
📈🏳️ Flag
🔄 After the sharp drop, the price began consolidating within an ascending channel, forming the Flag.
📊 This upward movement represents a temporary consolidation or retracement, rather than a complete trend reversal.
⚠️ In technical analysis, a 🐻 Bear Flag is typically confirmed once the price 📉 breaks below the lower trendline, signaling a continuation of the previous downtrend.
---
🟢🚀 Bullish Scenario
✅ A bullish outlook becomes more likely if:
🟢 The price 🚀 breaks above the upper trendline of the Bear Flag with increasing trading volume.
🟢 It successfully reclaims the 🟨 resistance zone (yellow block) around $48.5–$50 and turns it into new support.
🟢 A confirmed breakout could open the door for a continuation toward higher resistance levels.
⚠️ Until a valid breakout occurs, the current upward movement should still be viewed as a 🔄 retracement within a broader bearish trend.
---
🔴📉 Bearish Scenario
🚨 The bearish scenario remains the primary outlook on this chart.
Bearish confirmation becomes stronger if:
❌ The price fails to break above the 🚧 channel resistance.
❌ A 🔻 rejection occurs near the upper trendline of the Bear Flag.
❌ The price 📉 breaks below the lower trendline, confirming the 🐻 Bear Flag pattern.
🎯 If a breakdown occurs, the nearest downside targets are:
🎯 🟡 Support 1: $40.80
🎯 🟡 Support 2: $39.30
⚠️ If these support levels fail to hold, selling pressure could accelerate, following the projected Bear Flag continuation pattern.
---
📌📝 Conclusion
📍 Litecoin is still trading within a 🐻 Bear Flag formation, meaning the overall market structure remains 🔴 bearish.
📉 As long as the price stays below the 🚧 channel resistance and no valid 🚀 breakout is confirmed, traders should remain cautious of a potential 💥 breakdown that could send the price back to retest key support levels.
⚠️ Always wait for price action confirmation before making any trading decisions, and never forget to apply proper risk management. 🛡️📊
---
#LTCUSDT #Litecoin #LTC #BearFlag 🐻 #TechnicalAnalysis 📊 #CryptoAnalysis #CryptoTrading 📈 #TradingView #Altcoins #Support #Resistance #PriceAction #ChartPattern #CryptoMarket #Bearish #SwingTrading #CryptoSignals #MarketAnalysis #DYOR 🚀
This Could Be Litecoin (LTC) Price Most Important Week of 2026* The LTC price is testing a key resistance trendline ahead of a potential breakout.
* The LTC price is above the 4-hour SMA 100, with RSI favoring buyers.
* Litecoin's 2027 halving and Q4 2026 LitVM launch remain key catalysts to watch.
Litecoin is approaching what could become its most important technical test of 2026. After recovering from last year's sharp sell-off, the LTC price is now pressing against a long-term descending resistance trendline that has rejected every major recovery attempt so far.
We had a look at the LTC charts, and the shorter timeframes are becoming increasingly constructive. The LTC price is trading around 4.1% above its 4-hour 100-period simple moving average at $45.26, while the 4-hour RSI has climbed to 53.74, showing buyers remain in control without the market becoming overbought.
The daily chart is also beginning to improve. RSI has recovered to 61.05 and continues printing higher lows even as the LTC price previously made lower lows, creating a bullish divergence that often appears before larger trend reversals. Even so, Litecoin still needs to reclaim the 100-day SMA near $49.52 to strengthen the broader bullish case.
Beyond the charts, several long-term catalysts are getting closer. Litecoin's next halving is scheduled for July 2027, while LitVM's expected Q4 2026 mainnet launch could introduce EVM-compatible smart contracts and expand Litecoin beyond its traditional payments role. On-chain data also shows market conditions stabilizing after months of heavy selling, with the LTC price continuing to hold the $35-$47 range.
Meanwhile, CoinCodex's one-month forecast places the LTC price at $46.45, pointing to a largely neutral outlook while Litecoin attempts to break one of its most important resistance levels of the year.
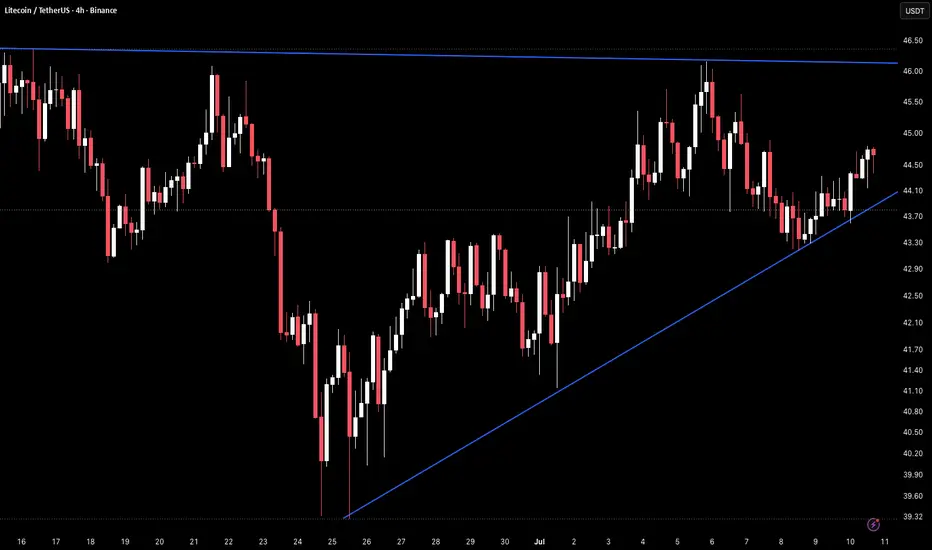
LTC 4H – Rising Trendline Holding Below Horizontal ResistanceLTC on the 4H timeframe is currently trading around 45.81 after recovering sharply from the late June low near 39.32 along a rising trendline, with price now consolidating just below the 46.00–46.50 horizontal resistance zone that has capped the structure since mid-June.
The chart shows price ranging between 43.70–44.80 through mid-June before selling off sharply on June 24–25, dropping to a low near 39.32 before reversing. A rising trendline formed off that low, connecting the June 25 bottom through the June 29 higher low near 41.10 and continuing to climb steeply into the current price area near 43.70–44.10. That trendline has been the backbone of the entire recovery, with each pullback finding support at or near it before bouncing. Price pushed through the 43.70–44.10 horizontal zone that previously acted as support in mid-June and reached up toward 46.00 on July 5 before pulling back. The 46.00–46.50 level represents the prior range highs visible across the left side of the chart and has now rejected price twice, including the July 5 attempt which closed back below it.
Price is currently sitting between the rising trendline below near 43.70–44.10 and the 46.00–46.50 resistance above, with the trendline continuing to climb and narrowing the gap between the two levels.
Key Levels To Watch
→ 46.00–46.50 – Horizontal resistance, prior range highs, current ceiling
→ 44.50–44.80 – Minor resistance, mid-range pivot
→ 43.70–44.10 – Horizontal support and rising trendline overlap, key level
→ 42.50–42.90 – Secondary support below trendline
→ 41.10–41.40 – Prior trendline touch, support zone
→ 39.32–39.60 – June low, full retracement target on breakdown
A confirmed 4H close above 46.00–46.50 would clear the only resistance capping the recovery and open a move toward 48.00–49.00 and beyond, with the rising trendline continuing to support the structure from below.
A break below the rising trendline near 43.70–44.10 and a loss of that level on a confirmed 4H close would remove the backbone of the recovery, exposing price to a move back toward 41.10–41.40 and potentially a full retest of the June low near 39.32–39.60.
Recovery structure intact with rising trendline holding below key resistance. Break above 46.00–46.50 → resistance cleared, upside opens toward 48.00–49.00. Lose trendline near 43.70–44.10 → recovery over, retest of 39.32–39.60 open. Bias bullish above rising trendline. Shift only on confirmed close below 43.70–44.10.
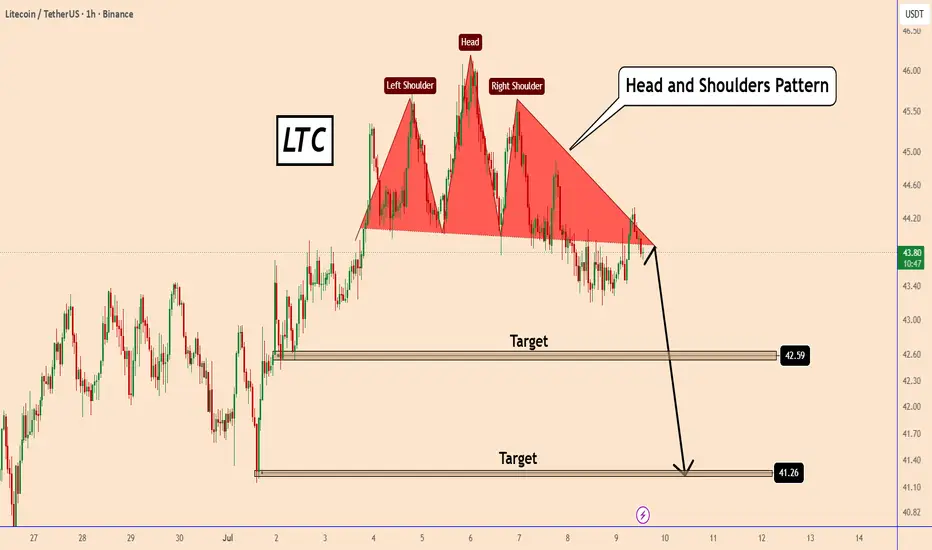
Litecoin: Neckline Breakdown Could Extend the SelloffLitecoin: Neckline Breakdown Could Extend the Selloff
Litecoin has formed a classic Head & Shoulders pattern, a well-known bearish reversal structure that often signals the end of an uptrend.
Price is currently testing the neckline, and sellers appear to be defending this level.
A confirmed 1-hour candle close below the neckline would strengthen the bearish outlook and increase the probability of a move toward the measured downside targets.
The first support lies around 42.59, where buyers may attempt to slow the decline. If bearish momentum remains strong, the next key target sits near 41.26, aligning with a previous demand zone.
Targets:
🎯 Target 1: 42.59
🎯 Target 2: 41.26
You can find more details on the chart.
Thank you and good luck! 🍀
⚠️PS: Do your own analysis and use your own strategy to join the trade.
❤️ If this analysis helps your trading day, please support it with a like or comment ❤️
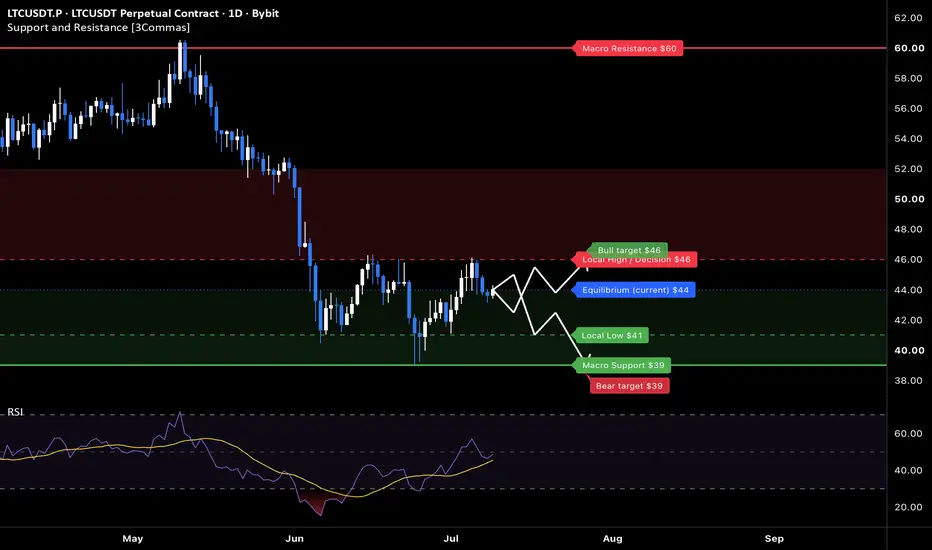
LTC: recovery range toward the $46 capThe Macro Picture 🗺️
LTC broke down hard from its $60 May peak, and the June flush to $39 marked the capitulation low — a liquidity sweep that dragged RSI into oversold before buyers stepped in. Since then price has rebuilt structure into a range between the $39 macro floor and the $46 local cap, rotating around the $44 equilibrium. RSI has recovered back above its midline, confirming the sweep was a bottom rather than the start of a fresh leg down. The macro trend is still repairing, but a defended floor and a tightening range point to accumulation over continuation.
The Setup ⚙️
The Floor: The $39 macro support (solid green) absorbed the June capitulation and stacks under the $41 local low to form a high-confluence demand shelf. As long as daily closes hold above it, the recovery structure stays valid.
The Ceiling: The $46 local decision (red dashed) caps the range. A decisive daily close above it would break the base and put the heavier $52 supply band — and eventually the $60 macro top — back in view.
The Range Play: The $41–$44 band creates a structural playground for grid-based accumulation — mechanical entries stacked across the range while price rotates, no directional call required until the break confirms.
The Roadmap: Primary target sits at $46 — the green roadmap points toward a rotation to the range ceiling as buyers defend the floor. Invalidation: a sustained 1D close below $39 would break the base and reopen the downtrend toward fresh lows.
More setups in profile.
Litecoin (LTC): 4 Years Support & Extreme Opportunity Buy-Zone Litecoin looks great. Long-term double-bottom, long long-term higher low & a four years long support zone is now being tested, so far it holds.
Good afternoon my fellow Cryptocurrency trader, I hope you are having a wonderful day.
Litecoin looks good as the trading is happening right above the previous bear-market bottom, $40 in June 2022. In June 2026, we have a low of $39. This is the long-term double-bottom.
After June 2022 LTCUSDT grew within a wide sideways channel until December 2024. We experienced a bullish cycle but not a full blown bull market, long-term consolidation has been happening on this project for the past four years.
Resistance, the upper-boundary of the channel, was challenged then support. With the confirmation of support we get a new market phase. Thinking of Bitcoin's four years cycle and the previous bull market, 2020-2021, we can expect the next market phase to result in a full blown bull market, the first one in six years and this can result easily in a new all-time high—years of growth.
Litecoin looks good. The best time to buy is when prices are low, when the action is happening at support, meaning now. Litecoin is a great buy as it trades within an extreme opportunity buy-zone. We can expect sustained growth from now on.
It can take several weeks or months before bullish momentum fully intensifies. Patience is key.
Namaste.
Litecoin LTC price analysis CRYPTOCAP:LTC continues to trade inside a long corrective consolidation.
And the longer this range lasts, the more interesting the chart becomes.
Looking at the long-term history of OKX:LTCUSDT , it's hard to imagine #Litecoin staying below the $34–36 zone for long.
Could we see a quick liquidity sweep below it?
Absolutely.
But a sustained breakdown still looks unlikely to us.
📈 If buyers continue defending key support, the first major target remains around $55.
The next real challenge comes at $68.
A successful breakout and consolidation above that level could open the door toward $135–145 over the longer term.
🤔 Now let's look at the fundamentals.
🔹 #Litecoin is one of the oldest blockchain networks, running since late 2011.
🔹 It processes over 180,000 transactions per day, with roughly $9–10B in daily transaction volume while its market cap sits at only about $3.5B.
🔹 Fast 2.5-minute block times, very low fees, and a Bitcoin-like monetary policy with halvings every four years.
🔹 More than 93% of the total 84 million CRYPTOCAP:LTC supply has already been mined.
😉 One more thing stands out.
The last major #Litecoin rally happened back in 2020–2021.
Since then, the market has spent years consolidating.
Yet miners continue securing the network and accumulating coins.
Makes you wonder...
Do they know something the market hasn't priced in yet?
💬 What do you think — is #Litecoin quietly preparing for another major cycle, or has the market already moved on?
______________
◆ Follow us ❤️ for daily crypto insights & updates!
🚀 Don’t miss out on important market moves
🧠 DYOR | This is not financial advice, just thinking out loud
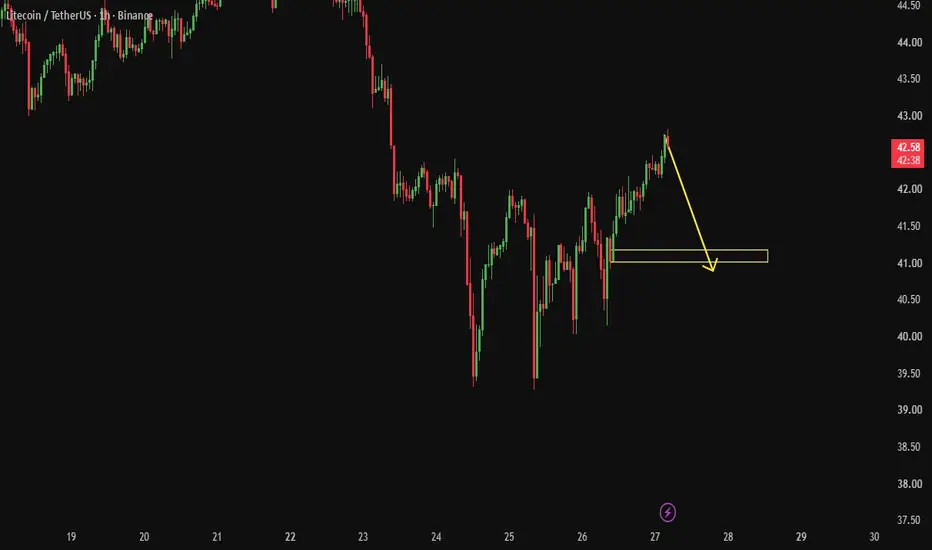
LTC/USDT - Support Breakdown/ Short Setup👋 Hey everyone! Hope you're all having a great day. Let's dive into today's LTC analysis.
📊 LTC/BTC is showing bearish structure, adding confluence to the bearish bias on LTC.
We had a resistance level that later flipped into support, and price reacted to it three times, confirming its strength as a key level.
🎯 On the 1H timeframe, we finally broke down below this level, followed by a pullback (retest) back to it. Right now, we're seeing a rejection candle where buyers are losing strength and getting overpowered by sellers — a solid confirmation for a short entry.
🎯 Trade Setup:
Direction: Short
Entry: 43.94
Stop Loss: 44.26
Target 1: 43.18
📍 Key level:
Flipped support/resistance: ~43.94–44.26 zone
💬 What's your take on LTC? Drop your thoughts below.
🔔 Follow for daily setups like this.
LTC 4H – Descending Channel Breakdown Below Horizontal SupportLTC on the 4H timeframe is currently trading around 52.39 after breaking down from a descending channel and losing the key horizontal support near 41.80–42.20, with price now attempting a recovery back into that broken level from below.
The chart shows a descending channel formed from the late May high near 53.00, with a declining upper trendline connecting successive lower highs and a rising lower trendline that caught the early June low near 38.50–39.00 before price recovered back into the structure.
The horizontal level near 41.80–42.20 acted as a consistent pivot through mid-June, holding as
support during the recovery that pushed price back toward 45.50–46.00 before rolling over again. The descending upper trendline rejected that recovery cleanly near 45.50–46.00 and price sold off sharply, broke beneath the 41.80–42.20 horizontal, and dropped toward the lower channel boundary near 39.00–39.50 before bouncing. Price is now back inside the channel and pressing directly into the 41.80–42.20 broken support from below.
The 41.80–42.20 level has now flipped from support to resistance and the descending trendline continues to push lower overhead, leaving price caught between two converging layers of resistance with no confirmed reclaim yet.
Key Levels To Watch
→ 52.00–53.00 – May high, major resistance above
→ 48.00–49.00 – Prior consolidation zone, resistance
→ 45.50–46.00 – Prior recovery high, trendline rejection zone
→ 43.00–43.50 – Descending trendline, current overhead resistance (dynamic)
→ 41.80–42.20 – Broken horizontal support, now resistance
→ 39.00–39.50 – Lower channel boundary, recent bounce zone
→ Below 38.50 – Channel breakdown, extended downside
A reclaim of 41.80–42.20 on a confirmed 4H close and a subsequent break above the descending trendline near 43.00–43.50 would signal a structural recovery, reopening the path toward 45.50–46.00 and potentially 48.00–49.00 on continuation.
A rejection at 41.80–42.20 and failure to reclaim the broken horizontal would keep the bearish structure intact, leaving price vulnerable to another leg lower toward the channel boundary near 39.00–39.50 and a potential full breakdown below 38.50 on a confirmed close beneath it.
Recovery attempt pressing into broken support from below, descending trendline above adding further compression. Reclaim 41.80–42.20 and break trendline → recovery toward 45.50–46.00. Reject here → another leg lower toward 39.00–39.50. Bias bearish below 41.80. Shift only on confirmed reclaim with trendline break above 43.00.