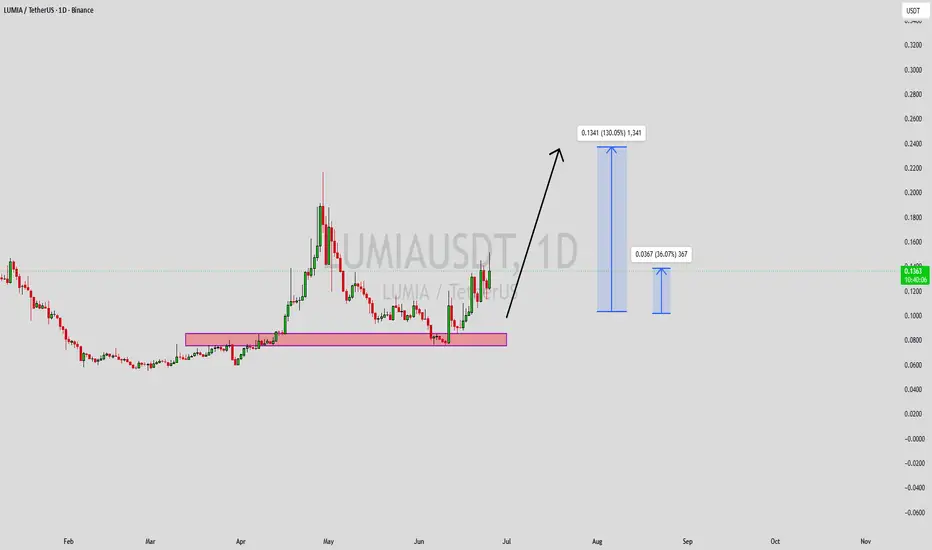
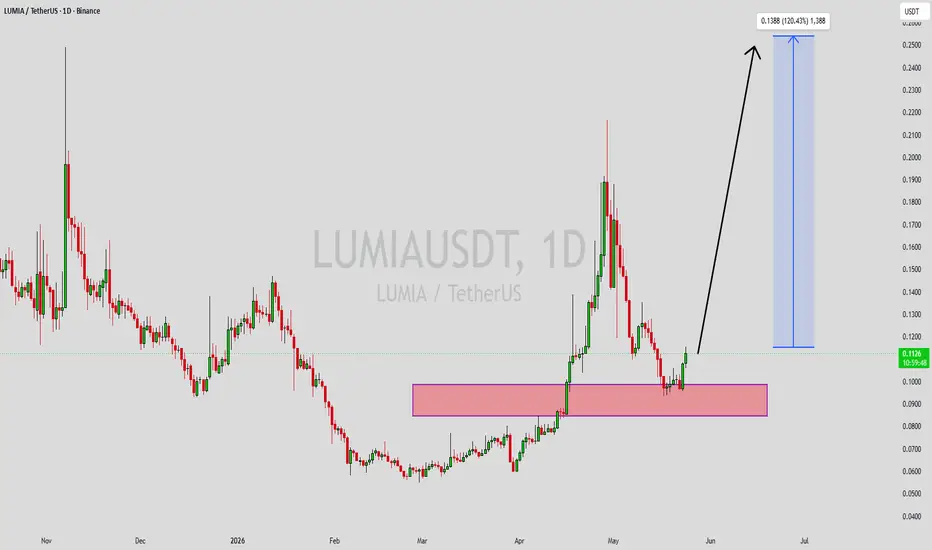
#LUMIAUSDT It can go up from this zone#LUMIA
The price is moving within a descending channel on the 1-hour timeframe and has reached the lower boundary. It is now poised for a bounce and is expected to retest this boundary.
The Relative Strength Index (RSI) indicates a downward trend, which is likely to continue given the overbought c
LUMIA/USDT (4h) Consolidating Inside a Falling WedgeLUMIA/USDT is compressing inside a falling wedge on the 4H chart following an extended decline. Price is currently holding near the lower part of the structure.
A confirmed breakout above the descending resistance could signal a bullish reversal. A breakdown below the lower trendline would invalida
LUMIAUSDT: Resistance Holds as Bears Target Lower SupportLUMIAUSDT is trading below a well-defined resistance zone after failing to regain bullish momentum. The recent rejection reinforces the sequence of lower highs, suggesting sellers continue to control the short-term trend.
As long as 0.06682 remains overhead resistance, the path of least resistance
LUMIAUSDT Forming Falling WedgeLUMIAUSDT is forming a clear falling wedge pattern, a classic bullish wave signal that often indicates an upcoming breakout. The price has been consolidating within a narrowing range, suggesting that selling pressure is weakening while buyers are beginning to regain control. With consistent volume c
LUMIUSDT Forming Bullish MomentumLUMIAUSDT is forming a clear bullish momentum pattern, a classic bullish wave signal that often indicates an upcoming breakout. The price has been consolidating within a narrowing range, suggesting that selling pressure is weakening while buyers are beginning to regain control. With consistent volum
Lumia (Easy 900% explained)Why and how is 900% ($1.31) an easy target on this LUMIAUSDT chart?
It is very simple. This chart is already bullish and showing a full bottom recovery process. Let's review the whole sequence in order to reach our 900% goal.
The all-time low was established 8 months ago, October 2025. Here starts
LUMIAUSDT Forming Bullish MomentumLUMIAUSDT is forming a clear bullish momentum pattern, a classic bullish wave signal that often indicates an upcoming breakout. The price has been consolidating within a narrowing range, suggesting that selling pressure is weakening while buyers are beginning to regain control. With consistent volum
Lumia has 1,860% profits potential, growing since MarchIt has been preparing since late February 2026. Growing as part of a build-up process and recovery phase, but growth is growth.
LUMIAUSDT hit bottom October 2025 and you know the rest of the game. The same day of the flush everything was quickly bought only to result in a downtrend that ended with
LUMIAUSDT Forming Bullish MomentumHere’s your rewritten version in the same style:
LUMIAUSDT is forming a clear bullish momentum pattern, a classic bullish wave signal that often indicates an upcoming breakout. The price has been consolidating within a narrowing range, suggesting that selling pressure is weakening while buyers are
LUMIAUSDT Forming Bullish MomentumLUMIAUSDT is currently forming a clear bullish momentum pattern, a classic wave structure that often signals an upcoming breakout. The price has been consolidating within a narrowing range, indicating that selling pressure is gradually weakening while buyers are beginning to regain control. With con
See all ideas
Summarizing what the indicators are suggesting.
Oscillators
Neutral
SellBuy
Strong sellStrong buy
Strong sellSellNeutralBuyStrong buy
Oscillators
Neutral
SellBuy
Strong sellStrong buy
Strong sellSellNeutralBuyStrong buy
Summary
Neutral
SellBuy
Strong sellStrong buy
Strong sellSellNeutralBuyStrong buy
Summary
Neutral
SellBuy
Strong sellStrong buy
Strong sellSellNeutralBuyStrong buy
Summary
Neutral
SellBuy
Strong sellStrong buy
Strong sellSellNeutralBuyStrong buy
Moving Averages
Neutral
SellBuy
Strong sellStrong buy
Strong sellSellNeutralBuyStrong buy
Moving Averages
Neutral
SellBuy
Strong sellStrong buy
Strong sellSellNeutralBuyStrong buy
Displays a symbol's price movements over previous years to identify recurring trends.