#LUMIAUSDT It can go up from this zone#LUMIA
The price is moving within a descending channel on the 1-hour timeframe and has reached the lower boundary. It is now poised for a bounce and is expected to retest this boundary.
The Relative Strength Index (RSI) indicates a downward trend, which is likely to continue given the overbought conditions.
There is a key support zone in green at 0.06234, and the price has bounced off this zone several times, making it a strong support level.
The price is trending towards the 100-period moving average, which we are approaching. This trend supports an upward move.
Entry Price: 0.06685
Target 1: 0.06796
Target 2: 0.06930
Target 3: 0.07115
Stop Loss: At the resistance zone in green
Remember this simple rule: Money management.
Any questions? Please leave a comment.
Thank you.
In-depth trading ideas
LUMIA/USDT (4h) Consolidating Inside a Falling WedgeLUMIA/USDT is compressing inside a falling wedge on the 4H chart following an extended decline. Price is currently holding near the lower part of the structure.
A confirmed breakout above the descending resistance could signal a bullish reversal. A breakdown below the lower trendline would invalidate the setup and favour further downside.
LUMIAUSDT: Resistance Holds as Bears Target Lower SupportLUMIAUSDT is trading below a well-defined resistance zone after failing to regain bullish momentum. The recent rejection reinforces the sequence of lower highs, suggesting sellers continue to control the short-term trend.
As long as 0.06682 remains overhead resistance, the path of least resistance favors the downside. A sustained rejection from the current area could drive price toward 0.06370, while a confirmed breakout above resistance would invalidate the bearish setup and signal weakening selling pressure.
Trade Setup
Entry: 0.06596
Target: 0.06370
Stop Loss: 0.06682
I'll wait for confirmation that sellers continue defending resistance before expecting the next leg lower. A break above 0.06682 would invalidate this bearish trade idea.
LUMIAUSDT Forming Falling WedgeLUMIAUSDT is forming a clear falling wedge pattern, a classic bullish wave signal that often indicates an upcoming breakout. The price has been consolidating within a narrowing range, suggesting that selling pressure is weakening while buyers are beginning to regain control. With consistent volume confirming accumulation at lower levels, the setup hints at a potential bullish breakout soon. The projected move could lead to an impressive gain of around 140% to 150% once the price breaks above the wedge resistance.
This falling wedge pattern is typically seen at the end of downtrends or corrective phases, and it represents a potential shift in market sentiment from bearish to bullish. Traders closely watching LUMIAUSDT are noting the strengthening momentum as it nears a breakout zone. The good trading volume adds confidence to this pattern, showing that market participants are positioning early in anticipation of a reversal.
Investors’ growing interest in LUMIAUSDT reflects rising confidence in the project's long-term fundamentals and current technical strength. If the breakout confirms with sustained volume, this could mark the start of a fresh bullish leg. Traders might find this a valuable setup for medium-term gains, especially as the falling wedge pattern completes and buying momentum accelerates.
✅ Show your support by hitting the like button.
✅ Leaving a comment below! (What is You opinion about this Coin)
Your feedback and engagement keep me inspired to share more insightful market analysis with you!
LUMIUSDT Forming Bullish MomentumLUMIAUSDT is forming a clear bullish momentum pattern, a classic bullish wave signal that often indicates an upcoming breakout. The price has been consolidating within a narrowing range, suggesting that selling pressure is weakening while buyers are beginning to regain control. With consistent volume confirming accumulation at lower levels, the setup hints at a potential bullish breakout soon. The projected move could lead to an impressive gain of around 90% to 100% once the price breaks above the wedge resistance.
This bullish momentum pattern is typically seen at the end of downtrends or corrective phases, and it represents a potential shift in market sentiment from bearish to bullish. Traders closely watching LUMIAUSDT are noting the strengthening momentum as it nears a breakout zone. Strong trading volume adds confidence to this pattern, showing that market participants are positioning early in anticipation of a reversal.
Investors’ growing interest in LUMIAUSDT reflects rising confidence in the project's long-term fundamentals and current technical strength. If the breakout confirms with sustained volume, this could mark the start of a fresh bullish leg. The current price structure suggests that buyers are steadily gaining control while bearish pressure continues to weaken.
Traders might find this a valuable setup for medium-term gains, especially as the bullish momentum pattern nears completion and buying momentum accelerates. A successful breakout could attract additional market attention and potentially push the price toward significantly higher levels over the coming weeks and months.
✅ Show your support by hitting the like button!
✅ Leave a comment below! (What is your opinion about this coin?)
Your feedback and engagement keep me inspired to share more insightful market analysis with you!
Lumia (Easy 900% explained)Why and how is 900% ($1.31) an easy target on this LUMIAUSDT chart?
It is very simple. This chart is already bullish and showing a full bottom recovery process. Let's review the whole sequence in order to reach our 900% goal.
The all-time low was established 8 months ago, October 2025. Here starts the bottom process, here the bearish potential of this project was revealed for the first time.
LUMIAUSDT moved within a downtrend until late February 2026 then started to recover. The first bullish move after the 24-February low broke the downtrend, the bearish chart structure. After this initial move was corrected, we ended up with a higher low in early June. Here we can draw a cup & handle pattern. We can also notice a perfect sequence of higher lows (June vs Feb vs Oct. 2025).
Trading volume has been rising recently as bullish action continues to intensify.
1) A downtrend that reached its end.
2) A full reversal pattern has been drawn on the chart.
3) Bullish action is now the dominant trend.
4) LUMIA has been rising for months.
A continuation of all the same factors described above will give us a target first of $0.34, then $0.82 followed by $1.31 in the coming months, with plenty of room for this project to continue higher based on the long-term.
This is a solid chart setup, we can expect additional growth.
Thank you for reading.
Namaste.
LUMIAUSDT Forming Bullish MomentumLUMIAUSDT is forming a clear bullish momentum pattern, a classic bullish wave signal that often indicates an upcoming breakout. The price has been consolidating within a narrowing range, suggesting that selling pressure is weakening while buyers are beginning to regain control. With consistent volume confirming accumulation at lower levels, the setup hints at a potential bullish breakout soon. The projected move could lead to an impressive gain of around 90% to 100% once the price breaks above the resistance zone.
This bullish momentum pattern is typically seen at the end of downtrends or corrective phases, and it represents a potential shift in market sentiment from bearish to bullish. Traders closely watching LUMIAUSDT are noting the strengthening momentum as it nears a breakout zone. The healthy trading volume adds confidence to this pattern, showing that market participants are positioning early in anticipation of a reversal.
Investors’ growing interest in LUMIAUSDT reflects rising confidence in the project's long-term fundamentals and current technical strength. If the breakout confirms with sustained volume, this could mark the start of a fresh bullish leg. The current price structure suggests that buyers are gradually taking control while bearish momentum continues to weaken.
Traders might find this a valuable setup for medium-term gains, especially as the bullish momentum pattern completes and buying momentum accelerates. A confirmed breakout could attract additional market participation and potentially push the price toward significantly higher targets in the coming weeks.
✅ Show your support by hitting the like button!
✅ Leaving a comment below! (What is your opinion about this Coin?)
Your feedback and engagement keep me inspired to share more insightful market analysis with you!
Lumia has 1,860% profits potential, growing since MarchIt has been preparing since late February 2026. Growing as part of a build-up process and recovery phase, but growth is growth.
LUMIAUSDT hit bottom October 2025 and you know the rest of the game. The same day of the flush everything was quickly bought only to result in a downtrend that ended with a higher low. This higher low is the late February date and from here on out we are seeing green candles, a sequence of higher highs and higher lows.
A sequence of lower highs and lower lows led to the famous and frustrating market flush last year. The sequence of higher highs and higher lows will produce a famous and exciting bull run this year. It is the same but in reverse.
Exchanges get paid when the market is bullish as well as when the market is bearish, for them, it is all the same. It is not like they prefer down or up, they simply move the market in search for the bigger bucks. When everybody is bullish, the whales take profits and crash the market, selling to all those people waiting to buy. When everybody is bearish, the whales accumulate and buy everything propping the market up, buying from all those that are ready to sell at the bottom and low prices. We come in-between.
We buy when there is hype, excitement and greed. When prices start rising and sometimes even when it is already too late, we rush to buy and rejoice. When the market is at the top after growing for 3-5 months straight, we are ready to buy even more to hold and lose when the crash comes.
When the market is trading at the bottom or a higher low like today, we tend to ignore it and just go away. When the market trades at the bottom (Feb-May 2026) during the accumulation phase, we run away.
The market is trading at the bottom now and ready to grow. Who's buying? Will you buy?
We are getting very close. Crypto is going up.
Namaste.
LUMIAUSDT Forming Bullish MomentumHere’s your rewritten version in the same style:
LUMIAUSDT is forming a clear bullish momentum pattern, a classic bullish wave signal that often indicates an upcoming breakout. The price has been consolidating within a narrowing range, suggesting that selling pressure is weakening while buyers are beginning to regain control. With consistent volume confirming accumulation at lower levels, the setup hints at a potential bullish breakout soon. The projected move could lead to an impressive gain of around 90% to 100% once the price breaks above the wedge resistance.
This bullish momentum pattern is typically seen at the end of downtrends or corrective phases, and it represents a potential shift in market sentiment from bearish to bullish. Traders closely watching LUMIAUSDT are noting the strengthening momentum as it nears a breakout zone. The good trading volume adds confidence to this pattern, showing that market participants are positioning early in anticipation of a reversal.
Investors’ growing interest in LUMIAUSDT reflects rising confidence in the project’s long-term fundamentals and current technical strength. If the breakout confirms with sustained volume, this could mark the start of a fresh bullish leg. Traders might find this a valuable setup for medium-term gains, especially as the pattern completes and buying momentum accelerates.
✅ Show your support by hitting the like button
✅ Leaving a comment below! (What is your opinion about this coin?)
Your feedback and engagement keep me inspired to share more insightful market analysis with you!
LUMIAUSDT Forming Bullish MomentumLUMIAUSDT is currently forming a clear bullish momentum pattern, a classic wave structure that often signals an upcoming breakout. The price has been consolidating within a narrowing range, indicating that selling pressure is gradually weakening while buyers are beginning to regain control. With consistent volume supporting accumulation at lower levels, the setup suggests a strong potential for a bullish breakout in the near term.
If the price breaks above the wedge resistance, the projected move could be notable, with a potential gain of around 80% to 90%. This type of bullish momentum pattern is typically seen at the end of downtrends or corrective phases, signaling a possible shift in market sentiment from bearish to bullish.
Traders closely monitoring LUMIAUSDT are observing strengthening momentum as it approaches a key breakout zone. The presence of solid trading volume adds confidence to this setup, indicating that market participants may be positioning early in anticipation of a reversal.
Growing investor interest in LUMIAUSDT reflects rising confidence in its technical structure and overall potential. If the breakout is confirmed with strong and sustained volume, it could mark the beginning of a fresh bullish leg. This setup may present a valuable opportunity for medium-term traders as momentum builds and the pattern completes.
✅ Show your support by hitting the like button
✅ Leave a comment below (What is your opinion about this coin?)
Your feedback and engagement keep me motivated to share more insightful market analysis with you!
#LUMIA #LUMIA is currently testing the upper resistance of a falling wedge 🧐 pattern. The volume looks stable as the price consolidates 🤝 within the wedge formation. If #LUMIA breaks out, the next target is around 0.11800 level 🎯.
Breakouts from falling wedges can be explosive, so watch closely! 🤓
#LUMIA #crypto #trading #altcoins
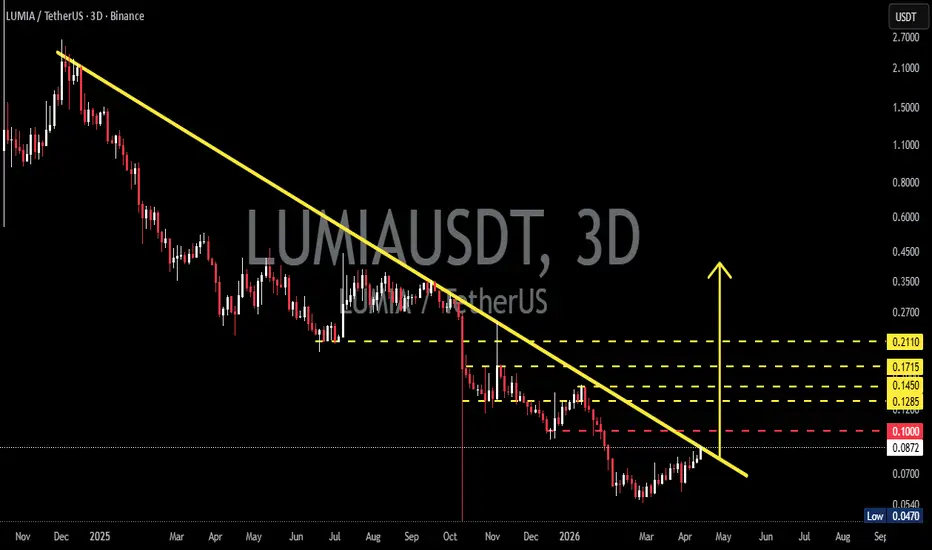
LUMIAUSDT — Start of a Reversal or Just a Retest?On the 3D timeframe, LUMIA/USDT is still within a strong downtrend structure, characterized by:
Consistent Lower Highs & Lower Lows
A descending trendline (yellow) acting as dynamic resistance
A sharp drop in October reinforcing bearish pressure
However, the current price action shows:
Price approaching the end of the trendline
Signs of a potential breakout
Formation of a base around the lower zone (0.05 – 0.08)
---
Structure & Patterns Identified
1. Descending Triangle / Falling Resistance
The yellow trendline represents descending resistance
Price has been consistently rejected from above
Typically a bearish continuation pattern, but can become an early reversal signal if a strong breakout occurs
2. Base Accumulation (Potential Bottoming)
After a sharp decline, price is moving sideways
Forming a strong support zone at the lows (0.047 – 0.06)
This may indicate accumulation by smart money
3. Breakout Setup
Price is currently testing the descending trendline
A breakout would confirm a potential market structure shift
---
Key Levels
Strong support: 0.047 – 0.060
Current demand zone: 0.070 – 0.090
Nearest resistance: 0.100
Next resistance / targets:
0.1285
0.1450
0.1715
0.2110
---
Bullish Scenario 🚀
Bullish confirmation occurs if:
1. Price breaks and closes above the descending trendline
2. Successfully breaks 0.100 resistance
3. Holds above it during a retest
Upside targets:
0.1285 (TP1)
0.1450 (TP2)
0.1715 (TP3)
0.2110 (TP4)
💡 This would indicate:
A shift from downtrend → uptrend
Potential mid-term reversal
---
Bearish Scenario 📉
Bearish momentum remains dominant if:
1. Price fails to break the trendline
2. Strong rejection occurs around 0.09 – 0.10
3. Price breaks back below 0.070
Downside targets:
0.060
0.047 (previous low)
💡 This suggests:
Downtrend remains intact
The breakout attempt is a fakeout / liquidity grab
---
Conclusion
LUMIA/USDT is at a critical decision zone — between:
Continuation of the downtrend
or
The beginning of a major reversal
The next move depends heavily on: 👉 Price reaction to the trendline and the 0.100 level
#LUMIAUSDT #CryptoAnalysis #TechnicalAnalysis #Altcoin #BreakoutSetup #TrendlineBreak #CryptoTrading #BullishScenario #BearishScenario #SmartMoney #Altcoins #MarketStructure
LUMIAUSDT 1D#LUMIA has broken above the descending channel on the daily chart. Enter this coin only if a successful retest occurs. The retest zone is roughly aligned with the daily EMA50, which is acting as support. In case of a successful bounce, the potential upside targets are:
🎯 $0.1059
🎯 $0.1357
🎯 $0.1599
🎯 $0.1840
🎯 $0.2183
🎯 $0.2620
⚠️ Always remember to use tight stop-losses and maintain proper risk management.
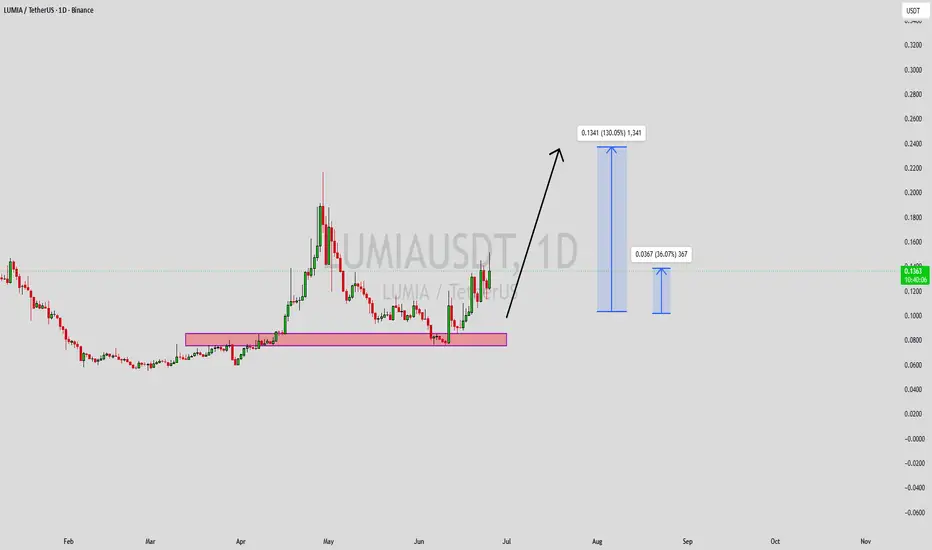
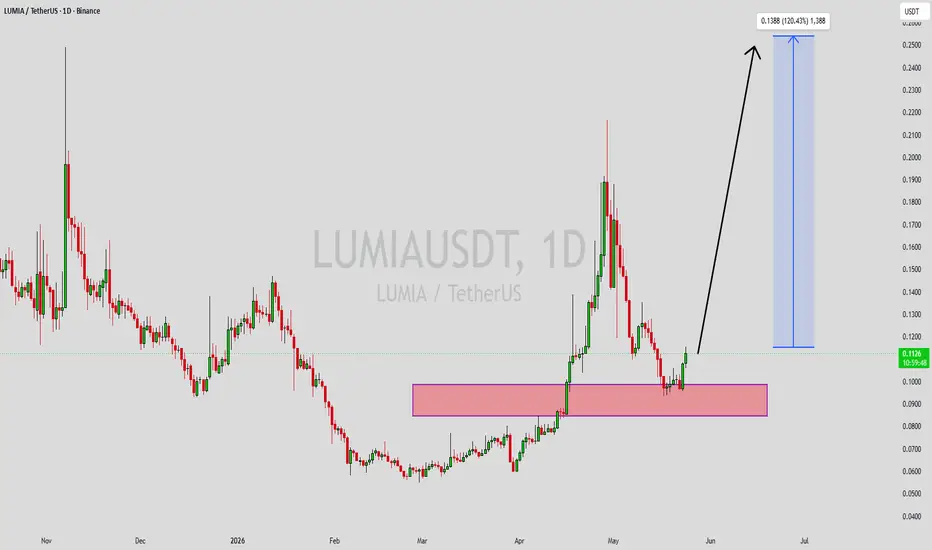
LUMIAUSDT Forming Bullish MomentumLUMIAUSDT is forming a clear bullish momentum pattern, a classic bullish reversal signal that often indicates an upcoming breakout. The price has been consolidating within a narrowing range, suggesting that selling pressure is weakening while buyers are beginning to regain control. With consistent volume confirming accumulation at lower levels, the setup hints at a potential bullish breakout soon. The projected move could lead to an impressive gain of around 190% to 200% once the price breaks above the wedge resistance.
This bullish momentum pattern is typically seen at the end of downtrends or corrective phases, and it represents a potential shift in market sentiment from bearish to bullish. Traders closely watching LUMIAUSDT are noting the strengthening momentum as it nears a breakout zone. The good trading volume adds confidence to this pattern, showing that market participants are positioning early in anticipation of a reversal.
Investors’ growing interest in LUMIAUSDT reflects rising confidence in the project’s long-term fundamentals and current technical strength. If the breakout confirms with sustained volume, this could mark the start of a fresh bullish leg. Traders might find this a valuable setup for medium-term gains, especially as the pattern completes and buying momentum accelerates.
✅ Show your support by hitting the like button and
✅ Leaving a comment below! (What is your opinion about this Coin?)
Your feedback and engagement keep me inspired to share more insightful market analysis with you!
Lumia · Easy 725% followed by 1,199% & 1,582% profits potential Lumia had no growth last year. The period between April - July 2025 failed to produce any type of growth. This was a support zone.
The chart starts with a down-move leading to support. No buyers showed up after months of sideways and this in turn leads to another drop. Keep in mind that at this same time last year many projects did manage to grow strongly, including Bitcoin and Ethereum hitting new all-time highs.
So LUMIAUSDT crashes down in order to build up strength; one year later, April 2026, the chart looks different.
Last year LUMIA printed lower highs and lower lows at support and this led to a breakdown. After the October 2025 all-time low, there is lots of activity and higher lows after February. The downtrend has been broken.
We can expect a change of trend. The first move or the start of the new market phase tends to be quite pronounced, it comes with a bang. See ENJ, CTSI or NMR. NMR has been producing sustained growth. Both CTSI and ENJ started with big green and the highest volume. Just some examples. Something similar can happen here.
One of the best examples is still TRX. The chart looks like a major jump is about to show up next. All the loses from the October 2025 crash have been recovered, almost. And Tron tends to move before the rest of the market. The other projects can follow, big and small.
We are going up next. Just the first target for LUMIAUSDT based on Fibonacci extension opens up 725% profits potential, that's $0.66. More is possible at higher prices.
Remember, everything can change in a matter of days. This bullish move has been in the making for half a year, six months. Don't be surprised when the first move produces 300% in a matter of days.
Namaste.
#LUMIA #LUMIA has broken out of a falling wedge pattern and is currently consolidating around 0.069 🧐. The falling wedge is a bullish reversal pattern 🐂 which suggests the price may continue upward. The next target for #LUMIA is around 0.082 🎯.
#LUMIA Don't get trapped by FOMO #crypto #trading #altcoin
LUMIAUSDT 15-02-26LUMIAUSDT 15-02-26
The price on the H4 timeframe appears to be at the previous high.
There are signs of decreasing volume on the candles.
When looking at the H1 timeframe, there is a double top,
and the price is starting to decline.
We'll try placing a pending sell order in the area of the last price drop.
LUMIAUSDT 1D#LUMIA is trading within a falling wedge pattern on the daily chart. Entry is recommended only after a solid breakout above the wedge resistance. If confirmed, the potential upside targets are:
🎯 $0.164
🎯 $0.186
🎯 $0.207
🎯 $0.238
🎯 $0.278
⚠️ Always apply tight stop-losses and maintain strict risk management.
LUMIA Main trend -91% Low/high zones 01/18/2025Logarithm. Time frame 3 days. Fresh cryptocurrency. This main trend of this cryptocurrency itself (the entire history of trades) acts as a secondary trend in meaning.
The legend of the utility-imitation of this cryptocurrency is the tokenization of assets. A very good idea for the future hype of this kind, especially if they will continue to hype the "American" HBAR.
The chart shows the zones (support/resistance horizontal and dynamic) of maximums and minimums for work.
Now, after breaking the logic of the descending wedge (all the price drop), the price went into sideways consolidation. The channel step and local levels are shown. If they draw an inverted head and shoulders with the price in the channel canvas (part is already there), then there will be an exit to % of its base up, just to one of the following designated resistance zones. If the market as a whole is negative, then from this consolidation there may be another wave of decline. The zones are shown in the idea.
The asset itself was dumped after a local listing pump by -91%, these are not the minimum values for assets of such liquidity. But, sometimes if the market as a whole looks bullish, then the trend of the wrapper is reversed, this is an acceptable decline, but not minimal. Consider this in your money management and work tactics.
LUMIA/USDT – Bullish FlagFor the past 50 days, LUMIA/USDT has been developing a bullish flag pattern one of the most powerful continuation structures in technical analysis. This setup often signals the market is preparing for its next major upward move.
Price action continues to protect the pattern and stabilize within the flag, showing that buyers remain in control and are absorbing supply. Once a breakout confirms, LUMIA could unleash significant upside momentum.
This is a textbook bullish continuation setup, making it difficult to ignore for traders anticipating the next expansion leg.
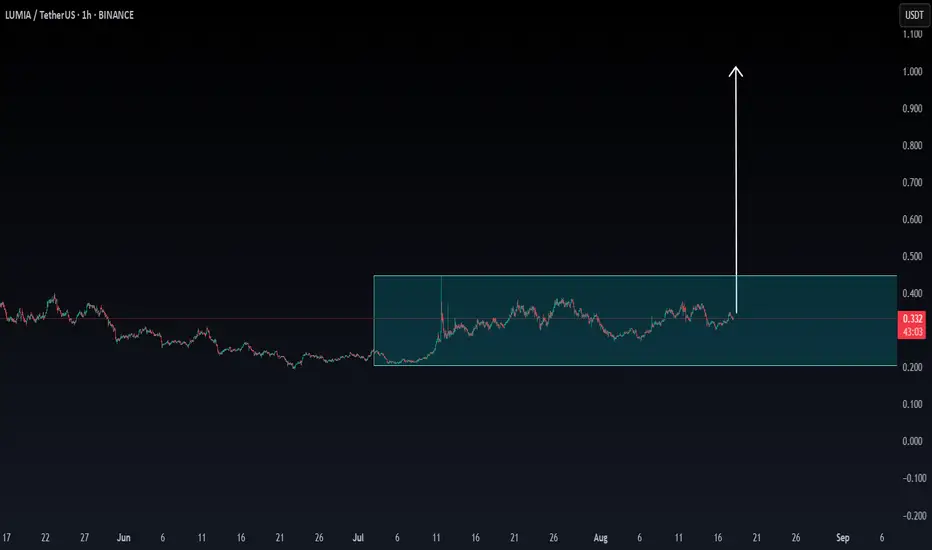
LUMIA/USDTLUMIA/USDT has shown strong bullish momentum, with the first leg printing over +100% gain—signaling early strength and buyer dominance. Over the past two weeks, price action has been consolidating in a tight re-accumulation phase, forming a healthy base just above previous resistance . This phase appears to be nearly complete, and the chart structure suggests it's gearing up for the next impulsive leg upward.
A break above the short-term range high with strong volume will likely confirm the continuation. We’ve marked the green box as the ideal entry zone, aligning with recent demand and structural support.