LUNA2/USDT: Long Setup — Accumulation Base Target +400% Terra 2.0 ( LSE:LUNA / $LUNA2) is building a multi-month consolidation floor near the **$0.045 – $0.048** demand zone. Early momentum divergence and volume absorption near macro lows indicate buyers are establishing positions, setting up a high-reward trend reversal toward major overhead resistance pools.
A clean, high-volume break over $0.0550 confirms buyer control and opens the path for a macro expansion run toward upper liquidity targets.
*(Educational analysis only. Always manage your ri
Terra / Tether
No trades
No trades
In-depth trading ideas
LUNA/USDT (1D) Testing a Breakout From a Symmetrical TriangleLUNA/USDT is consolidating inside a large symmetrical triangle on the 1D chart, with price forming lower highs beneath descending resistance while maintaining higher lows along the rising support. The structure has tightened considerably, and price is now testing the upper boundary around $0.046–$0.047.
A confirmed daily breakout and hold above the descending trendline could trigger a bullish expansion toward the $0.056–$0.058 target area. A rejection from resistance would keep the triangle act
LUNA/USDT (1h) Trading Inside a Descending ChannelLUNA/USDT continues to trade inside a well-defined descending channel on the 1H chart, maintaining a sequence of lower highs and lower lows. Price recently bounced from the lower part of the structure around $0.0430–$0.0435 and is now recovering toward the middle of the channel near $0.0441.
If buyers maintain momentum, price could retest the upper channel resistance around $0.0448–$0.0450. A confirmed breakout above the descending structure would signal weakening bearish momentum and could ope
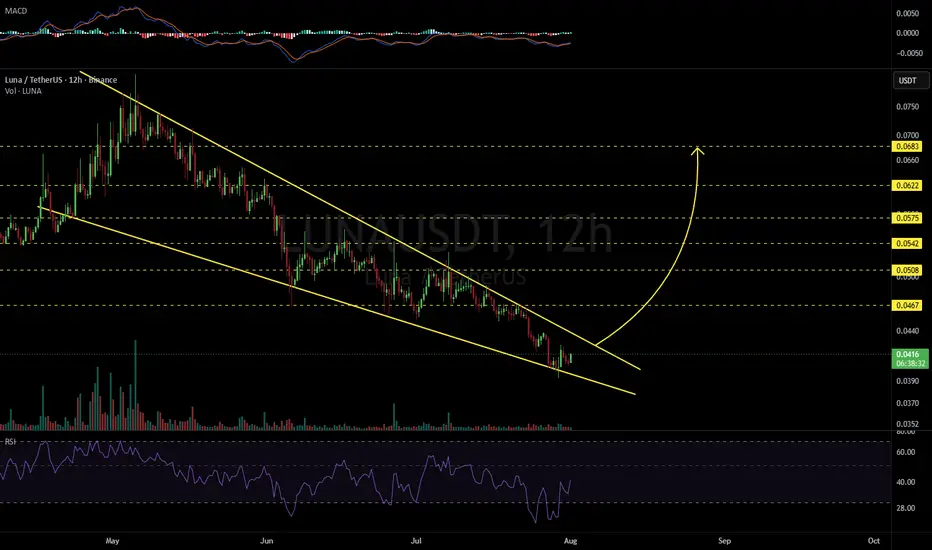
LUNAUSDT 12H#LUNA is trading within a falling wedge pattern on the 12H timeframe. Consider entering a position only after a confirmed breakout above the wedge resistance. If the breakout is confirmed, the potential upside targets are:
🎯 $0.0467
🎯 $0.0508
🎯 $0.0542
🎯 $0.0575
🎯 $0.0622
🎯 $0.0683
⚠️ Always remember to use a tight stop-loss and maintain proper risk management.
LUNAUSDT Forming Bullish MomentumLUNAUSDT is forming a clear bullish momentum pattern, a classic bullish continuation signal that often points toward a strong breakout in the near future. The price has been consolidating within a tightening range, suggesting that selling pressure is gradually weakening while buyers continue to regain control around key support levels. This type of setup is commonly associated with accumulation phases before a major bullish move begins.
The projected breakout from this bullish momentum structur
LUNAUSDT Forming Bullish MomentumLUNAUSDT is forming a clear bullish momentum pattern, a classic bullish wave signal that often indicates an upcoming breakout. The price has been consolidating within a narrowing range, suggesting that selling pressure is weakening while buyers are beginning to regain control. With consistent volume confirming accumulation at lower levels, the setup hints at a potential bullish breakout soon. The projected move could lead to an impressive gain of around 50% to 60% once the price breaks above the
LUNA 1H: Support-to-Resistance FlipPrice was squeezed into a triangle. It has now broken below the bottom support line, signaling a move down.
The Trend: The red line (Moving Average) is above the price, acting as a "ceiling" that keeps pushing it lower.
The Plan:
Entry: You are entering "Short" at $0.0594.
Stop Loss (Red): If it hits $0.0628, the trade failed; get out to protect your money.
Take Profit (Green): Your target is $0.0432, where you expect the price to land.
Bottom Line: You are betting the price will fall. The
LUNAUSDT – 4H Chart Analysis (Supply-based Short Setup)
BINANCE:LUNAUSDT is currently trading in a bearish market structure on the 4-hour timeframe, with price consistently forming lower highs and lower lows, confirming sustained selling pressure.
🔴 Key Technical Observations
Supply Zone: $0.0693 – $0.0731
Price will retrace into a well-defined supply (sell) zone, which previously acted as a strong rejection area. This zone is now acting as dynamic resistance, aligning with prior distribution.
VWAP Confluence:
The VWAP indicator is positioned a
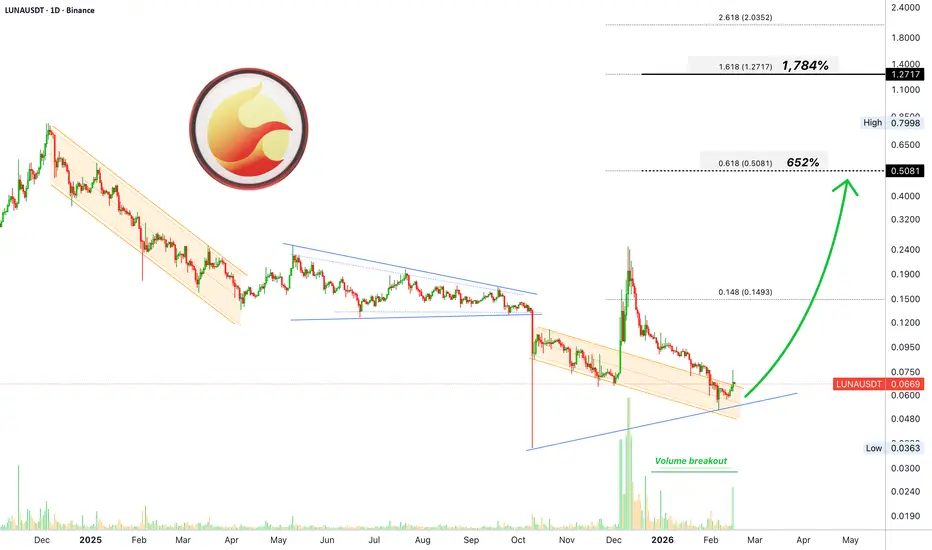
Terra (LUNA) —Second wave aims at $0.51 (652% profits potential)We have a very dynamic chart here. Resistance being challenged through a major jump, a rejection and lower low/higher low. A volume breakout opens new possibilities... A repeat of early December 2025, a new bullish phase.
Good evening God, how are you feeling today?
Godlike, love like, life like; alive and well. What about you?
The previous move in December ended as a double-top vs May 2025. Then we have this lower low and the start of a new bullish move.
Obviously, LUNAUSDT wasn't strong en
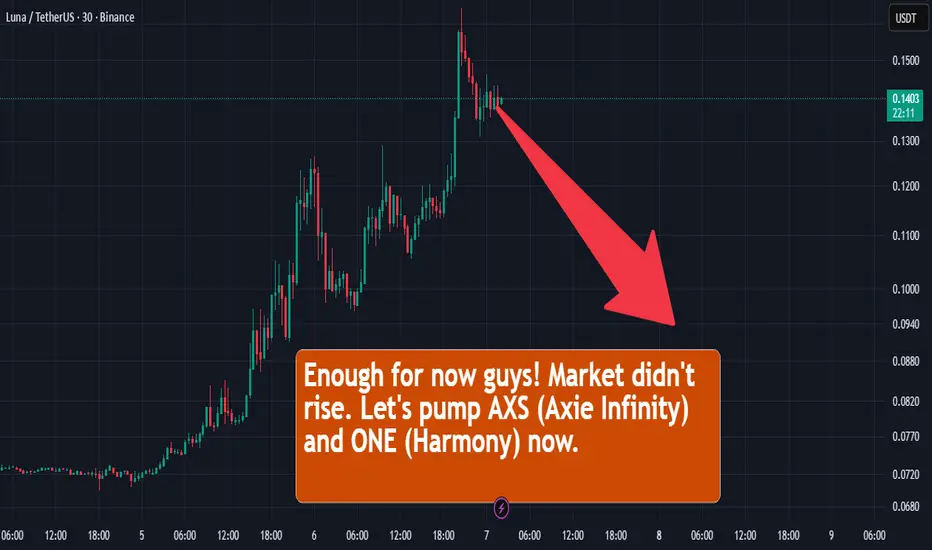
LUNA2USDT may continue to dumpThe pump was stopped in the 0.25 zone. Seller strength is beginning to dominate due to profit-taking. The coin is stopping near buyers at 0.1564, but based on market behavior, the bulls have no chance.
Volumes are declining. The reaction to support is weakening, as is buyer strength. A closing price below 0.1564 could mark the beginning of a new phase of decline.
Scenario: consolidation below the nearest key support level. Further decline to 0.1397 - 0.1216
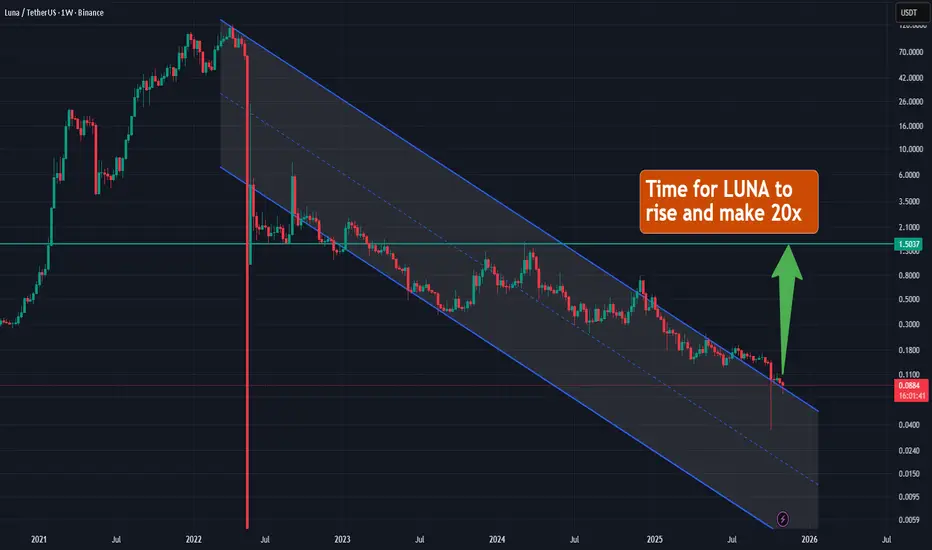
LUNA – Multiple Touches on the Long-Term Downtrend Line. LUNA has been moving within a consistent long-term downtrend , confirmed by several clean touches of the descending trendline over the past few years. Each retest has reinforced the strength of this resistance zone, but the recent volatility spike suggests that momentum may finally be shifting.
Price once again approached the trendline after an extended period of decline, and the reaction here will be crucial. If bulls manage to break above this multi-year structure, the chart opens a path t
LUNA Short Setup Loading
LUNA is approaching a major resistance at $0.2974, a level that has historically rejected price with strong selling pressure.
A liquidity grab + rejection from this zone could trigger a multi-week correction.
🎯 Short Targets:
T1 → $0.1689
T2 → $0.1006
Structure shows a clear lower-high formation before a potential breakdown — high-probability short zone ahead🚨
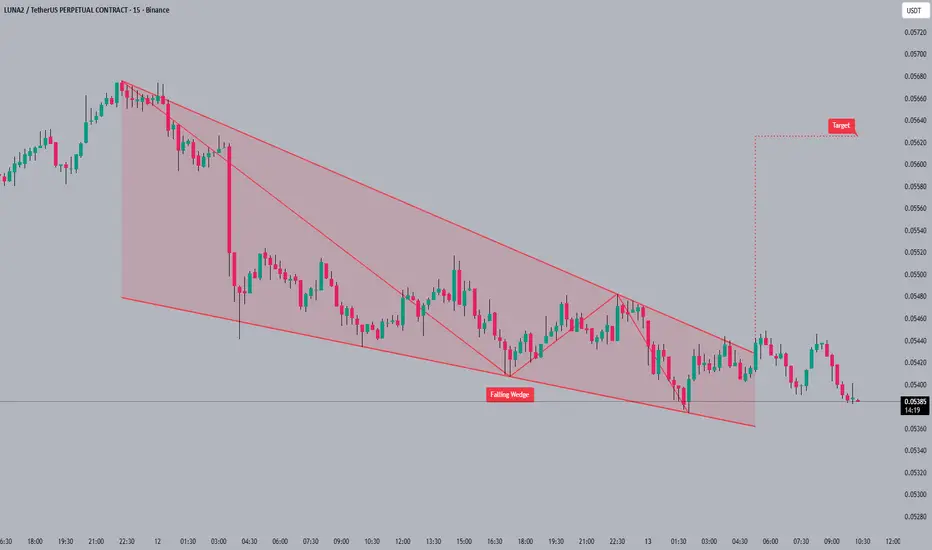
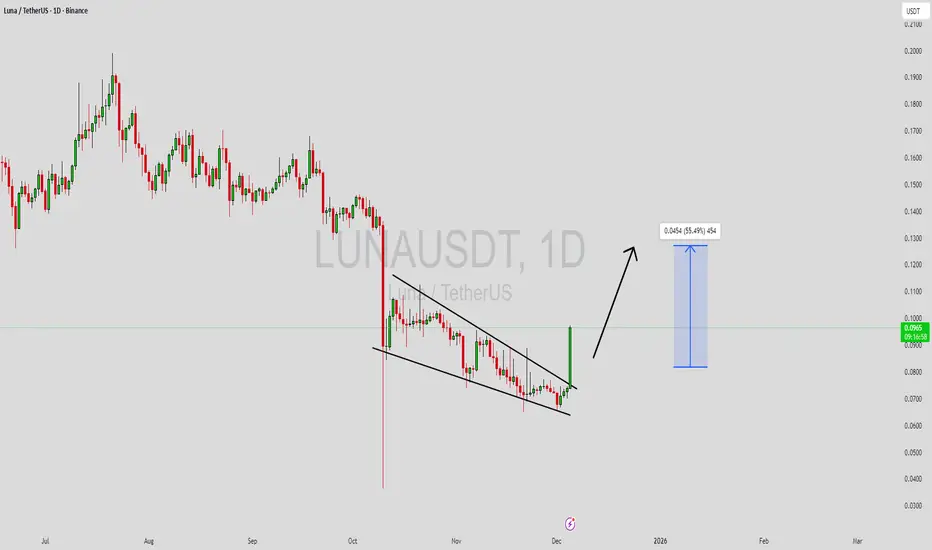
LUNAUSDT Forming Falling WedgeLUNAUSDT is forming a clear falling wedge pattern, a classic bullish reversal signal that often indicates an upcoming breakout. The price has been consolidating within a narrowing range, suggesting that selling pressure is weakening while buyers are beginning to regain control. With consistent volume confirming accumulation at lower levels, the setup hints at a potential bullish breakout soon. The projected move could lead to an impressive gain of around 90% to 100% once the price breaks above t
LUNAUSDT Forming Falling WedgeLUNAUSDT is forming a clear falling wedge pattern, a classic bullish reversal signal that often indicates an upcoming breakout. The price has been consolidating within a narrowing range, suggesting that selling pressure is weakening while buyers are beginning to regain control. With consistent volume confirming accumulation at lower levels, the setup hints at a potential bullish breakout soon. The projected move could lead to an impressive gain of around 40% to 50% once the price breaks above th
$LUNA/USDT ANALYSISOn the 1-day chart of **LUNA/USDT**, price recently broke out of a descending channel that had been forming since early October. The breakout candle closed strongly above the channel resistance with a noticeable surge in volume, confirming renewed bullish momentum after an extended downtrend. The breakout also coincides with a retest of the EMA resistance area and the lower edge of the Ichimoku cloud, showing early signs of trend reversal strength. As long as price holds above the breakout level
LUNA/USDT Terra liquidity alliance erisprotocol cosmos BreakoutTechnical Setup Favors Explosive Breakout strong buy signal EMA 20 50 100 200 are near divergence in 1week and 1 day chart.
Short squeeze incoming all short sellers futures will be liquidated which will accelerate upside.
Fundamentally:
LUNA consolidation is going on for a while but breakout is expected very soon due to terra liquidity alliance erisprotocol.
Luna 2.0 chain inflation is diverted to alliance rewards. Liquidity providers are incentivized with massive APR and incentives with 0 day
LUNA/USDT crypto trading chart Breakout soon1. Technical Setup Favors Explosive Breakout
Moving Averages (Strong Buy Signal):
7/8 daily EMAs and SMAs (including critical 10-day, 21-day, and 50-day) show bullish alignment, with price trading above key averages. This indicates entrenched upward momentum.
Only the 200-day SMA ($0.23) acts as resistance—a clean break could trigger FOMO buying.
Divergence spotted in all major Indicators
Pattern Breakout: An 8-hour chart descending triangle breakout is noted, with measured move