LUNCUSDT - Descending Channel Breakout or Another Sell-Off?LUNCUSDT on the 12H timeframe is still trading within a Descending Channel (Falling Channel) that has contained price action since the early May peak. 📊 The current structure indicates that the medium-term trend is still dominated by sellers, but price is approaching the end of the channel, increasing the probability of higher volatility and a major breakout. ⚡
📍 Price is currently trading around the mid-to-lower section of the channel. As long as it remains below the red resistance trendline, the bearish trend remains valid. However, if a breakout is confirmed with strong buying volume, the market could begin a recovery toward the next resistance levels. 🚀
━━━━━━━━━━━━━━━━━━━━
📉🧩 Pattern Formation: Descending Channel (Falling Channel)
The primary pattern on this chart is a Descending Channel, identified by two parallel trendlines sloping downward. 📐
🔍 Key Characteristics:
🔸 📉 A sequence of Lower Highs and Lower Lows, confirming that the downtrend is still intact.
🔸 📍 Price continues to respect both the upper resistance and lower support of the channel.
🔸 ⏳ As price approaches the end of the channel, the probability of a breakout increases.
🔸 🚀 A Falling Channel is often considered a bullish reversal pattern if price breaks above the upper trendline with increasing volume. Conversely, a breakdown below the channel support would likely trigger renewed selling pressure. 🔻
━━━━━━━━━━━━━━━━━━━━
🟢🚀 Bullish Scenario
✅ A bullish confirmation will only occur if price breaks out and closes above the channel resistance (red trendline).
If the breakout is confirmed with strong volume, the potential upside targets are:
🎯 Target 1: 0.00006800
🎯 Target 2: 0.00007490
🎯 Target 3: 0.00009080
🎯 Target 4: 0.00010320
🎯 Target 5: 0.00011490
🏆 Main Target: 0.00012300
📈 The stronger the breakout volume, the greater the probability that price will continue its rally toward higher resistance levels.
━━━━━━━━━━━━━━━━━━━━
🔴⚠️ Bearish Scenario
❌ The bearish outlook remains the primary scenario as long as price stays below the channel resistance.
If price fails to break out and gets rejected once again:
🔻 ⚠️ The downtrend is expected to continue within the descending channel.
🔻 🎯 The lower boundary of the channel will become the next major target for sellers.
🔻 📉 A breakdown below channel support could trigger a sharper decline, as the Lower High and Lower Low structure would remain intact.
🚨 Until a valid candle closes above the channel resistance, traders should remain cautious of continued selling pressure.
━━━━━━━━━━━━━━━━━━━━
📊💡 Conclusion
From a technical perspective, LUNCUSDT remains in a bearish phase because the Descending Channel structure has not yet been broken. 📉
⚡ However, price is now approaching a critical decision zone near the end of the pattern, making the next few candles extremely important for determining the next major move.
📌 Key Levels to Watch:
🟢 ✅ A breakout above the channel resistance could mark the beginning of a recovery toward the next resistance levels.
🔴 ❌ Another rejection at resistance or a breakdown below channel support would reinforce seller dominance and open the door for further downside.
💎 The best trading approach right now is to wait for confirmation of either a breakout or a breakdown, rather than entering based on speculation alone.
━━━━━━━━━━━━━━━━━━━━
#LUNC #LUNCUSDT #TerraClassic #Crypto #Cryptocurrency #Binance #TradingView #TechnicalAnalysis #PriceAction #DescendingChannel #FallingChannel #Breakout #Bullish #Bearish #Support #Resistance #Altcoins #CryptoTrading #ChartAnalysis #Trader
In-depth trading ideas
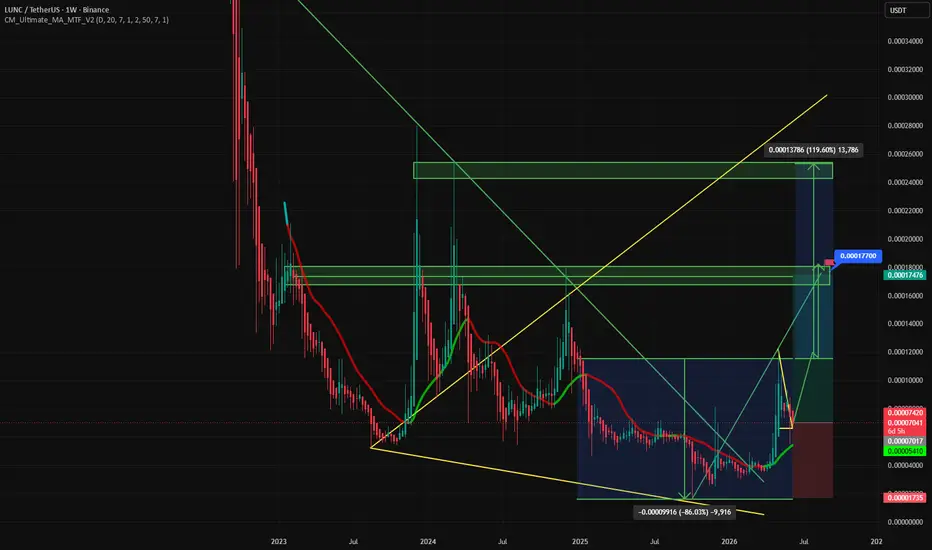
LUNC: Is The Legend Making a Comeback?1. Introduction: Market Cap & Global Status
Following the historic 2022 collapse, Terra Classic (LUNC) operates entirely under community and validator governance after the complete dissolution of Terraform Labs. Trading at a ~$400M market cap (Ranked ~120th), LUNC remains a highly speculative yet structurally resilient asset entering a critical macro cycle.
2. Global Capital Rotation & News CatalystsWhile short-term macroeconomic pressures and BTC/ETH corrections weigh on altcoins, Bitcoin Dominance (BTC.D) indicates a breakdown. Capital has sequentially rotated through PoW, GameFi, and Meme coins, signaling that the ultimate liquidity wave is nearing LUNC.Key Fundamental Drivers:Binance Burn Mechanism: Cumulative burns have surpassed 444 Billion LUNC. Binance continues its massive support by burning 50% of spot/margin trading fees, paired with the 0.5% on-chain tax removing hundreds of millions of tokens daily.Network Upgrades: The implementation of Cosmos SDK v0.53 enables cross-chain bridges, while the Market Module 2.0 enforces automated supply controls to permanently eliminate hyperinflation risks.3. Technical Analysis & Reversal StructureFalling Channel Breakout: LUNC has finally broken above the long-term falling channel that triggered from the $0.00030000$ high in December 2023.The 1X Reversal: The macro bottom formed at $0.00003400$ in April 2026. Over the last two months, LUNC surged 1X (100%), validating a powerful baseline.Indicators: Weekly Heikin Ashi candles show clear bullish green bodies for 4 consecutive weeks. RSI shows ascending momentum, while a surging trading volume alongside a quiet ADX points to an imminent, aggressive price explosion.
4. Critical Levels & TargetsThe critical line in the sand on the macro chart is $0.00011500$ (Fibonacci 0.618 level).Strategic Setup: As long as LUNC sustains its price above $0.00011500$ on the weekly close, the upward trajectory is expected to trigger a fast and violent bullish expansion.Sequential Macro Targets: $0.00011500$ — $0.00014277$ — $0.00019900$
5.Conclusion
Backed by strong Binance monthly burns, solid infrastructure upgrades, and a 4-week technical reversal pattern, LUNC/USDT is primed for significantly sharper upward moves in the coming days. The monthly macro trend remains firmly bullish.
LUNC/USDT: Bearish Structure Confirmed!#LUNCUSDT 4H Chart Analysis 📊
CRYPTOCAP:LUNC (Luna Classic) is looking heavily bearish on the 4-hour timeframe, and we expect the price to drop further towards our designated targets from this current area.
🎯 The Optimal Entry: If you are looking to execute a short position here, the optimal entry price is approximately around 0.00008715.
🔄 The Backup Plan: If the market invalidates this immediate area, we will stay patient and wait for the price to reach Red Zones 2 and 3. Once there, we will look for a fresh lower-timeframe (LTF) confirmation before entering another short.
⚙️ Risk Management: All Take Profit (TP) targets and the Stop Loss (SL) are clearly plotted on the chart. We are running this setup with a maximum of 5x leverage.
Keep a close eye on the price action. Safe trading! ⚖️
Are you shorting CRYPTOCAP:LUNC or waiting for a bounce? Let's discuss in the comments below! 👇
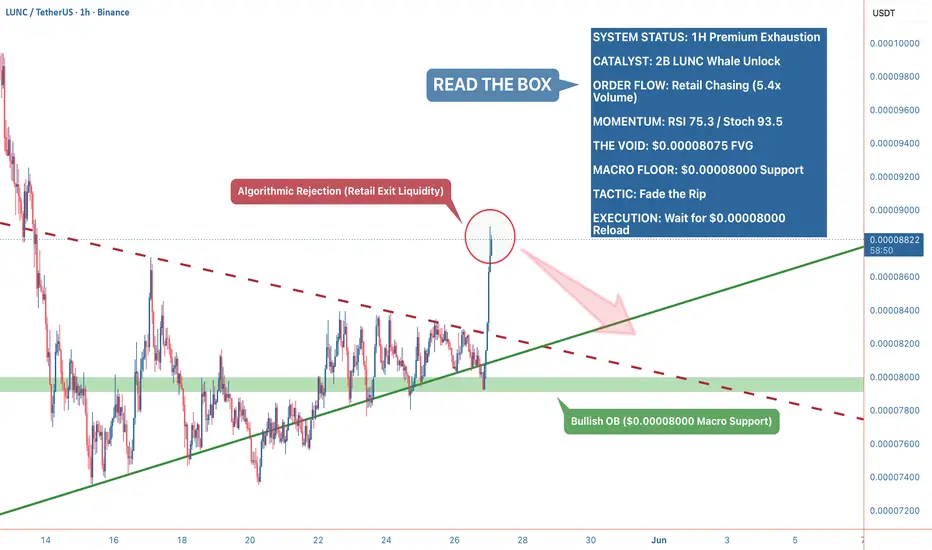
LUNC Order Flow: Why the 1H Rally is a TrapChasing LUNC after a vertical 10% rip into premium resistance is mathematical suicide. The timeline is aggressively bidding the v4.0.1 network upgrade and the recent 923 million Binance token burn, assuming this is the start of a macro reversal.
If you are buying here, you are trading the narrative, not the liquidity. You are providing exit liquidity to algorithmic sellers.
Here is the verifiable on-chain reality and the 1H microstructural data proving why this rally is exhausted, and exactly where smart money is waiting to reload.
1. The Macro Decoy: Token Burns vs. The 2B Unlock 🧠
The hype surrounding the token burns is masking a severe structural threat.
While retail celebrates the incineration of 923 million LUNC, on-chain data confirms a whale entity just officially undelegated a staggering 2 billion LUNC from the DutchLunc validator.
This creates an immediate, massive supply overhang waiting to hit centralized exchange order books, instantly neutralizing the recent burn metrics.
2. The Microstructure: 1H Premium Exhaustion 🌡️
The 1H chart proves that this upward momentum has hit a brick wall.
We just printed a massive volume spike (5.4x the average), but it resulted in a severe 23.4% upper rejection wick at the $0.00008900 local high. Buyers pushed, but institutional supply absorbed the entirety of the effort.
Momentum is violently overextended. The RSI is pegged at 75.3 and the Stochastic is screaming at 93.5.
Price is floating deep in the Smart Money PREMIUM zone, extended well above the upper Bollinger Band ($0.00008837).
Buying into a 5.4x volume climax that leaves a 23% rejection wick at overbought extremes is the definition of retail FOMO.
📉 The Apex Execution Matrix
Do not provide exit liquidity for the 2 billion token whale unlock. Wait for the algorithmic mean reversion to flush the late longs.
The Supply Ceiling (Resistance): We have a Bearish Order Block acting as the immediate supply zone between $0.00008194 and $0.00008054.
The Magnet (The Void): There is a glaring unfilled Fair Value Gap (FVG) resting directly below current price action between $0.00008156 and $0.00008075. The market hates inefficiencies; this gap will be hunted.
The Institutional Reload (Long Trigger): The high-probability, risk-adjusted long entry sits at the $0.00008000 structural support floor. This psychological level converges perfectly with our historical Bullish Order Block ($0.00008028 - $0.00007916) and the 14-touch ascending trendline. Let the price drop into this pocket before deploying capital.
Invalidation: A clean 4H close above $0.00008900 on sustained, increasing volume breaks the exhaustion thesis and indicates immediate continuation.
Trade the math, respect the liquidity voids, and ignore the burn hype.
Disclaimer: This analysis maps structural liquidity and institutional order flow. Always wait for confirmation before executing and manage your risk strictly.
LUNCUSDTLUNC/USDT 1H Analysis
LUNC has been respecting a long-term descending trendline for an extended period, but price is now starting to push above that structure while holding a key support zone around 0.000073–0.000075.
The highlighted support area has reacted multiple times, showing clear buyer interest whenever price revisits the zone. At the same time, the recent move above the descending trendline suggests weakening bearish momentum in the short term.
If price can maintain acceptance above the broken trendline, the next important resistance levels are visible around 0.000086 and 0.000096.
On the downside, losing the current support zone would invalidate the breakout attempt and could send price back toward the lower support levels around 0.000066 and 0.000057.
Summary:
LUNC is attempting to break out of a long-standing descending structure while holding a major support zone. Holding above support keeps the bullish recovery scenario active, while losing the zone would shift momentum back to the downside.
Take your risk, make some profit !
- CryptoSignalAPP Team
Terra Luna Classic soon to jump—more than 660% profits potentialLUNC has been rising... Here the market bottom appeared October 2025, we all know about this event.
We have higher lows and a major high based on a 225% move in early December. This move came together with the highest buy volume ever.
Now, we still have no uptrend just a strong recovery phase. The move that is about to develop can result in a higher high compared to December and this would confirm a new uptrend. This is only weeks away.
This is one aspect of the chart.
The second aspect to consider is to look at LUNCUSDT as a trading, or buying, opportunity.
The chart looks primed, ready, to grow.
A strong up-move results in a classic retrace. The classic retrace ends in a higher low. The higher low leads to prices creeping up slowly and this tends to be followed by a massive jump. That's the sequence. We are only missing the last part.
This is another project, pair and chart that supports a bullish altcoins market. One that is still trading at bottom prices but soon ready to grow.
Namaste.
$LUNC BREAKS INTO TOP 100 CRYPTOS — WHAT’S NEXT?CRYPTOCAP:LUNC has been trending for the past month and has now officially entered the top 100 cryptocurrencies by market cap.
After rallying ~150% in the last 3 weeks, momentum is clearly strong. On lower timeframes, there are no clear signs of bearish pressure yet.
However, when zooming out to the weekly timeframe, the trend remains technically bearish until a key resistance zone is breached.
📍 Key Resistance: $0.00015253 – $0.00017913
Strategy:
Right now, it’s a “wait and watch” zone. You can look for buying opportunities on dips, but the real confirmation comes only if the price breaks and closes above the resistance zone — that would signal a full shift to a bullish trend.
Until then, expect volatility and be cautious chasing highs.
Terra Classic (LUNC) · The sudden jump · 184% - 580% short-term This process has been in the making for months right? Six months in the making, so there shouldn't be a surprise when LUNCUSDT starts to grow, suddenly, in bull-run mode. It will be sudden but the build up process took forever. The tool to count the candles says 183 days.
See the green rising triangle, it reveals the bullish bias. There is also a Fibonacci extension level that was just conquered as resistance, the 0.148 ($0.00004014).
Back to the targets. I am seeing a sudden jump but only sudden because it has been in the making for so long. Two targets mainly to be hit within a short period of time, possibly within 30 days (short-term). The first one 0.00011718 followed by 0.00028110. 184% & 580% profits potential.
Thank you for reading.
Namaste.
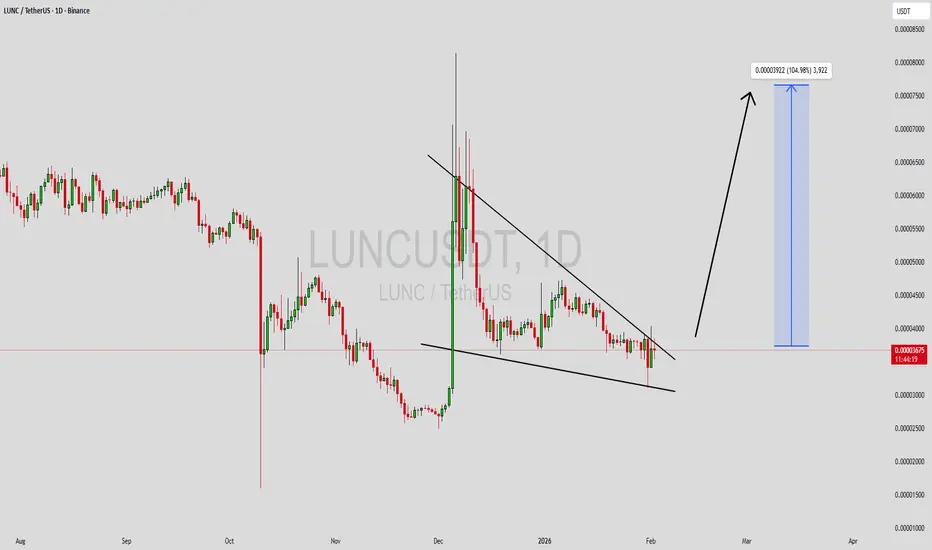
LUNCUSDT Forming Bullish MomentumLUNCUSDT is forming a clear bullish momentum pattern, a classic bullish reversal signal that often indicates an upcoming breakout. The price has been consolidating within a narrowing range, suggesting that selling pressure is weakening while buyers are beginning to regain control. With consistent volume confirming accumulation at lower levels, the setup hints at a potential bullish breakout soon. The projected move could lead to an impressive gain of around 90% to 100% once the price breaks above the wedge resistance.
This bullish momentum pattern is typically seen at the end of downtrends or corrective phases, and it represents a potential shift in market sentiment from bearish to bullish. Traders closely watching LUNCUSDT are noting the strengthening momentum as it nears a breakout zone. The good trading volume adds confidence to this pattern, showing that market participants are positioning early in anticipation of a reversal.
Investors’ growing interest in LUNCUSDT reflects rising confidence in the project’s long-term fundamentals and current technical strength. If the breakout confirms with sustained volume, this could mark the start of a fresh bullish leg. Traders might find this a valuable setup for medium-term gains, especially as the pattern completes and buying momentum accelerates.
✅ Show your support by hitting the like button and
✅ Leaving a comment below! (What is your opinion about this Coin?)
Your feedback and engagement keep me inspired to share more insightful market analysis with you!
LUNCUSDT UPDATECRYPTOCAP:LUNC Technical Setup Pattern: Falling Wedge Breakout Current Price: $0.00004158 Target Price: $0.00005500, $0.00005800 Target % Gain: 45.66% LUNC is attempting a breakout from a falling wedge on the 1D timeframe with price pushing above the descending resistance and showing early bullish strength, indicating potential upside continuation if volume supports the move Time Frame: 1D
$LUNC – Approaching Buyers Fair Value GapBINANCE:LUNCUSDT
CRYPTOCAP:LUNC – Approaching Buyers Fair Value Gap After Sharp Decline on 4H Chart 📉
🛡️ Defensive zone ahead
After a strong rally in early March followed by weeks of consolidation and gradual selling pressure, LUNC has broken lower and is now heading directly toward the Buyers Fair Value Gap #93 (0.00003885 – 0.00003955).
The price has formed a series of lower highs and lower lows, with the latest drop accelerating toward this demand zone. This FVG represents a significant imbalance where buyers previously stepped in aggressively.
🎯 Key levels to watch:
- Primary support zone: 0.00003885 – 0.00003955 (Buyers FVG #93) — current target area
- A strong bounce and bullish reaction from inside this gap could signal a short-term relief rally or trend reversal
- If the gap fails to hold and price closes decisively below 0.00003885, further downside toward 0.00003400 – 0.00003600 becomes possible
💡 “The most important rule of trading is to play great defense, not great offense.”
Risk management is crucial in this environment. Monitor for bullish reversal candles, volume increase, or divergence near the FVG for potential long opportunities. Always protect capital first.
#LUNC #LUNCUSDT #TerraClassic #Crypto #Altcoins #FairValueGap #SupportZone #SmartWedge #TradingView #Binance #CryptoTrading #SmartWedgeTrader
LUNCUSDT Forming Bullish MomentumLUNCUSDT is forming a clear bullish momentum pattern, a classic bullish reversal signal that often indicates an upcoming breakout. The price has been consolidating within a narrowing range, suggesting that selling pressure is weakening while buyers are beginning to regain control. With consistent volume confirming accumulation at lower levels, the setup hints at a potential bullish breakout soon. The projected move could lead to an impressive gain of around 80% to 90% once the price breaks above the wedge resistance.
This bullish momentum pattern is typically seen at the end of downtrends or corrective phases, and it represents a potential shift in market sentiment from bearish to bullish. Traders closely watching LUNCUSDT are noting the strengthening momentum as it nears a breakout zone. The good trading volume adds confidence to this pattern, showing that market participants are positioning early in anticipation of a reversal.
Investors’ growing interest in LUNCUSDT reflects rising confidence in the project’s long-term fundamentals and current technical strength. If the breakout confirms with sustained volume, this could mark the start of a fresh bullish leg. Traders might find this a valuable setup for medium-term gains, especially as the pattern completes and buying momentum accelerates.
✅ Show your support by hitting the like button and
✅ Leaving a comment below! (What is your opinion about this Coin?)
Your feedback and engagement keep me inspired to share more insightful market analysis with you!
Terra Luna = high risk, high rewardLUNC is sitting at a major weekly demand zone that previously acted as support during prior consolidations. Price has been compressing tightly along this level, showing signs of absorption after a prolonged downtrend. Volume spiked on the recent move, suggesting active participation rather than passive drift.
Momentum indicators are attempting to curl up from lower ranges, which often precedes relief rallies when structure is reclaimed. The key area to watch is the weekly resistance overhead, which aligns with a high volume node and prior breakdown level. If bulls can reclaim and hold above that zone, it opens the door for a larger rotation toward the next major supply block.
Invalidation comes from losing the current support base cleanly on high volume, which would likely trigger another liquidity sweep lower before any meaningful recovery.
Right now this is a high risk, high reward inflection zone. Patience and confirmation matter.
LUNCUSDT — Squeeze Fired Into Ghost Market With OBV Divergence
LUNC is showing a fired squeeze with deep bullish structure, but the volume profile underneath is hollow. Spot and futures are both quiet while the spot-to-futures relationship flags ghost market — futures leading with no real spot participation. The OBV divergence is the one signal keeping this interesting.
Price is at 0.00003741 with futures slightly behind at 0.00003739. The retrace is shallow at -1.4% with a 12.1% bounce at 8.5x — a confirmed breakout above the demand zone. The extreme breakout tag on the deep timeframes confirms structural strength, but the question is whether volume validates it.
Directional scoring reads 82.7% bullish across 112 signals at a 4.37x ratio — deep bull classification. Close-to-trigger signals favor bulls 12 to 2. EMA crossovers are heavily bullish at 7 to 1, candle patterns 10 to 1, Ichimoku 9 to 5, three soldiers 1 to 0, star reversals 2 to 0, pattern totals 3 to 0. The spread sits at 65.4% deep. The structural read is about as clean as it gets — nearly every pattern category aligns bullish with strong margins.
Volume tells the opposite story. Spot Z reads -1.48 — low. Futures Z is -1.51 — very low. Combined is -1.51, also very low. The futures-to-spot ratio is just 0.25x — spot dominant, meaning what little volume exists is coming from the spot side rather than futures. Dollar volume shows 662.1K spot against 166.28K futures. The spot-to-futures tag reads ghost market with neutral directional flow. Momentum is -1.83 and decelerating. No whale activity and liquidity is clear. No squeezes are active on either spot or futures volume — the volume environment is dead quiet.
The main squeeze on the overlay has fired with bullish momentum direction and bandwidth at 13.35%. Spot momentum is compressing upward at 116.8% with squeeze divergence reading normal. This is a pure structural squeeze firing into a volume vacuum — the spring is releasing but the energy behind it is thin.
OBV Z reads 3.25 with strong upward trajectory — this is the divergence worth watching. While raw volume Z-scores are deeply negative, on-balance volume is surging. That means the volume that does exist is overwhelmingly on the buy side. Accumulation is happening, just at low absolute levels. This kind of OBV divergence against low volume can either precede a real breakout when volume returns, or it can mark quiet distribution where smart money exits into thin liquidity.
Leverage is 0.25x at the 88.8th percentile — upper range. The all-time max was 1x roughly 5948 bars ago, and the minimum was 0x about 8180 bars back. Price sits 64.7% into its range at mid level. The leverage percentile being upper while the absolute level is low reflects LUNC's generally thin futures market — it doesn't take much to push the percentile high.
Premium is nearly flat at -0.05% with a Z-score of 0.5 — neutral. Yield reads -59% APY with a mild bullish lean. Standard deviation is 0.182% with a mean Z at 0.25 sigma normal. No stress, no dislocation, no edge from the premium structure.
Bullish scenario: The fired squeeze resolves upward with the deep structural alignment. The OBV divergence proves prescient — accumulation at low volume precedes a real spot bid entering the market. Volume Z-scores climb from deeply negative toward zero as participation increases, converting the ghost market into genuine momentum. Price targets the 0.000040 to 0.000042 range as the breakout extends.
Bearish scenario: The squeeze fires into nothing. Volume stays dead and the ghost market tag proves correct — there is no real participation behind the structural signals. The OBV strength fades as the thin buying dries up, and the breakout at 8.5x becomes a false break. Price drifts back below the demand zone toward the 0.000033 area. An 82.7% bullish read with no volume behind it is just a number on a screen.
Watch for spot volume Z-scores to climb above -1.0 as the minimum confirmation that the squeeze has real energy behind it. The OBV at 3.25 versus raw volume at -1.51 is the defining tension — one of them is wrong. If volume arrives to match the OBV, this moves. If OBV rolls over to match volume, it stalls. Also monitor whether the ghost market tag shifts to a more active classification in coming bars.
Structure says go, volume says wait. The squeeze has fired so the directional move is imminent — let the volume profile tell you whether to trust it or fade it.
More analysis on my profile.
Tags: LUNCUSDT, LUNC, Terra Luna Classic, crypto, squeeze, ghost market, volume analysis, OBV, leverage, futures, spot, market structure
LUNCUSDT Forming Bullish PennantLUNCUSDT is forming a clear bullish pennant pattern, a classic bullish continuation signal that often indicates an upcoming breakout. The price has been consolidating within a narrowing range, suggesting that selling pressure is weakening while buyers are beginning to regain control. With consistent volume confirming accumulation at lower levels, the setup hints at a potential bullish breakout soon. The projected move could lead to an impressive gain of around 90% to 100% once the price breaks above the pennant resistance.
This bullish pennant pattern is typically seen after a strong upward move (the flagpole) followed by a brief consolidation phase, and it represents a pause before the continuation of the prevailing bullish trend. Traders closely watching LUNCUSDT are noting the strengthening momentum as it nears a breakout zone. The good trading volume adds confidence to this pattern, showing that market participants are positioning early in anticipation of continuation.
Investors’ growing interest in LUNCUSDT reflects rising confidence in the project’s long-term fundamentals and current technical strength. If the breakout confirms with sustained volume, this could mark the resumption of a powerful bullish leg. Traders might find this a valuable setup for medium-term gains, especially as the pennant pattern completes and buying momentum accelerates.
✅ Show your support by hitting the like button and
✅ Leaving a comment below! (What is your opinion about this Coin?)
Your feedback and engagement keep me inspired to share more insightful market analysis with you!
LUNCUSDT Deep Bull at 75% With Spot Dominant Leverage LUNCUSDT Deep Bull at 75% With Spot Dominant Leverage and 49 Bar Squeeze Ready to Fire
LUNCUSDT
Overview
LUNCUSDT is flashing one of the cleanest setups across multiple signals. Deep bull bias at 75.4%, spot dominant leverage at just 0.24x, price near the floor at 23%, and a 49-bar squeeze sitting at imminent. This is a market where real spot participants are in control, speculation is virtually absent, and compression is about to resolve. The direction of the squeeze breakout is the trade.
Price
Spot prints 0.00003483 against futures at 0.00003475, a tight backwardation of negative 0.23%. The retrace from recent highs is only negative 6.6% with a 7.2% bounce, giving a 1.1x recovery ratio. That is a balanced read leaning constructive where buyers have reclaimed more than sellers took. The 200-bar range shows a high of 0.00007 and a low of 0.00003, with current price sitting at 23% in the floor zone. Price is near the bottom of its range but the bias says it should not be here much longer.
Bias
The multi-timeframe grid reads deep bull at 75.4% with 51% clarity. Out of 112 signals, 43 are bullish against only 14 bearish. This is dominant. EMA structure leans bull 5 to 3. Candle patterns are overwhelmingly bullish at 13 to 0, not a single bearish candle signal. Ichimoku crosses are evenly split at 7 to 7, showing the transition is still in progress on momentum indicators. Deep timeframes confirm with close-over-trend at 10 to 4 and engulfing at 6 to 0. The spread hits 50.9%, classified as deep. This is broad-based bullish alignment with the only holdout being Ichimoku, which typically lags the turn.
Volume
Steady but unremarkable across the board. Spot Z-score is negative 0.41, futures negative 0.26, combined negative 0.36. All in steady territory. Momentum sits at zero and rising, which means volume has stopped declining and is beginning to turn. Bull versus bear Z-scores read negative 0.17 against negative 0.36, marginally favoring bulls. No whale activity, no liquidations, clear on both sides. OBV Z-score sits at negative 0.6 but with inflow direction. This is the key signal. OBV has turned and money is flowing back in even though volume Z-scores are still below average. Accumulation is happening quietly. No squeeze is active on either spot or futures side but spot squeeze momentum is contracting at 234.3%, tightening toward a potential compression.
Leverage
This is where the setup gets compelling. Leverage sits at 0.24x, deep into spot dominant territory. Futures volume is a fraction of spot. The percentile is 19.4% at the floor. The all-time max was only 1x from 1980 bars ago, meaning this pair has essentially never been heavily leveraged. The all-time min is 0.04x from 2081 bars ago. With futures to spot dollar volume at just 626.96K against 2.66M, spot participants are running this market four to one. Any move from here is organic, not manufactured.
Premium
Futures trade at a 0.23% discount in backwardation. The premium Z-score is negative 0.5, mildly below average. Annualized yield reads negative 252% APY at negative 0.5 sigma, flagging as a contrarian bull signal. The backwardation is shallow and not alarming. It simply reflects that futures traders have slightly less conviction than spot holders, which makes sense given the low futures participation.
Squeeze
A price squeeze has been building for 49 bars and sits at imminent. Bollinger bandwidth is at just 7.4%, extremely compressed. Momentum reads bear but direction is up, meaning the compression is tightening with early signs of upward pressure. This is the catalyst the setup needs. A 49-bar squeeze on a deep bull bias with spot dominant leverage and OBV inflow is textbook for an upside resolution. The squeeze has stored significant energy and the breakout should produce a meaningful expansion in either direction, though the weight of evidence favors upside.
Scenarios
1. Bullish squeeze resolution, 55% probability. The 49-bar squeeze fires upward consistent with deep bull bias, OBV inflow, and constructive recovery ratio. Spot volume rises as price breaks the upper bandwidth. With no leverage overhead, the move is organic and sustainable. Price targets the mid-range of the 200-bar channel around 0.00005 as the first objective.
2. Slow grind higher without explosion, 25% probability. The squeeze resolves weakly or continues building. Price inches higher on low volume as spot accumulation continues without urgency. The 1.1x recovery ratio gradually improves. This plays out as a base-building process rather than a breakout event.
3. Failed squeeze with downside flush, 20% probability. Despite the bullish alignment, the squeeze fires downward. The 23% price floor breaks and the 200-bar low gets tested. This scenario requires the Ichimoku holdout to be the leading signal rather than the lagging one. Watch for OBV flipping back to outflow as the warning.
Watch List
1. Squeeze resolution direction. At 49 bars imminent, the breakout is the immediate catalyst. First bar outside the bandwidth determines the trade.
2. OBV continuation. Currently negative 0.6 with inflow. Sustained inflow that pushes OBV Z above 0 would confirm accumulation is accelerating.
3. Volume activation. Spot Z at negative 0.41 needs to cross above 0 to validate the breakout with real participation.
4. Ichimoku convergence. Currently split 7 to 7. A flip to bullish majority would remove the last bearish holdout and push bias toward extreme bull.
5. Price percentile expansion. Currently 23% floor. A move toward 50% mid would confirm the trend change is translating into actual price gains.
Risk
The low volatility environment means the squeeze breakout will be the defining event. Missing the first bar is expensive because bandwidth at 7.4% means expansion will be rapid once it starts. The spot dominant structure at 0.24x provides natural protection against manipulation wicks, making tighter stops more viable than on leveraged pairs. The primary risk is a false breakout where the squeeze fires and immediately reverses. Use volume confirmation on the breakout bar as the filter. If the resolution bar prints with spot Z still below negative 0.5, the breakout lacks conviction and should be treated with caution regardless of direction.
More analysis on my profile.
Tags: LUNCUSDT, LUNC, crypto, bullish, squeeze, volume analysis, spot dominant, leverage, market structure, accumulation
LUNCUSDT Forming Bullish PennantLUNCUSDT is forming a clear bullish pennant pattern, a classic bullish reversal signal that often indicates an upcoming breakout. The price has been consolidating within a narrowing range, suggesting that selling pressure is weakening while buyers are beginning to regain control. With consistent volume confirming accumulation at lower levels, the setup hints at a potential bullish breakout soon. The projected move could lead to an impressive gain of around 90% to 100% once the price breaks above the pennant resistance.
This bullish pennant pattern is typically seen at the end of downtrends or corrective phases, and it represents a potential shift in market sentiment from bearish to bullish. Traders closely watching LUNCUSDT are noting the strengthening momentum as it nears a breakout zone. The good trading volume adds confidence to this pattern, showing that market participants are positioning early in anticipation of a reversal.
Investors’ growing interest in LUNCUSDT reflects rising confidence in the project’s long-term fundamentals and current technical strength. If the breakout confirms with sustained volume, this could mark the start of a fresh bullish leg. Traders might find this a valuable setup for medium-term gains, especially as the pennant pattern completes and buying momentum accelerates.
✅ Show your support by hitting the like button and
✅ Leaving a comment below! (What is your opinion about this Coin?)
Your feedback and engagement keep me inspired to share more insightful market analysis with you!
LUNC Showing Classic Three-Drive StructureHi!
The chart illustrates a strong pump followed by what looks like a developing three-drive pattern. After the first drive, price pulled back roughly 33%, forming a solid base before climbing into the second drive. Momentum is still bullish, but a deeper retracement may occur before the projected third drive toward the 0.000116 area. As long as corrections stay controlled and volume supports the trend, the overall structure suggests continued upside potential.
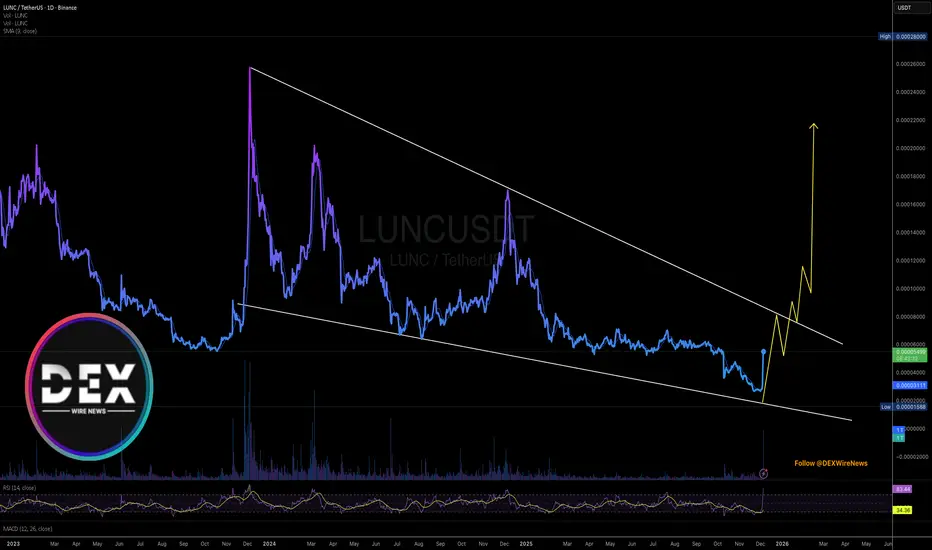
Breaking; Terra Classic ($LUNC) Spike 74% Today Terra Classic ( CRYPTOCAP:LUNC ) today a notable 65% albeit market sentiment was essentially bearish. the memecoin spike in early Friday morning placing the asset in an overbought region implying the possibility of a drawback.
The asset is set to spike 150% today should it break the ceiling of the falling wedge formed on the chart.
In another news, Terraform Labs secures $1.3B settlement court approval. Settlement impacts Terra Classic, LUNA, and USTC.
The $1.3 billion settlement by Terraform Labs is notable as it reflects significant regulatory and market shifts. It affects key crypto assets like Terra Classic and LUNA, while outlining a structured path for creditor reimbursements.
The Terraform Labs settlement finalized marks a pivotal moment in the crypto regulatory landscape. Courts approved the $1.3B figure for distribution. Overseen by the U.S. Bankruptcy Court, the settlement's impact resonates across the crypto sector.
What Is Terra Classic ( CRYPTOCAP:LUNC )?
Terra is a blockchain protocol that uses fiat-pegged stablecoins to power price-stable global payments systems. According to its white paper, Terra combines the price stability and wide adoption of fiat currencies with the censorship-resistance of Bitcoin (BTC) and offers fast and affordable settlements
Terra Classic Price Data
The Terra Classic price today is $0.000047 USD with a 24-hour trading volume of $150,349,720 USD. Terra Classic is up 65.62% in the last 24 hours. The current CoinMarketCap ranking is #146, with a market cap of $256,910,315 USD. It has a circulating supply of 5,486,583,841,259 LUNC coins and the max.
LUNCUSDT Forming Falling WedgeLUNCUSDT is forming a clear falling wedge pattern, a classic bullish reversal signal that often indicates an upcoming breakout. The price has been consolidating within a narrowing range, suggesting that selling pressure is weakening while buyers are beginning to regain control. With consistent volume confirming accumulation at lower levels, the setup hints at a potential bullish breakout soon. The projected move could lead to an impressive gain of around 90% to 100% once the price breaks above the wedge resistance.
This falling wedge pattern is typically seen at the end of downtrends or corrective phases, and it represents a potential shift in market sentiment from bearish to bullish. Traders closely watching LUNCUSDT are noting the strengthening momentum as it nears a breakout zone. The good trading volume adds confidence to this pattern, showing that market participants are positioning early in anticipation of a reversal.
Investors’ growing interest in LUNCUSDT reflects rising confidence in the project’s long-term fundamentals and current technical strength. If the breakout confirms with sustained volume, this could mark the start of a fresh bullish leg. Traders might find this a valuable setup for medium-term gains, especially as the wedge pattern completes and buying momentum accelerates.
✅ Show your support by hitting the like button and
✅ Leaving a comment below! (What is your opinion about this Coin?)
Your feedback and engagement keep me inspired to share more insightful market analysis with you!