GRASIM S/R
Support and Resistance Levels:
Support Levels: These are price points (green line/shade) where a downward trend may be halted due to a concentration of buying interest. Imagine them as a safety net where buyers step in, preventing further decline.
Resistance Levels: Conversely, resistance levels (r
Grasim Industries Ltd. Sponsored GDR RegS
No trades
No trades
1.0 USD
562.13 M USD
19.77 B USD
Company info
Sector
Industry
CEO
Himanshu Kapania
Website
Headquarters
Mumbai
Founded
1947
IPO date
Nov 25, 1992
ISIN
US3887061030
CUSIP
388706103
FIGI
BBG000BSNFP9
Identifiers
ISIN US3887061030
Grasim Industries Ltd. engages in the production of chemicals and cement. It operates through the following segments: Cellulosic Fibres, Chemicals, Building Materials, Financial Services, and Others. The Cellulosic Fibres segment refers to Cellulosic Staple Fibre (CSF) and Cellulosic Fashion Yarn (CFY). The Chemicals segment includes Chlor Alkali, Specialty Chemicals and Chlorine Derivatives. The Building Materials segment pertains to cement, paints and B2B E-Commerce businesses. The Financial Services segment offers Non-Bank Financial Services, Life Insurance Services, Asset Management (AMC), Housing Finance, and Equity Broking. The Others segment represents the remaining businesses of the Group, mainly represents Textiles, Insulators and Renewable Power business. The company was on August 25, 1947 and is headquartered in Mumbai, India.
Grasim Industries: Momentum Surge & BreakoutRecent News & Corporate Announcements
Q1 FY27 Earnings Date: Grasim Industries is scheduled to announce its Q1 FY27 financial results and hold its analyst call on August 12, 2026.
Dividend Record Date: August 7, 2026 marks the record date for the recommended final dividend of ₹10 per share (500% on
GRASIM (D) CHARTTechnical Note: Let the market come to your zones and show its hand. Trade safe and manage your risk! Always wait for your own confirmations before entering the market.
Risk Disclaimer: This analysis is for educational purposes only and does not constitute financial advice. Always practice proper r
Grasim IndustriesSupport Zones
₹3,180–3,200 – Immediate support
₹3,140–3,160 – Strong buying zone
₹3,080–3,100 – Major positional support
Resistance Zones
₹3,225–3,245 – Immediate resistance
₹3,280–3,320 – Breakout zone
₹3,400–3,500 – Positional target if momentum continues
Trading View
Bullish above ₹3,245 → Tar
**My View on GRASIM — Daily Chart****1. Key Observation**
GRASIM looks weak near the upper resistance zone. Price is struggling around **₹3,126–₹3,197**, and the structure suggests that a short-term downtrend may be starting.
**2. My View**
My view is bearish as long as GRASIM stays below **₹3,197**. The stock may enter a correction
Grasim Industries Limited
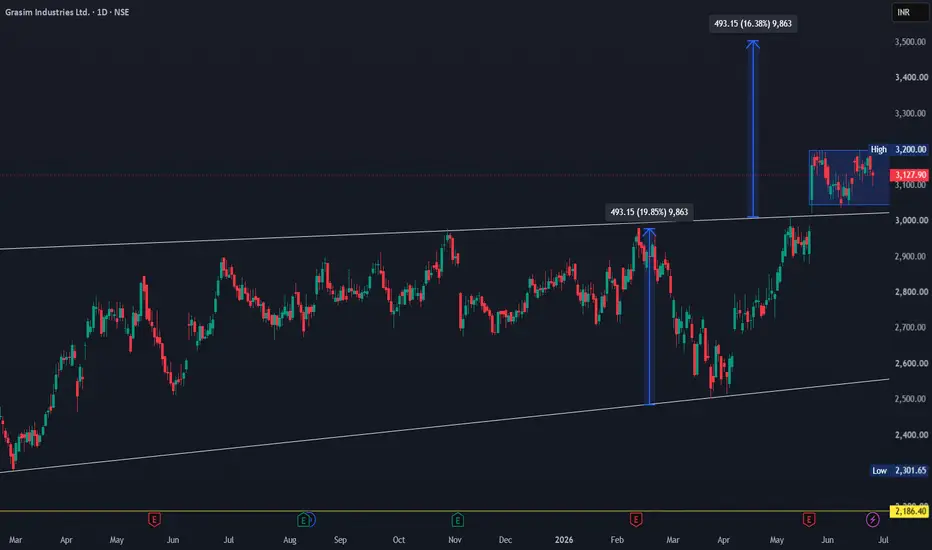
Price broke out of a 2 year base and is forming a new base above the 2Y base.
A break of this base can lead a good rally as this base indicates a accumulation of strong hands at play since big moves are made by buyers and in between slight profit booking.
Short, Medium and Long Term moving avera
GRASIM available at BUY ZONE ..............Grasim is looking bullish for the next few months , trail your stoploss after subsequent HH ( higher highs ) , PLEASE RESPECT THE STOPLOSS , no matter how much you are convinced with fundamentals .
ALL THE BEST ....................
Few points to note :::::
1. RETRACEMENT WITH LESS VOLUME COMPARED
See all ideas
Summarizing what the indicators are suggesting.
Oscillators
Neutral
Oscillators
Neutral
Summary
Neutral
Summary
Neutral
Summary
Neutral
Moving Averages
Neutral
Moving Averages
Neutral
Displays a symbol's price movements over previous years to identify recurring trends.