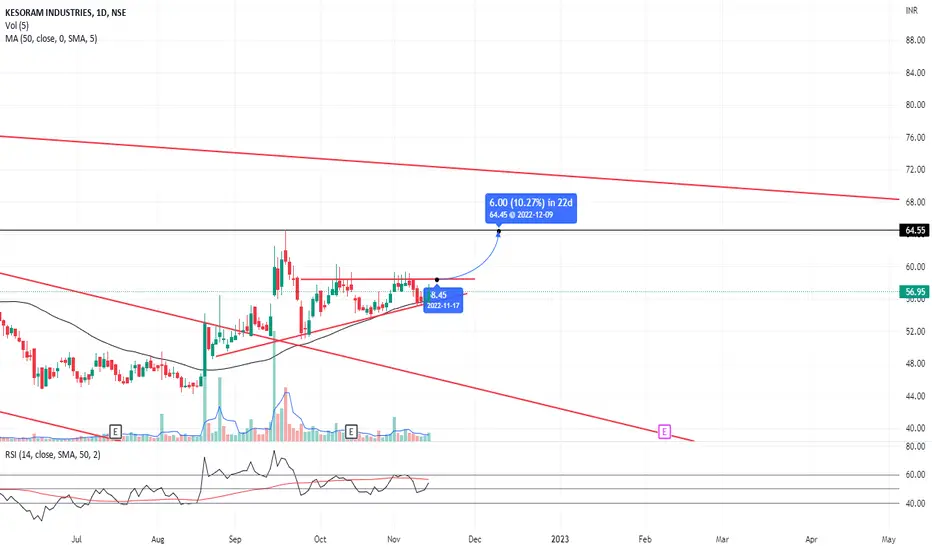
Darvas Box Strategy - Break out Stock - Swing TradeDisclaimer: I am Not SEBI Registered adviser, please take advise from your financial adviser before investing in any stocks. Idea here shared is for education purpose only.
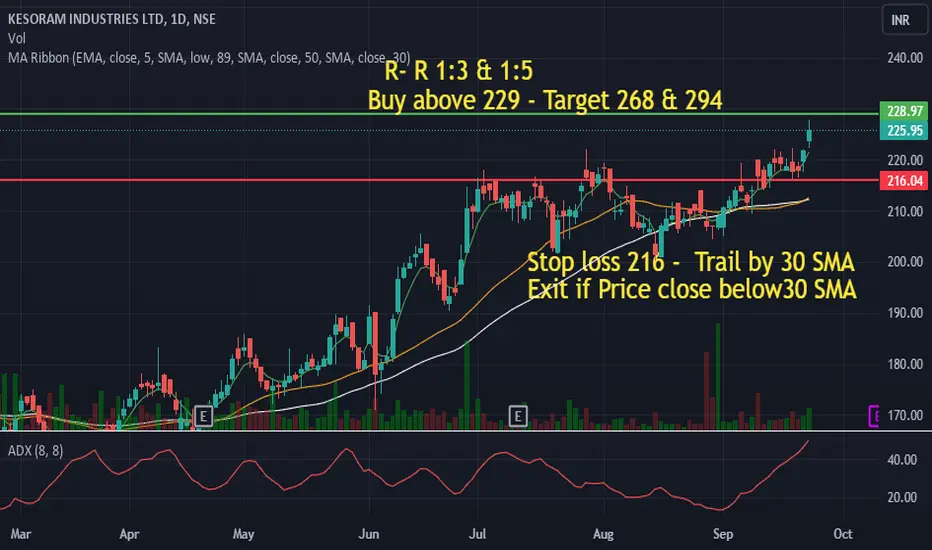
Stock has given break out. Buy above high. Keep this stock in watch list.
Buy above the High and do not forget to keep stop lo
Kesoram Industries Ltd Sponsored GDR RegS
No trades
No trades
−0.003 USD
−9.97 M USD
28.03 M USD
Company info
Sector
Industry
CEO
Gautam Agarwalla
Website
Headquarters
Kolkata
Founded
1919
IPO date
Jan 11, 1995
ISIN
US4925322053
CUSIP
492532205
FIGI
BBG000HV12N1
Identifiers
ISIN US4925322053
Kesoram Industries Ltd. engages in the manufacture and sale of cement. The company operates under the India and Others geographical segments. The company was founded on October 18, 1919 and is headquartered in Kolkata, India.
52 Week High Breakout - Positional Trade Disclaimer: I am not a Sebi registered adviser.
This Idea is publish purely for educational purpose only before investing in any stocks please take advise from your financial adviser.
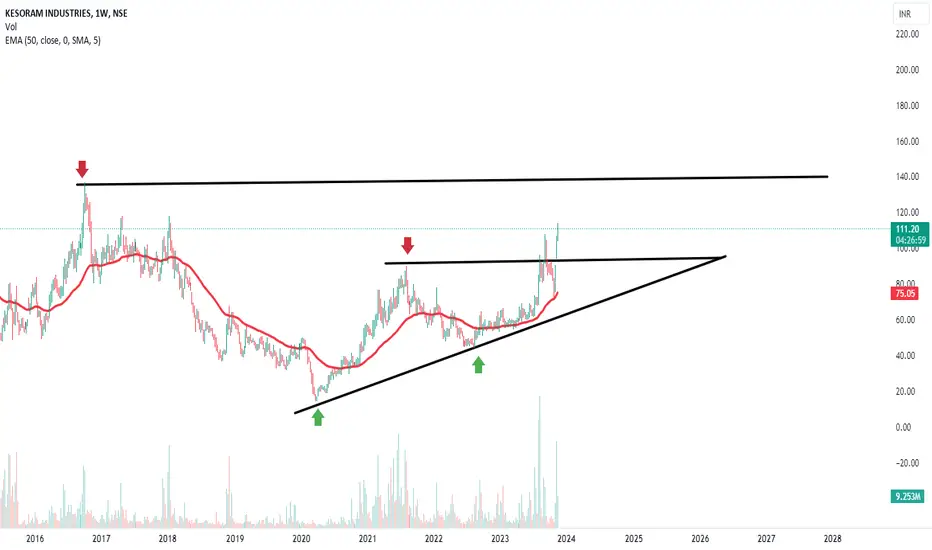
52 Week Breakout. Stock has Crossed 52 week High. Keep in watch list. Buy above the high. Suitable for Positional T
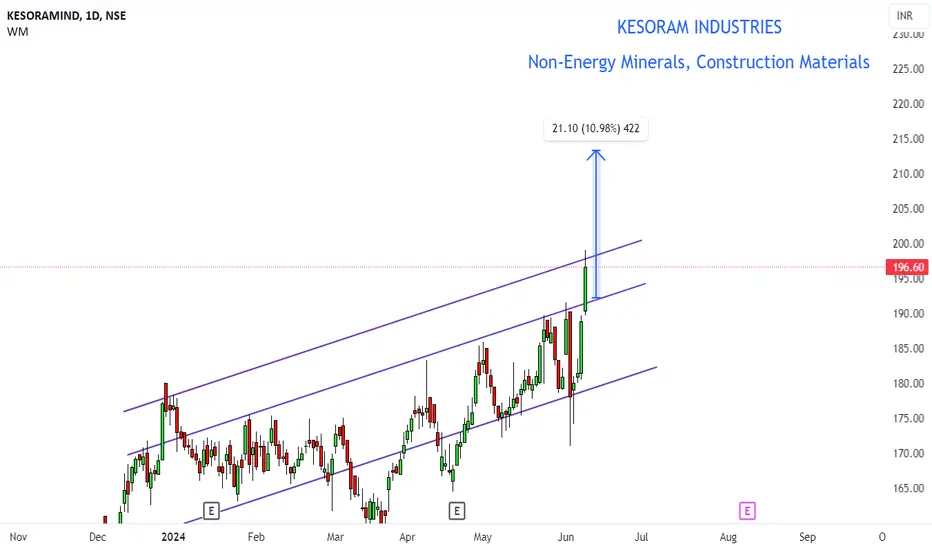
Channel breakout on KESORAMINDKESORAMIND broke out of channel pattern on daily chart. There has been tight consolidation for almost three months. Trading in the range of 10-15%. Also during runup to the channel, there were huge buying as shown in volume. While consolidating you could notice volume has dried up. Signifies sellers
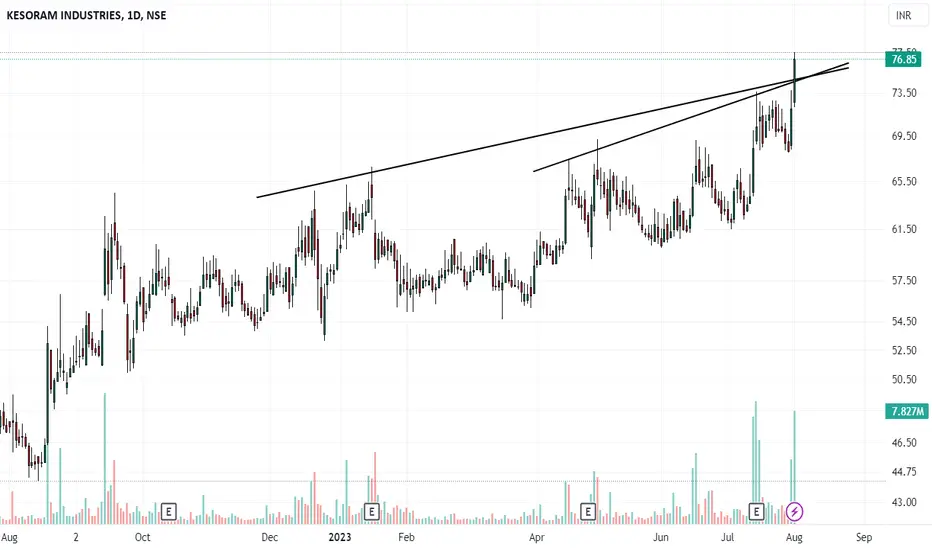
Trendline BreakoutPlease look into the chart for a detailed understanding.
Consider these for short-term & swing trades with 2% profit.
For BTST trades consider booking
target for 1% - 2%
For long-term trades look out for resistance drawn above closing.
Please consider these ideas for educational purpose
See all ideas
Summarizing what the indicators are suggesting.
Oscillators
Neutral
Oscillators
Neutral
Summary
Neutral
Summary
Neutral
Summary
Neutral
Moving Averages
Neutral
Moving Averages
Neutral
Displays a symbol's price movements over previous years to identify recurring trends.