MANA started to build a clear upward movement! What's Next?MANA started to build a clear upward movement! What's Next?
With the BTC price recovery, all altcoins started to change direction again.
MANA has so far increased by almost +28%, which is quite small compared to the moves that many altcoins have already made.
If the price maintains the bullish trend that has started soon, we could see MANA reach the first and most important resistance zone or target at 0.1000.
If MANA breaks through the first zone, then it should easily reach 0.1165. This is also another strong zone and a breakout of this zone could pave the way for a bigger target near 0.1650.
You can find more details on the chart.
Thank you! ๐
โ ๏ธPS: Do your own analysis and use your own strategy to join the trade.
โค๏ธ If this analysis helps your trading day, please support it with a like or comment โค๏ธ
In-depth trading ideas
๏ปฟmanausdt longInstructions:
Entry point: yellow
Stop loss: red
Take profit: green
๐Leverage x 5-10-20 for crypto
๐Leverage x 20-50-100 for commodities, stocks, indices, and forex
๐Margin 1-5% max.
Always practice risk and money management.
Invest a maximum of 5% on any trade or across all your trades.
Invest only what you can afford to lose, as no one is in control of the market.
๐Our analyses are primarily based on:
breakouts: two trend lines (ascending and descending) and a line indicating a horizontal breakout.
chart patterns: shoulders and head, triangle parttern,ย elliott impulse, etc etc.
We don't always have the time to track them at all times or to represent them visibly, given the numerous signals, the number of channels to manage, and especially because of the often rapid pace of market movements.
indicators: We associate at least two indicators with this technique.
๐Depending on the circumstances, we use specific indicators, often setting 3 or more take profit levels.
๐Indeed, there are good days in trading and also bad days. No one can promise to win every trade, and like all traders worldwide, we also experience stop-loss orders. However, we win more than we lose and remain positive.
๐You can close the position before or after the take profit orders indicated by the green lines if you are personally satisfied; the same applies to stop loss orders.
๐We must stay positive, clear-headed, and humble.
we cannot provide all instructions or all trades here on this channel.
Good luck to us all, and may God guide us. Amen.
#MANAUSDT โ> Symmetrical Triangle Breakout#MANA
The price is moving within a descending channel on the 1-hour timeframe and has reached the lower boundary. It is now poised for a bounce and is expected to retest this boundary.
The Relative Strength Index (RSI) indicates a downward trend, which is likely to continue given the overbought conditions.
A key support zone has been identified in green at 0.0580. The price has bounced off this zone several times, making it a strong support level.
The price is trending towards the 100-period moving average, which we are approaching. This trend supports an upward move.
Entry Price: 0.0628
First Target: 0.0646
Second Target: 0.0665
Third Target: 0.0692
You can close at the second target or wait for the third target. The choice is yours.
Stop Loss: At the resistance zone in green.
Remember this simple rule: Money Management.
Any questions? Please leave a comment.
Thank you.
MANA/USDT H1: Flat movement amid mixed market conditions๐ฏ TP1: $0.064897 (+0.62%) โ TP2: $0.065195 (+1.08%)
๐ SL: $0.063868 (-0.98%) โ R/R: 1 : 1.1
โ ๏ธ SL is placed beyond the nearest candle tails to reduce the risk of accidental triggering
FUNDAMENTAL BACKGROUND
MANA is showing sideways movement in the absence of fresh project news, following the general sentiment of the crypto market. The mixed backdrop for altcoins is due to pressure on Bitcoin and the fear index in the negative zone. The US Producer Price Index (PPI) data released on 13.08.2026 had no significant impact on the crypto market, leaving MANA without clear drivers.
TECHNICAL PICTURE
The price is fluctuating around a cluster of moving averages (EMA 20 and EMA 50 at $0.06), confirming the flat nature of the market. ADX 34.7 indicates a strong trend with a buyer advantage, but the current consolidation in the narrow range of $0.06248โ$0.06711 limits the potential for movement. VWAP $0.06 acts as a key balance level.
PROBABILITY MODEL
The probability of sideways continuation is 43%, which aligns with the current technical picture. The model estimates a 33% chance of a bullish scenario and a 23% chance of a bearish reversal. The model's confidence is moderate (50%), given the lack of clear signals.
DIRECTION
๐ข BUY on testing the support at $0.06248 with the aim of trading the flat range.
Decentraland Tests Support, Lower Next ?Decentraland (MANA) remains under significant bearish pressure as price continues to trade within a well-defined descending channel.
The broader market structure remains negative, with sellers maintaining control through a series of lower highs and lower lows. While the current daily support is still holding, it is beginning to show signs of weakness, making this a critical area to monitor in the coming sessions.
The immediate focus is on the current weak low. If price sweeps this level and reaches the lower boundary of the descending channel, it could provide the conditions for a technical rebound. Channel support often acts as a reaction zone where buyers step in, increasing the probability of a rotational move back toward the upper boundary of the channel.
However, it is important to distinguish this potential rally from a trend reversal. Any bounce from channel support would still be considered a corrective move within the broader bearish trend unless price can break above the channel and reclaim key resistance levels.
For now, the technical outlook remains cautious. The descending channel continues to define market structure, and sellers retain the advantage while price remains trapped within it. A rotation from the lower channel support toward the highs is a realistic short-term scenario, but until the bearish structure is broken, rallies are likely to be viewed as temporary recoveries rather than the beginning of a sustained bullish trend.
MANA USDT SHORT SIGNAL#119. MANA/USDT โ Trade Setup (SHORT)
๐ Position Type: SHORT
๐ Timeframe: 1H
๐ Market: Futures
๐ฐ Entry Zone:
0.06972
๐ Stop-Loss:
0.072
๐ฏ Take-Profit Targets:
โข TP1:ย 0.06825
โข TP2: 0.06653
โข TP3: 0.06494
โข TP4: 0.06341
โ๏ธ Leverage:
5 *10
โซ๏ธ After TP1, move SL to Entry + 0.2%.
โช๏ธ Exit Plan:
โข 50% at TP1
โข 25% at TP2
โข 25% at TP3
ย
๐ Risk Management:
Risk only 1โ2% of your capital per trade.
โ ๏ธ Always check and confirm the setup on your chart before entering the trade.
MANA is expected to drop soon (4H)It appears that STRAT has completed a triangle pattern from the point highlighted on the chart.
As long as the price remains below the supply zone, we expect a similar-degree price-time pattern to develop, pushing the price lower.
The targets are marked on the chart.
At the first target, move your stop loss to break-even and secure partial profits.
If you have a coin or altcoin you want analyzed, first hit the like button and then comment its name so I can review it for you.
Do you also think MANA is bullish?
MANA USDT LONG SIGNAL#111 MANA/USDT โ Trade Setup (LONG)
๐ Position Type: LONG
๐ Timeframe: 1H
๐ Market: Futures
๐ฐ Entry Zone:
0.06870
๐ Stop-Loss:
0.06645
๐ฏ Take-Profit Targets:
โข TP1:ย 0.06988
โข TP2: 0.07160
โข TP3: 0.07360
โข TP4: 0.07574
โ๏ธ Leverage:
5 *10
โซ๏ธ After TP1, move SL to Entry + 0.2%.
โช๏ธ Exit Plan:
โข 40% at TP1
โข 20% at TP2
โข 20% at TP3
ย 20% at. TP4
๐ Risk Management:
Risk only 1โ2% of your capital per trade.
โ ๏ธ Always check and confirm the setup on your chart before entering the trade.
MANAUSDT: AB=CD Pattern Signals More Downside?#MANA continues to respect its bearish market structure, with sellers firmly in control. On the 1-hour timeframe, price is developing a Bearish AB=CD Harmonic Pattern, indicating that another leg lower could be approaching.
Analysis Timeframe: 1H
Bias: Bearish ๐ด
However, there is currently no bullish confirmation on the chart. Trying to catch a bottom in a strong downtrend can be risky, so patience remains the best strategy.
Trade Plan
Bearish AB=CD pattern is nearing completion.
Overall trend remains bearish.
No bullish divergence or reversal structure has formed.
Waiting for the previous Higher Low (HL) / key support level to break.
A retest of the broken support as resistance will provide the highest-probability short entry.
Entry Strategy
Entry: After support breakdown + successful retest
Stop Loss: Above the retest high or recent swing high
Take Profit: Next major support levels using a minimum 1:2 or better Risk-to-Reward ratio
Risk Management: Never risk more than 1% of your trading capital on a single trade.
Invalidation
If buyers defend the current support and reclaim the previous lower highs, this bearish setup will lose its validity. Until then, the trend continues to favor the sellers.
Key Takeaway
The trend is your friend. Rather than predicting reversals, wait for the market to confirm the breakdown. Trading with confirmation instead of emotion significantly improves consistency over the long run.
What do you think?
Will #MANA break support and continue its downtrend?
Or are the bulls preparing a surprise reversal?
Share your analysis in the comments!
If you found this analysis helpful, please Boost, Like, Comment, and Follow for more high-probability crypto setups and educational market analysis.
#MANA #MANAUSDT #Crypto #Altcoins #TechnicalAnalysis #ABCDPattern #HarmonicTrading #PriceAction #TradingView #CryptoTrading #Bearish #Breakdown #RiskManagement #DayTrading #SwingTrading #SupportResistance #ChartAnalysis #TradeSetup #EliteTechnicalAnalysisHub
MANA: local squeeze with $0.088 destinationThe Macro Picture ๐บ๏ธ
MANA unwound from the $0.10 May high down to $0.0608 in June, then reclaimed ground back to $0.0713. Price is now balancing in the middle of a defined range, coiling between the floor and the decision level as it decides its next leg.
The Setup โ๏ธ
The Range Floor ๐ข
$0.0608 (Macro Support) is the demand base. The June low was defended and price has held above it since โ that's the floor this range pivots on.
The Decision Point ๐ด
$0.0819 (Local High) is the gate. A daily close above it flips the local structure bullish and opens the path to the $0.088 measured-move target.
The Roadmap ๐ฃ๏ธ
Hold equilibrium at $0.0713 โ break $0.0819 โ run toward $0.088. Invalidation is a clean daily close below $0.0608 โ that breaks the range.
This is a GRID Range Play: a defined $0.0608โ0.0819 band to rotate, buying the lower half and scaling out into the breakout.
More setups in profile.
#MANA #Decentraland #crypto #trading #TA #3Commas #GRID
MANA USDT LONG SIGNAL#85. MANA/USDT โ Trade Setup (LONG)
๐ Position Type: LONG
๐ Timeframe: 1 H
๐ Market: Futures
๐ฐ Entry Zone:
0.06951
0.06792
๐ Stop-Loss:
0.06640
๐ฏ Take-Profit Targets:
โข TP1:ย 0.07115
โข TP2:ย 0.07307
โข TP3:ย 0.07545
โข TP4:ย 0.078
TP5:ย 0.08094
TP6:ย
โ๏ธ Leverage:
5- 10
โ ๏ธ After reaching TP1, move Stop-Loss to Entry Price.
๐ Risk Management:
Risk only 1โ2% of your capital per trade.
Always confirm the setup on your chart before entry
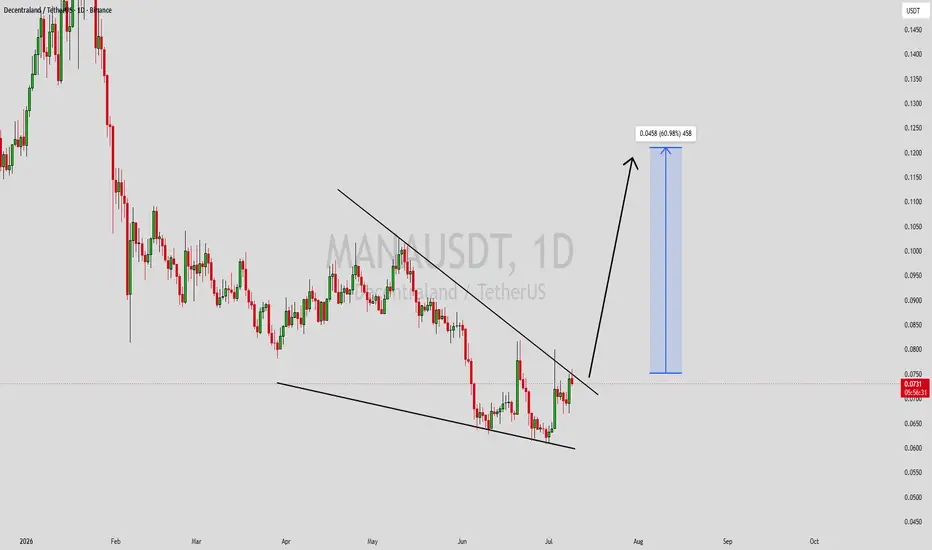
MANAUSDT Forming Falling WedgeMANAUSDT is forming a clear falling wedge pattern, a classic bullish wave signal that often indicates an upcoming breakout. The price has been consolidating within a narrowing range, suggesting that selling pressure is weakening while buyers are beginning to regain control. With consistent volume confirming accumulation at lower levels, the setup hints at a potential bullish breakout soon. The projected move could lead to an impressive gain of around 50% to 60% once the price breaks above the wedge resistance.
This falling wedge pattern is typically seen at the end of downtrends or corrective phases, and it represents a potential shift in market sentiment from bearish to bullish. Traders closely watching MANAUSDT are noting the strengthening momentum as it nears a breakout zone. Good trading volume adds confidence to this pattern, showing that market participants are positioning early in anticipation of a potential reversal.
Investors' growing interest in MANAUSDT reflects rising confidence in the project's long-term fundamentals and its current technical strength. If the breakout confirms with sustained buying volume, this could mark the beginning of a fresh bullish leg. The ongoing consolidation suggests that accumulation is increasing while bearish momentum continues to fade, creating favorable conditions for a sustained move higher.
Traders might find this a valuable setup for medium-term gains, especially as the falling wedge pattern approaches completion and buying momentum continues to build. A confirmed breakout above resistance could attract additional buyers and potentially push the price toward its projected upside target in the coming weeks.
โ
Show your support by hitting the like button!
โ
Leave a comment below! (What is your opinion about this coin?)
Your feedback and engagement keep me inspired to share more insightful market analysis with you!
MANA USDT LONG SIGNALMANA/USDT โ Trade Setup (LONG)
๐ Position Type: LONG
๐ Timeframe: 1 H
๐ Market: Futures
๐ฐ Entry Zone:
Market
๐ Stop-Loss:
0.0620
๐ฏ Take-Profit Targets:
โข TP1:ย 0.0650
โข TP2:ย 0.0665
โข TP3:ย ย 0.0677
โข TP4:ย
TP5:ย
TP6:ย
โ๏ธ Leverage:
5- 10
โ ๏ธ After reaching TP1, move Stop-Loss to Entry Price.
๐ Risk Management:
Risk only 1โ2% of your capital per trade.
Always confirm the setup on your chart before entry
MANA USDT SHORT SIGNALMANA/USDT โ Trade Setup (SHORT)
๐ Position Type: short
๐ Timeframe: 1 H
๐ Market: Futures
๐ฐ Entry Zone:
0.0705
๐ Stop-Loss:
0.0722
๐ฏ Take-Profit Targets:
โข TP1:ย 0.0696
โข TP2:ย 0.0683
โข TP3:ย 0.0669
โข TP4:ย 0.0655
TP5:
โ๏ธ Leverage:
5โ10
โ ๏ธ After reaching TP1, move Stop-Loss to Entry Price.
๐ Risk Management:
Risk only 1โ2% of your capital per trade.
Always confirm the setup on your chart before entry
MANA/USDT - Descending Trendline, Breakout or Rejection?On the MANA/USDT 2-Day (2D) timeframe, price remains in a medium-to-long-term downtrend, clearly defined by a Descending Trendline (yellow trendline) that has been suppressing price action for several months.
At the moment, price is testing this trendline after forming a series of minor higher lows from the recent bottom area. This condition indicates increasing buying interest and opens the possibility of a bullish breakout if the trendline resistance is successfully broken with strong confirmation. ๐
---
๐ Pattern Formation: Descending Trendline
๐ก Descending Trendline
This pattern is formed by a series of lower highs that have continued since the previous peak.
โจ Pattern Characteristics:
โ
Indicates seller dominance over an extended period.
โ
The more frequently the trendline is tested, the weaker the resistance tends to become.
โ
A valid breakout often signals a market structure shift from bearish to bullish.
๐ What We Can See on This Chart:
๐น The trendline has been tested multiple times.
๐น Price is moving closer to the apex of the pattern.
๐น Selling pressure appears weaker compared to earlier stages of the downtrend.
๐น The probability of a breakout increases if supported by strong volume.
---
๐ Bullish Scenario
๐ฏ Key Requirements
Price must:
โ
Break above the Descending Trendline.
โ
Close a 2D candle above the trendline.
โ
Turn the previous resistance area into a new support zone.
๐ If the breakout is confirmed, the following upside targets become possible:
๐ฏ Bullish Targets
๐ฅ First Resistance: $0.0990
๐ฅ Second Resistance: $0.1060
๐ฅ Third Resistance: $0.1180
๐ Major Resistance Target: $0.1680
The $0.1180 area is a critical level because it represents a significant horizontal resistance zone. If this level is successfully broken, the path toward $0.1680 becomes much more likely. ๐
๐ Additional Bullish Confirmations
๐ Increased breakout volume.
๐ Formation of a higher high after the breakout.
๐ Successful retest of the trendline as new support.
---
๐ป Bearish Scenario
Although breakout potential is beginning to emerge, the primary trend remains bearish until a confirmed breakout occurs.
โ ๏ธ Bearish If:
โ Price fails to break the trendline.
โ Strong rejection occurs at trendline resistance.
โ Price falls back below nearby support levels.
๐ฏ Bearish Targets
๐ป Support Area: $0.0680
๐ป Psychological Support: $0.0580
๐ป Major Low Area: $0.0465
If the previous low is broken, the downtrend may continue and open the door for a deeper correction. ๐
---
๐ Conclusion
MANA/USDT is currently at a very interesting stage as price is testing a long-term Descending Trendline that has controlled market direction for several months.
๐ข A breakout above the trendline could trigger a trend reversal toward the $0.0990 โ $0.1680 range.
๐ด Failure to break out may lead price back toward lower support levels and continue the dominant bearish trend.
๐ Traders should focus on waiting for either a confirmed breakout or a clear rejection from the trendline before determining the next major direction.
โก Trade the confirmation, not the prediction.
---
#MANA #MANAUSDT #Decentraland #Crypto #Cryptocurrency #Altcoin #TechnicalAnalysis #CryptoTrading #BullishBreakout #TrendlineBreakout #DescendingTrendline #PriceAction #SupportAndResistance #BullishScenario #BearishScenario #MarketStructure #CryptoAnalysis #Altcoins
MANA Is About To Explode After This Wyckoff Accumulation? Yello Paradisers, are you ready for what could become one of the cleanest Wyckoff accumulation breakouts on #MANA before the majority even realizes what is happening? The current structure is showing strong signs that smart money may already be accumulating quietly while retail traders continue doubting the move.
๐#MANAUSDT printed a very clean Wyckoff accumulation structure with textbook confirmations visible across the entire range. The market first formed a Selling Climax, followed by an Automatic Rally, showing the first aggressive reaction from buyers after panic selling exhausted itself. Price then entered a consolidation phase where the Secondary Test confirmed weakening seller pressure.
๐The most important part of the structure came with the Spring below the support. This move likely trapped late sellers and liquidated weak hands before the price quickly reclaimed the range again. This is exactly how smart money accumulation often looks before a larger expansion phase begins.
๐Since reclaiming the range, #MANA has been forming higher lows while holding above the key demand area around $0.0880โ $0.0860. The recent Last Point of Support formation adds even more bullish confirmation to the structure, suggesting buyers are still defending the market aggressively.
๐Right now, the main resistance remains around $0.0905. A clean breakout and confirmation above this level could easily trigger a strong impulsive expansion toward the major supply zone around $0.0950โ$0.0955.
๐ As long as MANA holds above the demand zone, the Wyckoff accumulation scenario remains bullish. Momentum is gradually improving, market structure is strengthening, and the overall reaction from support continues to look constructive.
Strive for consistency, not quick profits. Treat the market as a businessman, not as a gambler.
MyCryptoParadise
iFeel the success๐ด
MANAUSDT โ Descending Resistance Ready to Break?On the 2D timeframe, MANAUSDT is still moving within a medium-term downtrend structure, clearly visible from the descending resistance trendline formed since the September 2025 peak. ๐
However, the price is now starting to show signs of:
โ
Accumulation
โ
Buyers stepping in
โ
Potential reversal formation ๐
After successfully holding the strong support area around:
๐ก๏ธ 0.078 โ 0.088 USDT
This chart shows that sellers are beginning to lose momentum, while buyers are slowly pushing the price toward the key resistance area around:
๐ฏ 0.103 USDT
---
๐ Pattern Formation
๐ป Descending Triangle / Falling Resistance
Price continues to move below a descending trendline that has acted as major resistance for several months. โณ
This pattern often leads to:
โ ๏ธ Bearish continuation if support breaks down
OR
๐ Strong bullish reversal if resistance breakout occurs with high volume ๐ฅ
Right now, MANA is entering a critical phase as price starts pressing against the breakout zone. ๐
---
๐ข Bullish Scenario
If MANA manages to:
โ
Break out and close strongly above 0.103 USDT
โ
Break the yellow descending resistance trendline ๐
โ
Be supported by increasing volume ๐ฅ
Then the next bullish targets could be:
๐ฏ Bullish Targets:
๐ 0.1165 USDT
๐ 0.1340 USDT
๐ 0.1505 USDT
๐ 0.1700 USDT
๐ The 0.1700 area becomes the major target because it represents a key horizontal resistance and previous distribution zone.
๐ The stronger the breakout candle, the bigger the chance for a medium-term trend reversal.
---
๐ด Bearish Scenario
However, if price fails to break out and gets rejected again from the descending resistance:
โ ๏ธ MANA could potentially revisit:
๐ 0.0880 USDT
๐ 0.0780 USDT (main support)
If the low support breaks โ
then the larger bearish structure would remain dominant, opening the possibility for a deeper downtrend continuation. ๐ฉธ
---
๐ Conclusion
MANAUSDT is currently sitting at a major decision zone. โก
Although the downtrend structure is still technically valid, selling pressure appears to be weakening while buyers gradually build reversal momentum. ๐๐
๐The 0.103 USDT area is the key level to watch.
A valid breakout could open the path toward:
๐ A major recovery rally
๐ Fresh bullish momentum
๐ Medium-term trend reversal potential
Traders should wait for:
โ
Breakout confirmation
โ
Increasing volume
โ
Strong candle close above resistance
to avoid fake breakouts. ๐ฏ
---
#MANA #MANAUSDT #Decentraland #Crypto ๐ #Cryptocurrency #Altcoin #TechnicalAnalysis ๐ #TradingView #Bullish ๐ #Breakout #CryptoTrading #Altseason #SupportResistance #ChartAnalysis #CryptoMarket #TrendlineBreakout #Metaverse ๐
MANA Turns Bearish | Is a Drop Coming?Weโve been tracking and counting the wave structure of MANA for some time now.
At this stage, it appears that after the X wave, price has developed either a BAC pattern or possibly a more complex corrective structure. From the current count, wave B seems to be complete, and it most likely formed as a diametric pattern, which often signals the end of a corrective phase before continuation.
From the highlighted red zone, we expect the price to face rejection and move downward toward lower levels. The downside targets are already marked on the chart, providing a clear roadmap for potential price action.
As always, risk management is key once the first target is reached, itโs advisable to move your stop to breakeven to protect your position.
This analysis would be invalidated if a daily candle closes above the defined invalidation level, as that would suggest the current wave count is no longer in play.
If you have a symbol you want analyzed, first hit the like button and then comment its name so I can review it for you.
Do you also think MANA is bearish?
MANA Bullish Reversal Setup-Inverse H&S on 4HโBreakout Incoming?Description:
#MANA is showing a strong bullish reversal structure on the 4H timeframe, forming a clean Inverse Head & Shoulders pattern. The left shoulder and head are already completed, and price is currently developing the right shoulder, indicating a potential trend shift. There are no significant bearish signals at the moment, which further strengthens the bullish bias.
The key level to watch is the neckline resistance โ a confirmed breakout above this zone could trigger a strong upward move. The plan is to wait for a solid breakout and possible retest of the neckline before entering a long position, ensuring proper risk management with defined stop loss and targets.
This setup offers a high-probability opportunity if market structure aligns with momentum on breakout. Patience is key โ let the market confirm before execution.
#MANA #CryptoTrading #TechnicalAnalysis #Breakout #InverseHeadAndShoulders #Altcoins #TradingView #BullishSetup #SmartMoney #PriceAction
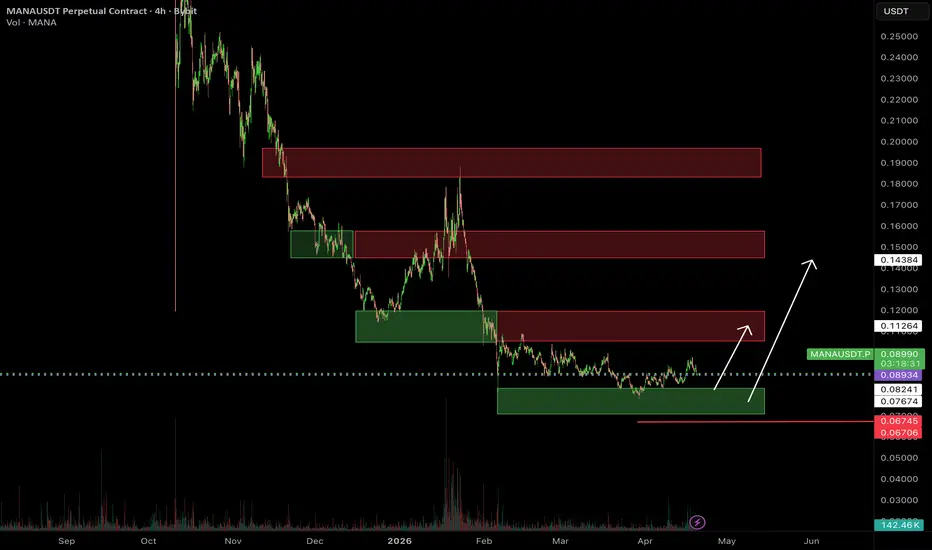
#MANA - LONG IVZ๐ #MANA LONG - IVZ
๐ #MANA has exited the monthly support zone based on the IVZ indicator. Like most other coins from the TOP-50, MANA has not yet tested the resistance zone at 0.10435-0.11900
๐ Entry Points (on pullback):
โข Entry 1: 0.08500
โข Entry 2: 0.07420
โ ๏ธ Risk Management:
๐ด Stop-Loss: 0.06745
๐ฐ Risk per trade: 2-5% of deposit
๐ฏ Targets (Take Profit):
โข TP1: 0.10435 50% of position. Upon reaching TP1 โ move stop to breakeven
โข TP2: 0.11900 Remaining position
๐ Trade Horizon: 2โ4 weeks
๐ Position Type: medium-term / swing
๐ก Important:
This is not a "signal for today".
A position with clear logic, defined levels, and controlled risk.
Don't go "all in" โ follow proper risk management.
If you like the idea โ please rate it ๐
#MANA #LONG #IVZ
MANA: Long-Term Accumulation Zone Signals Potential ReversalMANA: Long-Term Accumulation Zone Signals Potential Reversal
MANA is currently trading at a very important long-term support area that has been respected multiple times in the past. This zone dates back to August 2020 and has also acted as a strong reaction level in December 2022, October 2023, and August 2024, confirming its significance.
Price is now back inside this historical demand zone, where selling pressure has started to weaken.
MANA remains in a broad range, but the current price action suggests a possible accumulation phase after a prolonged downtrend.
If this support continues to hold, a bullish recovery could start gradually.
The first upside reaction is expected toward 0.2160, followed by 0.3488 and 0.5400. A stronger bullish continuation could open the path toward the higher resistance zone near 0.7730 โ 0.8219, which has previously acted as a major rejection area.
You can find more details on the chart.
Thank you and good luck! ๐
โ ๏ธPS: Do your own analysis and use your own strategy to join the trade.
โค๏ธ If this analysis helps your trading day, please support it with a like or comment โค๏ธ
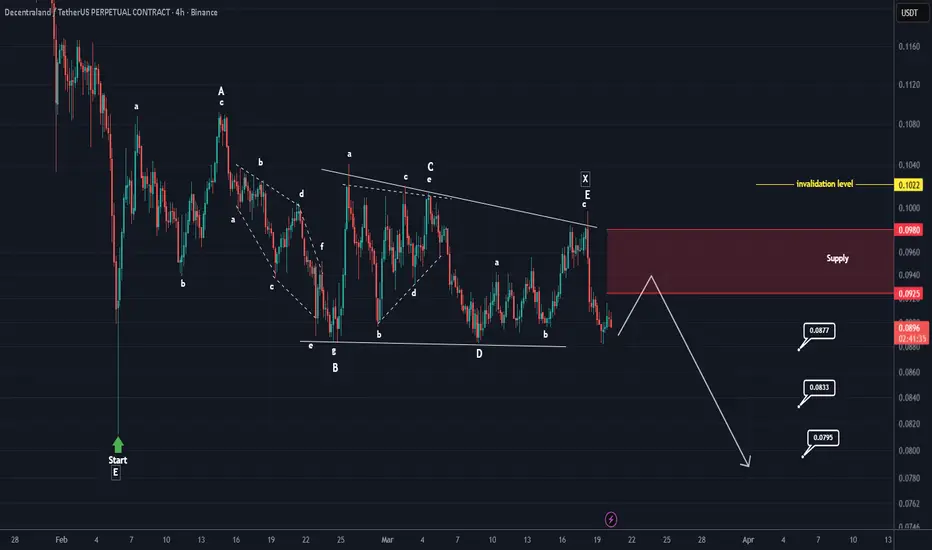
MANA has continued to form a bearish structure (4H)Since we marked the green arrow on the chart and labeled it START, MANA has begun a bullish phase. This phase developed after completing a bearish continuation triangle, and the last wave of this triangle, wave E, has also concluded.
We have identified a clear supply zone. If the price pulls back to this zone, we will look to enter a position. Within the supply zone, it is recommended to enter gradually using DCA (Dollar-Cost Averaging) to manage risk effectively.
The targets are marked on the chart. Once the price reaches the second target, move your stop to break-even to secure the trade.
Keep in mind that a daily candle close above the invalidation level will negate this analysis, so always monitor the chart closely.
If you have a coin or altcoin you want analyzed, first hit the like button and then comment its name so I can review it for you.
What do you think? Is MANA bearish?