MANA: The Roadmap Ahead (8H)It appears that a large Triangle pattern is developing on the MANA chart, with the recent decline representing Wave D. Wave D itself seems to be forming a Diametric structure, and we are currently approaching its final leg, Wave G.
We expect Wave D to potentially complete around the green box, from where the next phase of the larger Triangle, Wave E, could begin to develop. If this scenario plays out, MANA could find support in this area and initiate a recovery.
Another important factor suppor
Decentraland / TetherUS
No trades
No trades
In-depth trading ideas
MANA is likely to maintain its bearish structure (4H)Looking at the current market structure, MANA's correction appears to have started from the point where we placed the red arrow on the chart.
From a NeoWave perspective, this correction seems to be developing as a time-consuming Diametric pattern. At the moment, price appears to be forming wave F of this structure. Based on the current price action, we expect MANA to move towards the marked supply zone, where sellers could step in and trigger a bearish reaction.
If price reacts as expected fro
MANA/USDT Perpetual (8H) UpdateMANA/USDT Perpetual (8H) Update
Price is currently trading at 0.0798, sitting right on the rising support trendline after the recent pullback.Key structure:
• Strong ascending support lines still intact
• Descending resistance from the October high
• Price is compressing into a decision zoneLevels to watch:
• Resistance: 0.0835 – 0.0850 (key zone)
• Support: Rising trendline + 0.0780–0.0790
• Invalidation: Clean break below 0.0760 opens the red zoneBias:
As long as the ascending support hol
MANA Breakout or Rejection?💵 Asset: OTC:MANA #MANA
⏳ Timeframe: 4D (4-Day)
📈 Main Pattern: Descending Channel
🎯 Key Resistance: 0.1150 USDT
🟢 Bullish Targets: 0.1570 → 0.2000 → 0.2350 USDT
🔴 Support & Risk Areas: 0.0850–0.0950 USDT
## 🔎 1. Market Structure Analysis
MANA continues to trade within a Descending Channel, a technical pattern characterized by two downward-sloping, relatively parallel trendlines. The red upper boundary acts as dynamic resistance, while the yellow lower boundary represents dynamic support.
S
MANA/USDT: +200% Macro Expansion SetupDecentraland ( OTC:MANA ) is displaying macro accumulation characteristics as price action compresses inside a massive rounding base above the **$0.28 – $0.31** major demand block. Following prolonged volume exhaustion from sellers and dynamic support holding on higher timeframes, market structure favors a high-volatility breakout. A confirmed H4 close above the primary pivot clears dynamic overhead resistance for a multi-leg rally toward macro supply targets.
A sustained H4 close above the $0.
MET — Bullish Structure Developing | Key Levels to WatchMET — Bullish Structure Developing | Key Levels to Watch for Continuation
MetLife, Inc. (NYSE: MET) is one of the world’s largest insurance and financial-services companies, providing life insurance, employee benefits, retirement solutions and asset-management services across major global markets.
From a fundamental perspective, MET benefits from a diversified business model, recurring insurance revenues and significant exposure to institutional and retirement markets. Interest rates, investme
Strong Buying Opportunity
I believe there is a good buying opportunity here. Price has made a strong move higher and managed to close above multiple supply zones.
As long as this structure remains intact I believe the higher-probability scenario is continued upside and a potential break of the current high.
Watching for further upside. 🚀
MANA started to build a clear upward movement! What's Next?MANA started to build a clear upward movement! What's Next?
With the BTC price recovery, all altcoins started to change direction again.
MANA has so far increased by almost +28%, which is quite small compared to the moves that many altcoins have already made.
If the price maintains the bullish trend that has started soon, we could see MANA reach the first and most important resistance zone or target at 0.1000.
If MANA breaks through the first zone, then it should easily reach 0.1165. This i
MANA/USDT H1: Flat movement amid mixed market conditions🎯 TP1: $0.064897 (+0.62%) │ TP2: $0.065195 (+1.08%)
🛑 SL: $0.063868 (-0.98%) │ R/R: 1 : 1.1
⚠️ SL is placed beyond the nearest candle tails to reduce the risk of accidental triggering
FUNDAMENTAL BACKGROUND
MANA is showing sideways movement in the absence of fresh project news, following the general sentiment of the crypto market. The mixed backdrop for altcoins is due to pressure on Bitcoin and the fear index in the negative zone. The US Producer Price Index (PPI) data released on 13.08.2026 h
Decentraland Tests Support, Lower Next ?Decentraland (MANA) remains under significant bearish pressure as price continues to trade within a well-defined descending channel.
The broader market structure remains negative, with sellers maintaining control through a series of lower highs and lower lows. While the current daily support is still holding, it is beginning to show signs of weakness, making this a critical area to monitor in the coming sessions.
The immediate focus is on the current weak low. If price sweeps this level and r
MANA USDT SHORT SIGNAL#119. MANA/USDT – Trade Setup (SHORT)
📈 Position Type: SHORT
🕒 Timeframe: 1H
📊 Market: Futures
💰 Entry Zone:
0.06972
🛑 Stop-Loss:
0.072
🎯 Take-Profit Targets:
• TP1: 0.06825
• TP2: 0.06653
• TP3: 0.06494
• TP4: 0.06341
⚙️ Leverage:
5 *10
▫️ After TP1, move SL to Entry + 0.2%.
▪️ Exit Plan:
• 50% at TP1
• 25% at TP2
• 25% at TP3
📌 Risk Management:
Risk only 1–2% of your capital per trade.
⚠️ Always check and confirm the setup on your chart before entering the trade.
MANA is expected to drop soon (4H)It appears that STRAT has completed a triangle pattern from the point highlighted on the chart.
As long as the price remains below the supply zone, we expect a similar-degree price-time pattern to develop, pushing the price lower.
The targets are marked on the chart.
At the first target, move your stop loss to break-even and secure partial profits.
If you have a coin or altcoin you want analyzed, first hit the like button and then comment its name so I can review it for you.
Do you also thi
MANA USDT LONG SIGNAL#111 MANA/USDT – Trade Setup (LONG)
📈 Position Type: LONG
🕒 Timeframe: 1H
📊 Market: Futures
💰 Entry Zone:
0.06870
🛑 Stop-Loss:
0.06645
🎯 Take-Profit Targets:
• TP1: 0.06988
• TP2: 0.07160
• TP3: 0.07360
• TP4: 0.07574
⚙️ Leverage:
5 *10
▫️ After TP1, move SL to Entry + 0.2%.
▪️ Exit Plan:
• 40% at TP1
• 20% at TP2
• 20% at TP3
20% at. TP4
📌 Risk Management:
Risk only 1–2% of your capital per trade.
⚠️ Always check and confirm the setup on your chart before entering the trad
MANAUSDT: AB=CD Pattern Signals More Downside?#MANA continues to respect its bearish market structure, with sellers firmly in control. On the 1-hour timeframe, price is developing a Bearish AB=CD Harmonic Pattern, indicating that another leg lower could be approaching.
Analysis Timeframe: 1H
Bias: Bearish 🔴
However, there is currently no bullish confirmation on the chart. Trying to catch a bottom in a strong downtrend can be risky, so patience remains the best strategy.
Trade Plan
Bearish AB=CD pattern is nearing completion.
Overall tr
MANA: local squeeze with $0.088 destinationThe Macro Picture 🗺️
MANA unwound from the $0.10 May high down to $0.0608 in June, then reclaimed ground back to $0.0713. Price is now balancing in the middle of a defined range, coiling between the floor and the decision level as it decides its next leg.
The Setup ⚙️
The Range Floor 🟢
$0.0608 (Macro Support) is the demand base. The June low was defended and price has held above it since — that's the floor this range pivots on.
The Decision Point 🔴
$0.0819 (Local High) is the gate. A daily c
MANA USDT LONG SIGNAL#85. MANA/USDT – Trade Setup (LONG)
📈 Position Type: LONG
🕒 Timeframe: 1 H
📊 Market: Futures
💰 Entry Zone:
0.06951
0.06792
🛑 Stop-Loss:
0.06640
🎯 Take-Profit Targets:
• TP1: 0.07115
• TP2: 0.07307
• TP3: 0.07545
• TP4: 0.078
TP5: 0.08094
TP6:
⚙️ Leverage:
5- 10
⚠️ After reaching TP1, move Stop-Loss to Entry Price.
📌 Risk Management:
Risk only 1–2% of your capital per trade.
Always confirm the setup on your chart before entry
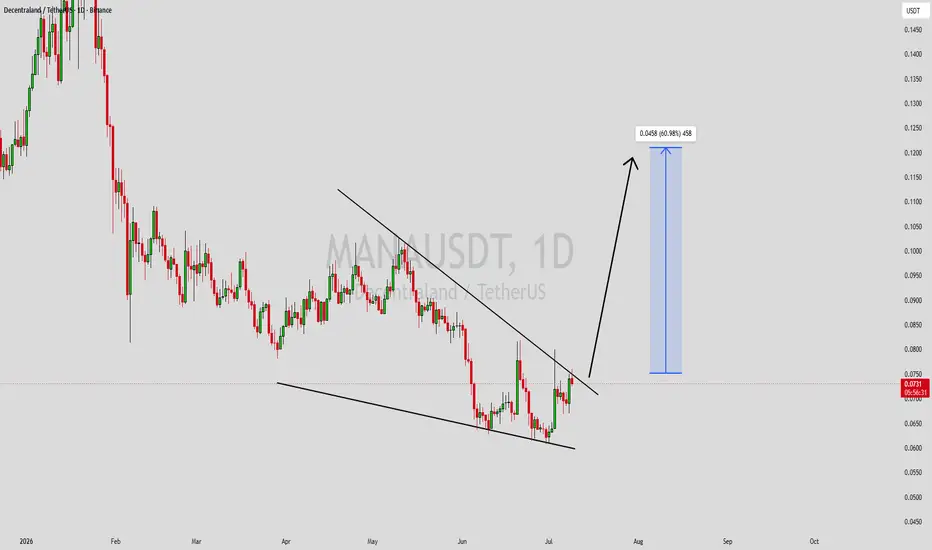
MANAUSDT Forming Falling WedgeMANAUSDT is forming a clear falling wedge pattern, a classic bullish wave signal that often indicates an upcoming breakout. The price has been consolidating within a narrowing range, suggesting that selling pressure is weakening while buyers are beginning to regain control. With consistent volume confirming accumulation at lower levels, the setup hints at a potential bullish breakout soon. The projected move could lead to an impressive gain of around 50% to 60% once the price breaks above the we
MANA USDT LONG SIGNALMANA/USDT – Trade Setup (LONG)
📈 Position Type: LONG
🕒 Timeframe: 1 H
📊 Market: Futures
💰 Entry Zone:
Market
🛑 Stop-Loss:
0.0620
🎯 Take-Profit Targets:
• TP1: 0.0650
• TP2: 0.0665
• TP3: 0.0677
• TP4:
TP5:
TP6:
⚙️ Leverage:
5- 10
⚠️ After reaching TP1, move Stop-Loss to Entry Price.
📌 Risk Management:
Risk only 1–2% of your capital per trade.
Always confirm the setup on your chart before entry
MANA USDT SHORT SIGNALMANA/USDT – Trade Setup (SHORT)
📈 Position Type: short
🕒 Timeframe: 1 H
📊 Market: Futures
💰 Entry Zone:
0.0705
🛑 Stop-Loss:
0.0722
🎯 Take-Profit Targets:
• TP1: 0.0696
• TP2: 0.0683
• TP3: 0.0669
• TP4: 0.0655
TP5:
⚙️ Leverage:
5–10
⚠️ After reaching TP1, move Stop-Loss to Entry Price.
📌 Risk Management:
Risk only 1–2% of your capital per trade.
Always confirm the setup on your chart before entry
MANA/USDT - Descending Trendline, Breakout or Rejection?On the MANA/USDT 2-Day (2D) timeframe, price remains in a medium-to-long-term downtrend, clearly defined by a Descending Trendline (yellow trendline) that has been suppressing price action for several months.
At the moment, price is testing this trendline after forming a series of minor higher lows from the recent bottom area. This condition indicates increasing buying interest and opens the possibility of a bullish breakout if the trendline resistance is successfully broken with strong confirm
MANA Is About To Explode After This Wyckoff Accumulation? Yello Paradisers, are you ready for what could become one of the cleanest Wyckoff accumulation breakouts on #MANA before the majority even realizes what is happening? The current structure is showing strong signs that smart money may already be accumulating quietly while retail traders continue doubting the move.
💎#MANAUSDT printed a very clean Wyckoff accumulation structure with textbook confirmations visible across the entire range. The market first formed a Selling Climax, followed by an Au
MANAUSDT — Descending Resistance Ready to Break?On the 2D timeframe, MANAUSDT is still moving within a medium-term downtrend structure, clearly visible from the descending resistance trendline formed since the September 2025 peak. 📉
However, the price is now starting to show signs of:
✅ Accumulation
✅ Buyers stepping in
✅ Potential reversal formation 🚀
After successfully holding the strong support area around:
🛡️ 0.078 – 0.088 USDT
This chart shows that sellers are beginning to lose momentum, while buyers are slowly pushing the price towar