MANTA: local squeeze with $0.0857 destinationThe Macro Picture 🗺️
MANTA has been rotating in a range, and after a dip toward the lows it has reclaimed ground to $0.06420, holding above the $0.05911 local-low shelf. Price is coiling in the lower half of the band as it sets up the next move.
The Setup ⚙️
The Range Floor 🟢
$0.05435 (Macro Supp
MANTAUSDT: Exhaustion Rally? Short Setup at Key ResistanceMANTAUSDT has rallied aggressively into a major resistance zone after a strong bullish run. Momentum is slowing, making this an interesting area to watch for a potential pullback.
A rejection from the current level could send the price toward 0.06247, while a break above 0.06504 would invalidate th
MANTA / MANTAUSDT Bullish Setup | Futures Trade IdeaMARKET ANALYSIS
MANTA is currently reacting from a key technical area highlighted on the chart.
As long as the protected support zone remains intact, the bullish market structure remains valid and higher liquidity targets may continue to attract price action.
A breakdown below the invalidation
MANTA Ready for a 25% CorrectionAfter a strong rally, MANTA could be approaching a zone where traders start taking profits.
🔹 Momentum appears stretched
🔹 Profit-taking pressure may increase
🔹 A healthy 20–25% pullback wouldn’t be unusual after such a move
The bigger trend remains intact unless key support levels break, but caut
MANTAUSDT Forming Bullish MomentumMANTAUSDT is forming a clear bullish momentum pattern, a classic bullish wave signal that often indicates an upcoming breakout. The price has been consolidating within a narrowing range, suggesting that selling pressure is weakening while buyers are beginning to regain control. With consistent volum
MANTAUSDT Forming Falling WedgeMANTAUSDT is forming a clear falling wedge pattern, a classic bullish wave signal that often indicates an upcoming breakout. The price has been consolidating within a narrowing range, suggesting that selling pressure is weakening while buyers are beginning to regain control. With consistent volume c
#MANTAUSDT may continue its trend after correction#MANTA
The price is moving within an ascending channel on the 1-hour timeframe and has reached the lower boundary, heading towards a breakout. A retest of this boundary is expected.
The Relative Strength Index (RSI) indicates a downward trend, and this trend is likely to continue due to the overbo
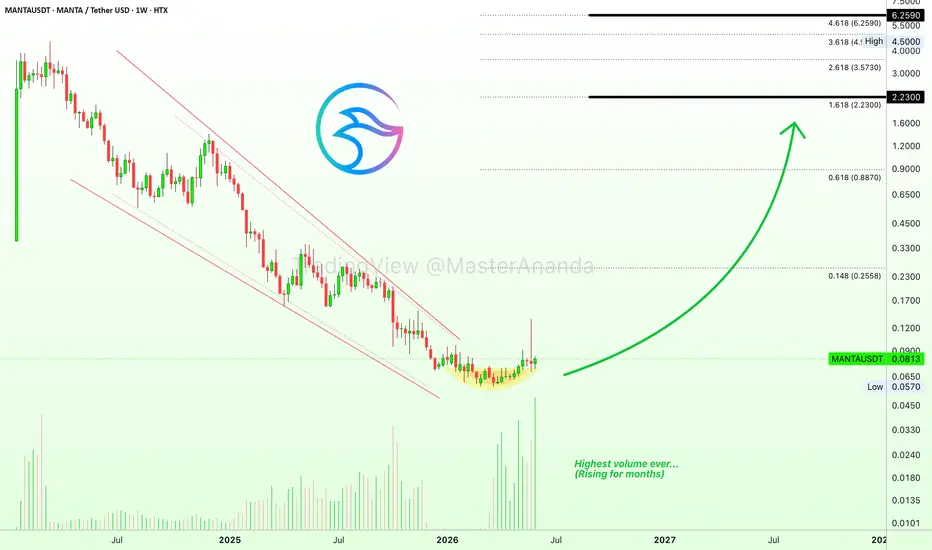
Manta Network: Bottom in, confirmed through highest volume everThis one can be kept extremely simple. MANTAUSDT (Manta Network) ended a bear market and is now starting a bull market, 100% confirmed through the volume signal, the chart structure and pattern. It dropped for two years, March 2024 through March 2026. It can grow for years to come.
The length of th
#MANTAUSDT – Bullish Setup Alert ?
#MANTA
The price is moving within a descending channel on the hourly timeframe. It has reached the lower boundary and is trending towards a bounce. A retest of this boundary is expected.
The Relative Strength Index (RSI) indicates a downward trend, and this trend is likely to continue due to the
MANTA: When modular ZK token meets trend breakoutManta Network builds an ecosystem of two blockchains: Manta Pacific is an L2 on Ethereum for ZK applications, and Manta Atlantic is an L1 on Polkadot for private identities. The project trades on Binance, and everyone who understands privacy and scalability is watching because this is no longer abo
See all ideas
Summarizing what the indicators are suggesting.
Oscillators
Neutral
SellBuy
Strong sellStrong buy
Strong sellSellNeutralBuyStrong buy
Oscillators
Neutral
SellBuy
Strong sellStrong buy
Strong sellSellNeutralBuyStrong buy
Summary
Neutral
SellBuy
Strong sellStrong buy
Strong sellSellNeutralBuyStrong buy
Summary
Neutral
SellBuy
Strong sellStrong buy
Strong sellSellNeutralBuyStrong buy
Summary
Neutral
SellBuy
Strong sellStrong buy
Strong sellSellNeutralBuyStrong buy
Moving Averages
Neutral
SellBuy
Strong sellStrong buy
Strong sellSellNeutralBuyStrong buy
Moving Averages
Neutral
SellBuy
Strong sellStrong buy
Strong sellSellNeutralBuyStrong buy
Displays a symbol's price movements over previous years to identify recurring trends.