MANTA: local squeeze with $0.0857 destinationThe Macro Picture 🗺️
MANTA has been rotating in a range, and after a dip toward the lows it has reclaimed ground to $0.06420, holding above the $0.05911 local-low shelf. Price is coiling in the lower half of the band as it sets up the next move.
The Setup ⚙️
The Range Floor 🟢
$0.05435 (Macro Support) is the demand base, with $0.05911 (Local Low) as the nearer shelf. Both have held, and that's the floor this range pivots on.
The Decision Point 🔴
$0.07278 (Local High) is the gate. A daily close above it flips the local structure bullish and opens the path to the $0.08572 measured-move target.
The Roadmap 🛣️
Hold above $0.05911 → break $0.07278 → run toward $0.08572. Invalidation is a clean daily close below $0.05435 — that breaks the range.
This is a GRID Range Play: a defined band to rotate, buying the lower half and scaling out into the breakout.
More setups in profile.
#MANTA #MantaNetwork #crypto #trading #TA #3Commas #GRID
In-depth trading ideas
MANTAUSDT: Exhaustion Rally? Short Setup at Key ResistanceMANTAUSDT has rallied aggressively into a major resistance zone after a strong bullish run. Momentum is slowing, making this an interesting area to watch for a potential pullback.
A rejection from the current level could send the price toward 0.06247, while a break above 0.06504 would invalidate the bearish setup.
Trade Setup
Entry: 0.06444
Target: 0.06247
Stop Loss: 0.06504
I'll wait for bearish confirmation and increasing selling volume before expecting continuation.
MANTA / MANTAUSDT Bullish Setup | Futures Trade IdeaMARKET ANALYSIS
MANTA is currently reacting from a key technical area highlighted on the chart.
As long as the protected support zone remains intact, the bullish market structure remains valid and higher liquidity targets may continue to attract price action.
A breakdown below the invalidation level would weaken the current bullish scenario and require a reassessment of market conditions.
📍 Entry, Stop Loss and Take Profit levels are marked directly on the chart.
━━━━━━━━━━━━━━
⚠️ DISCLAIMER
This publication is provided solely for educational and market observation purposes.
Nothing contained in this analysis should be considered financial advice, investment advice, or a recommendation to buy or sell any financial instrument.
All trading and investment decisions remain solely the responsibility of the individual trader.
Always conduct your own research and apply proper risk management before entering any position.
━━━━━━━━━━━━━━
🎯 PARALOG
▪️Crypto Market Analysis
▪️BTC Futures Signals
▪️Bitcoin & Altcoin Market Analysis
Precision • Momentum • Timing
━━━━━━━━━━━━━━
Exchange: #MEXC Futures
#bitcoin #btc #crypto #futures #technicalanalysis
MANTA Ready for a 25% CorrectionAfter a strong rally, MANTA could be approaching a zone where traders start taking profits.
🔹 Momentum appears stretched
🔹 Profit-taking pressure may increase
🔹 A healthy 20–25% pullback wouldn’t be unusual after such a move
The bigger trend remains intact unless key support levels break, but caution is warranted in the short term.
Are you buying the dip or expecting more downside? 👇
MANTAUSDT Forming Bullish MomentumMANTAUSDT is forming a clear bullish momentum pattern, a classic bullish wave signal that often indicates an upcoming breakout. The price has been consolidating within a narrowing range, suggesting that selling pressure is weakening while buyers are beginning to regain control. With consistent volume confirming accumulation at lower levels, the setup hints at a potential bullish breakout soon. The projected move could lead to an impressive gain of around 60% to 70% once the price breaks above the wedge resistance.
This bullish momentum pattern is typically seen at the end of downtrends or corrective phases, and it represents a potential shift in market sentiment from bearish to bullish. Traders closely watching MANTAUSDT are noting the strengthening momentum as it nears a breakout zone. Strong trading volume adds confidence to this pattern, showing that market participants are positioning early in anticipation of a reversal.
Investors’ growing interest in MANTAUSDT reflects rising confidence in the project's long-term fundamentals and current technical strength. If the breakout confirms with sustained volume, this could mark the start of a fresh bullish leg. The ongoing accumulation phase suggests that buyers are gradually taking control, while weakening selling pressure creates favorable conditions for a sustained upward move.
Traders might find this a valuable setup for medium-term gains, especially as the bullish momentum pattern approaches completion and buying momentum accelerates. A confirmed breakout above resistance could attract additional market participation and potentially drive the price toward its projected upside target over the coming weeks.
✅ Show your support by hitting the like button!
✅ Leave a comment below! (What is your opinion about this coin?)
Your feedback and engagement keep me inspired to share more insightful market analysis with you!
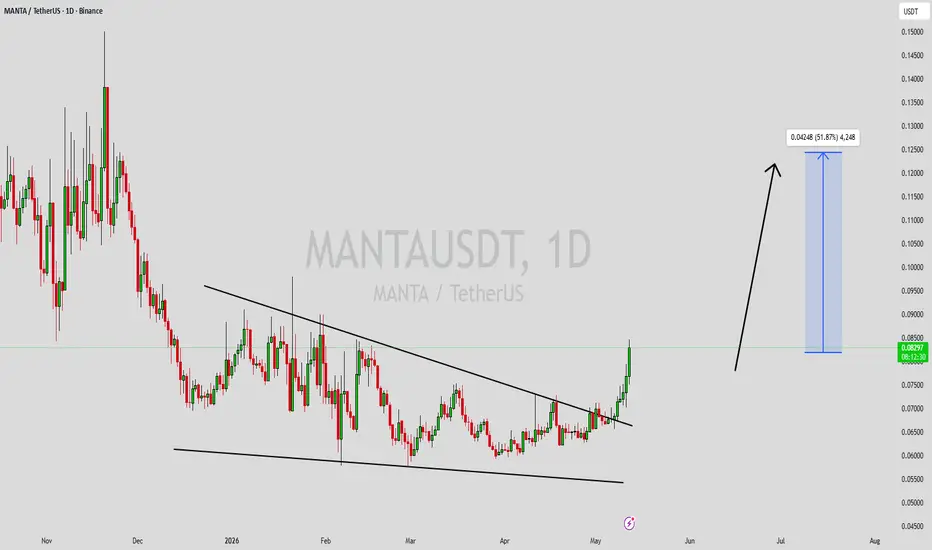
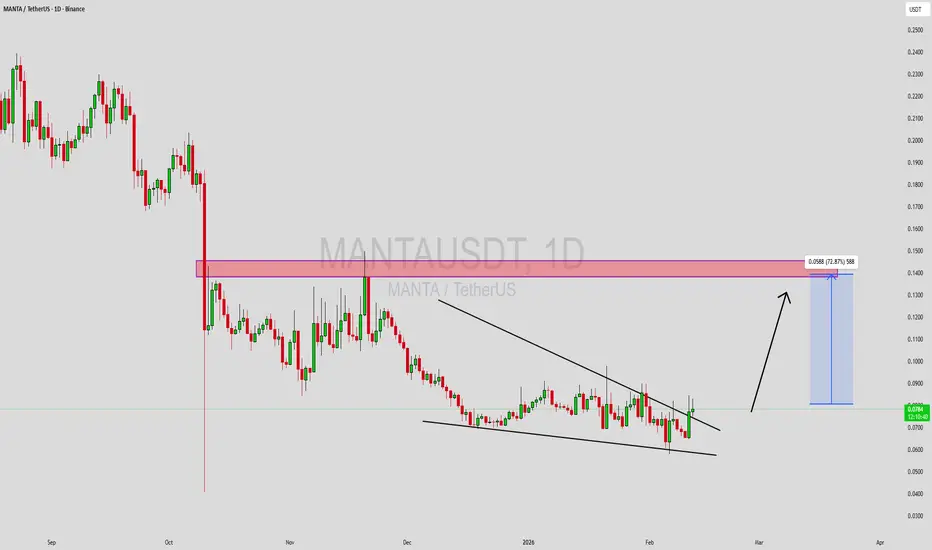
MANTAUSDT Forming Falling WedgeMANTAUSDT is forming a clear falling wedge pattern, a classic bullish wave signal that often indicates an upcoming breakout. The price has been consolidating within a narrowing range, suggesting that selling pressure is weakening while buyers are beginning to regain control. With consistent volume confirming accumulation at lower levels, the setup hints at a potential bullish breakout soon. The projected move could lead to an impressive gain of around 30% to 40% once the price breaks above the wedge resistance.
This falling wedge pattern is typically seen at the end of downtrends or corrective phases, and it represents a potential shift in market sentiment from bearish to bullish. Traders closely watching MANTAUSDT are noting the strengthening momentum as it nears a breakout zone. Strong trading volume adds confidence to this pattern, showing that market participants are positioning early in anticipation of a reversal.
Investors’ growing interest in MANTAUSDT reflects rising confidence in the project's long-term fundamentals and current technical strength. If the breakout confirms with sustained volume, this could mark the start of a fresh bullish leg. The current price structure suggests that bearish momentum is gradually fading while buyers continue to build strength, creating favorable conditions for a potential trend reversal.
Traders might find this a valuable setup for medium-term gains, especially as the falling wedge pattern approaches completion and buying momentum accelerates. A confirmed breakout could attract additional buying interest and potentially drive the price toward its projected upside target over the coming weeks.
✅ Show your support by hitting the like button!
✅ Leave a comment below! (What is your opinion about this coin?)
Your feedback and engagement keep me inspired to share more insightful market analysis with you!
#MANTAUSDT may continue its trend after correction#MANTA
The price is moving within an ascending channel on the 1-hour timeframe and has reached the lower boundary, heading towards a breakout. A retest of this boundary is expected.
The Relative Strength Index (RSI) indicates a downward trend, and this trend is likely to continue due to the overbought condition.
There is a key resistance zone (in green) at 0.08525, which the price has bounced off several times, making it a strong support level.
A consolidation trend is observed above the 100-period moving average, which we are approaching. This trend supports a decline towards this level.
Entry Price: 0.08000
Target 1: 0.07880
Target 2: 0.07720
Target 3: 0.07511
Stop Loss: At the resistance zone (in green).
Remember this simple rule: Manage your money wisely.
For any questions, please leave a comment.
Thank you.
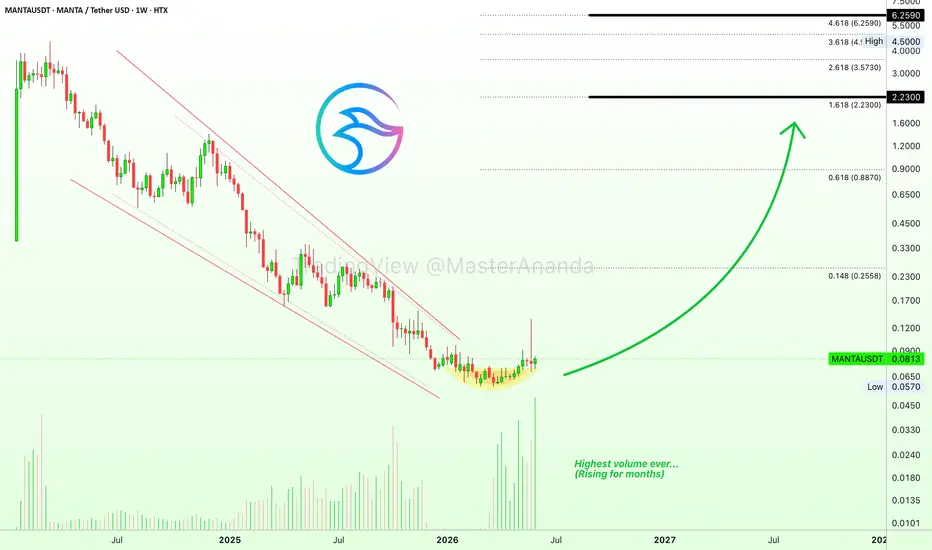
Manta Network: Bottom in, confirmed through highest volume everThis one can be kept extremely simple. MANTAUSDT (Manta Network) ended a bear market and is now starting a bull market, 100% confirmed through the volume signal, the chart structure and pattern. It dropped for two years, March 2024 through March 2026. It can grow for years to come.
The length of the new bull market is not limited to the length of the bear market. The bear market lasted two years but the bull market can last 1 year, 2 years, 4 years, 6 years or any amount of time. We will know as things unravel but we are entering uncharted territory, this can be said without a shadow of doubt because many projects are now bullish and advancing while Bitcoin crashes and this has never been seen before.
It is not only this of course, just the evolution of finance, the Internet, AI; technology is changing the way we interact, exchange and behave. Money has never been this easy and free before. It is the first time money becomes decentralized on a global scale. The way the planets are aligned, some aspects and configurations have never been recorded in human history, so we get to experience really new stuff. This month comes with many surprises and change is being experienced in this our Cryptocurrency market.
MANTAUSDT looks great and this is a good choice if you are looking to buy. Those that did poorly in 2025 can move first in 2026. Those that did great in 2025 can be late movers for this cycle. MANTA did nothing in 2025 so watch how it grows. This is a repeating pattern across many altcoins. Some go down while others go up.
Namaste.
#MANTAUSDT – Bullish Setup Alert ?
#MANTA
The price is moving within a descending channel on the hourly timeframe. It has reached the lower boundary and is trending towards a bounce. A retest of this boundary is expected.
The Relative Strength Index (RSI) indicates a downward trend, and this trend is likely to continue due to the overbought condition.
A key support zone (in green) has been identified at 0.07000. The price has bounced off this zone several times, making it a strong support level.
The price is trending towards the 100-period moving average, which we are approaching. This trend supports an upward move.
Entry Price: 0.07512
First Target: 0.07734
Second Target: 0.07974
Third Target: 0.08274
You can close at the second target or wait for the third target to be reached. The choice is yours.
Stop Loss: At the resistance zone (in green).
Remember this simple rule: Money Management.
Any questions? Please leave a comment.
Thank you.
MANTA: When modular ZK token meets trend breakoutManta Network builds an ecosystem of two blockchains: Manta Pacific is an L2 on Ethereum for ZK applications, and Manta Atlantic is an L1 on Polkadot for private identities. The project trades on Binance, and everyone who understands privacy and scalability is watching because this is no longer about technology but about real applications, RWA and yield.
Fundamentals
The project actively develops CeDeFi products that let users earn yield from both CeFi and DeFi simultaneously. APY reaches 17.5 percent for stablecoins, significantly above market average. Total value locked exceeds 500 million dollars.
Positive developments. On April 4 2026 Manta partnered with Celestia, ORA and Hyperbolic to bring AI development to Manta Pacific, covering the full cycle from training to deployment. This turns the platform into a hub for AI applications. In February 2026 a partnership was signed with Pruv Finance to launch tokenized sports infrastructure RWA with APY around 30 percent. The CeDeFi product is positioned as a launchpad for future RWA assets. Token distribution is solid with annual inflation at just 2 percent.
Risks include DeFi market volatility and high competition from other L2 solutions.
Technicals
On the daily chart price broke the descending trendline that had been in place since early 2025. A retest of the broken trendline at 0.065 is recommended for entry. Current price is 0.069. Support sits at 0.065 then 0.06. Resistance sits at 0.083 then 0.09.
Targets from the chart are 0.083 and 0.09 locally, then 0.16, 0.41 and 1.28 globally.
The market values MANTA on its ability to maintain TVL and expand CeDeFi and RWA products. A retest of 0.065 will provide an entry point. The technical breakout is confirmed and targets are above.
MANTAUSDT Forming Falling WedgeMANTAUSDT is forming a clear falling wedge pattern, a classic bullish wave signal that often indicates an upcoming breakout. The price has been consolidating within a narrowing range, suggesting that selling pressure is weakening while buyers are beginning to regain control. With consistent volume confirming accumulation at lower levels, the setup hints at a potential bullish breakout soon. The projected move could lead to an impressive gain of around 40% to 50% once the price breaks above the wedge resistance.
This falling wedge pattern is typically seen at the end of downtrends or corrective phases, and it represents a potential shift in market sentiment from bearish to bullish. Traders closely watching MANTAUSDT are noting the strengthening momentum as it nears a breakout zone. The strong trading volume adds confidence to this pattern, showing that market participants may already be positioning early in anticipation of a reversal.
Investors’ growing interest in MANTAUSDT reflects rising confidence in the project’s long-term fundamentals and current technical strength. If the breakout confirms with sustained volume, this could mark the start of a fresh bullish leg. Traders might find this a valuable setup for medium-term gains, especially as the falling wedge pattern completes and buying pressure accelerates.
✅ Show your support by hitting the like button and
✅ Leaving a comment below! (What is your opinion about this coin?)
Your feedback and engagement keep me inspired to share more insightful market analysis with you!
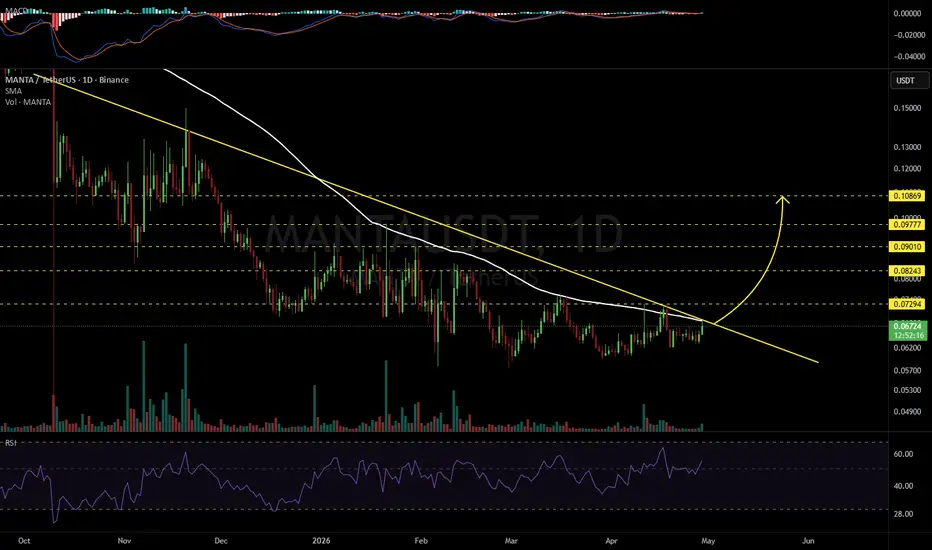
MANTAUSDT 1D#MANTA is on the verge of breaking out above the descending resistance and the daily SMA100. MACD and RSI are showing potential bullish momentum. In case of a breakout, the potential upside targets are:
🎯 $0.07294
🎯 $0.08243
🎯 $0.09010
🎯 $0.09777
🎯 $0.10869
⚠️ Always remember to use a tight stop-loss and maintain proper risk management.
MANTA/USDT – 4H Chart Update. MANTA/USDT – 4H Chart Update
MANTA is trading around $0.069, showing a short-term recovery from the $0.062 demand zone.
Price bounced strongly from the $0.062–$0.064 support area.
The descending trendline resistance is still above the price, limiting the upside.
Price is currently holding above the $0.065 support, which is a positive sign.
📈 Bullish Scenario:
If MANTA breaks above the $0.072–$0.075 resistance, the next targets could be:
$0.080
$0.085
📉 Bearish Scenario:
If the price loses $0.065 support, it may revisit:
$0.062 demand zone
$0.058 lower support
⚠️ Conclusion:
MANTA is showing early recovery signs, but a break above the descending trendline will be needed to confirm stronger bullish momentum. 🚀
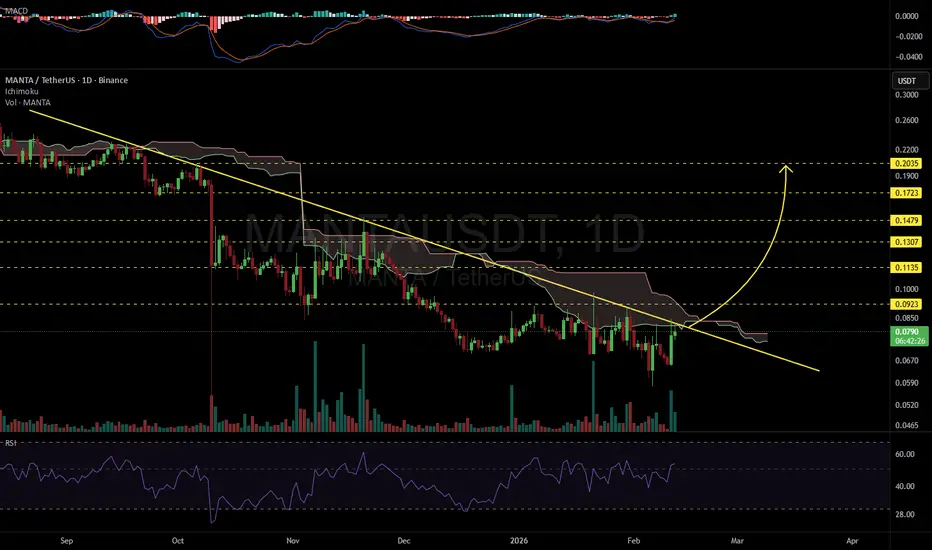
MANTAUSDT 1D#MANTA is trading near the descending resistance and the Ichimoku cloud on the daily timeframe. Entry is recommended only after a clean breakout above both levels. If confirmed, the potential upside targets are:
🎯 $0.0923
🎯 $0.1135
🎯 $0.1307
🎯 $0.1479
🎯 $0.1723
🎯 $0.2035
⚠️ Always apply tight stop-losses and maintain strict risk management.
MANTAUSDT Forming Bullish MomentumMANTAUSDT is forming a clear bullish momentum pattern, a classic bullish wave signal that often indicates an upcoming breakout. The price has been consolidating within a narrowing range, suggesting that selling pressure is weakening while buyers are beginning to regain control. With consistent volume confirming accumulation at lower levels, the setup hints at a potential bullish breakout soon. The projected move could lead to an impressive gain of around 60% to 70% once the price breaks above the wedge resistance.
This bullish momentum pattern is typically seen at the end of downtrends or corrective phases, and it represents a potential shift in market sentiment from bearish to bullish. Traders closely watching MANTAUSDT are noting the strengthening momentum as it nears a breakout zone. The good trading volume adds confidence to this pattern, showing that market participants are positioning early in anticipation of a reversal.
Investors’ growing interest in MANTAUSDT reflects rising confidence in the project’s long-term fundamentals and current technical strength. If the breakout confirms with sustained volume, this could mark the start of a fresh bullish leg. Traders might find this a valuable setup for medium-term gains, especially as the wedge pattern completes and buying momentum accelerates.
✅ Show your support by hitting the like button and
✅ Leaving a comment below! (What is your opinion about this Coin?)
Your feedback and engagement keep me inspired to share more insightful market analysis with you!
MANTAUSDT Forming Falling WedgeMANTAUSDT is forming a clear falling wedge pattern, a classic bullish reversal signal that often indicates an upcoming breakout. The price has been consolidating within a narrowing range following the earlier decline, suggesting that selling pressure is steadily weakening while buyers are gradually stepping in to regain control. With consistent volume confirming accumulation at these lower levels, the setup is building toward a potential bullish breakout in the near future. Once the price breaks decisively above the wedge resistance, the projected move could deliver an impressive gain of around 90% to 100% from the breakout point.
This falling wedge pattern is typically seen at the end of downtrends or during corrective phases, and it serves as a strong sign that market sentiment may be shifting from bearish to bullish. Traders closely watching PORTOUSDT are seeing a similar buildup of momentum as it approaches its own breakout zone. The solid trading volume supporting the pattern adds real confidence, showing that market participants are getting positioned early in anticipation of a reversal.
The growing interest in PORTOUSDT is fueled by increasing optimism about the project's long-term fundamentals combined with this attractive technical picture. If the breakout confirms with sustained volume behind it, this could mark the beginning of a fresh bullish leg. Traders might view this as a high-quality setup for medium-term gains, especially once the wedge pattern fully completes and buying momentum starts to accelerate.
✅ Show your support by hitting the like button and
✅ Leaving a comment below! (What is your opinion about this Coin)
Your feedback and engagement keep me inspired to share more insightful market analysis with you!
MANTA LOOKING STRONG | TECHNICALS BULLISH🔥 Fortune AI Radar — OMXHEX:MANTA
Fresh activity detected on OMXHEX:MANTA today.
Data suggests increasing market interest & buyers stepping in.
Technicals currently lean bullish, with momentum trending upward.
Whales showing hints of accumulation and hype rising among traders.
This coin is flashing strong signals on short-term charts — worth keeping an eye on 👀
Not financial advice — always research before taking decisions
MANTA/USDT – Long Trade Setup (4H). MANTA/USDT – Long Trade Setup (4H)
The price is holding above the rising trendline, indicating a bullish structure.
Strong demand zone around 0.076–0.078, with multiple rejections, buyers are active.
Price is trying to reclaim the 200 MA, which often acts as dynamic support in uptrends.
The overall structure suggests a higher-low formation.
Entry: 0.078 – 0.080 zone
Stop-Loss: Below 0.074
Targets:
T1: 0.085
T2: 0.088 – 0.090 (previous supply/resistance zone)
As long as price holds above the trendline and demand zone, bullish continuation is favored.
A clean breakout above 0.085 can accelerate upside momentum.
⚠️ Manage risk properly. Not financial advice.
#MANTA [RR: 1/5] Price reversal and new growth BINANCE:MANTAUSDT
There is a 5-wave cycle with an elongated 3rd wave and a corrective (protracted) 4th wave.
At the moment, the asset has completed the movement of wave 5 and has shown signs of a reversal in the long direction at the 1.618 extension level.
If we look at W1, we see that the volume nodes (HVN) coincide with the 0.618 Fibonacci retracement level. This adds weight to the argument that the asset has just completed wave 5.
I am considering a move to HVN (0.12), which gives a risk/reward ratio of 1/5.
I do not rule out manipulative movements.
MANTA/USDT – Long Trade Setup (4H)MANTA/USDT – Long Trade Setup (4H)
Structure: Descending wedge/trendline compression
Ichimoku: Price pushing back into the cloud → momentum stabilizing
MA acting as dynamic support
Long Idea
Entry Zone: 0.0725 – 0.0730
Stop Loss: 0.070
Targets:
T1: 0.0760
T2: 0.0790 – 0.0800
DYOR | NFA
Manta at Discount: Two Scenarios From the 10 Oct WickTwo possible paths for BINANCE:MANTAUSDT based on the Fibonacci levels of the long wick left after the 10 October sell‑off.
Price has been in a steady downtrend and is now trading inside a higher‑timeframe demand zone (blue), which lines up with the 50–61.8% retracement of that October wick move. From here the primary scenario is a bullish reversal: accumulation inside this demand, a higher low, and then an impulsive rally into the daily order block (grey), targeting roughly the 0.12–0.16 region where previous range highs and the main volume POC (point of control)
The alternative scenario is a deeper sweep of liquidity. If the first reaction from the blue zone fails, price can extend toward the lower green demand area, close to the 0.786–0.86 retracement of the same wick. A capitulation into this zone would complete a larger discount before a stronger mid‑term reversal, with the same upside targets later at the grey order block and high‑volume cluster. Invalidation is a clean breakdown below the green zone, while take‑profits are staged first around the mid‑range / “monthly high” and then into 0.12–0.16.