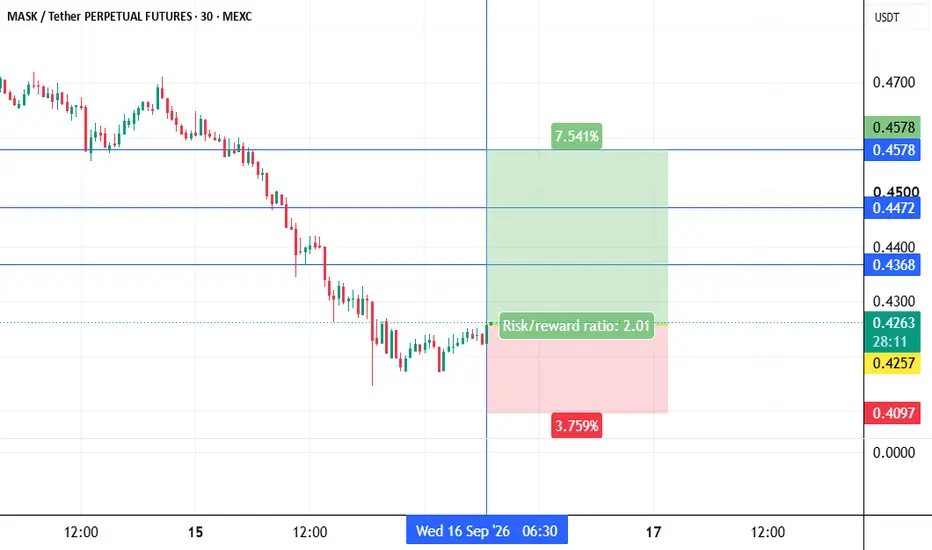
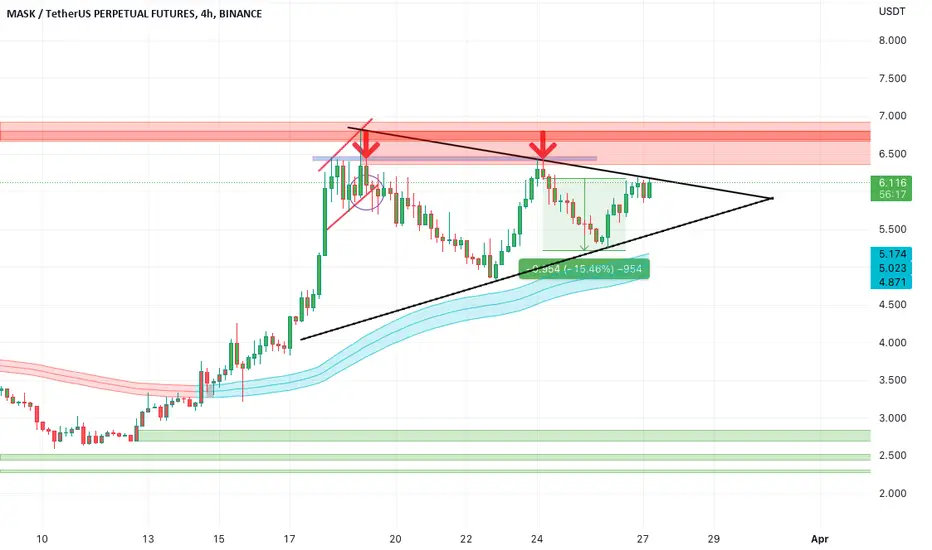
Maskusdt shortINSTRUCTIONS TO READ AND TO FOLLOW:
Entry point: yellow
Stop loss: red
Take profit: green or blue
👉Leverage x 5-10-20 for crypto
👉Leverage x 20-50-100 for commodities, stocks, indices, and forex
👉Margin 1-5% max:
This limits your maximum loss to 5% and guarantees that you retain 95% of your portfolio in the event of a stop-loss.
🔥🔥🔥🔥🔥🔥🔥🔥🔥🔥🔥🔥🔥🔥
ALWAYS PRACTICE RISK AND MONEY MANAGEMENT:
🔥🔥🔥🔥🔥🔥🔥🔥🔥🔥🔥🔥🔥🔥
👉Invest a maximum of 5% on any trade or across all your trades.
Invest only what you can aff
In-depth trading ideas
maskusdt longInstructions:
Entry point: yellow
Stop loss: red
Take profit: green or blue
👉Leverage x 5-10-20 for crypto
👉Leverage x 20-50-100 for commodities, stocks, indices, and forex
👉Margin 1-5% max.
Always practice risk and money management.
Invest a maximum of 5% on any trade or across all your trades.
Invest only what you can afford to lose, as no one is in control of the market.
👉Our analyses are primarily based on:
breakouts: two trend lines (ascending and descending) and a line indicating a hor
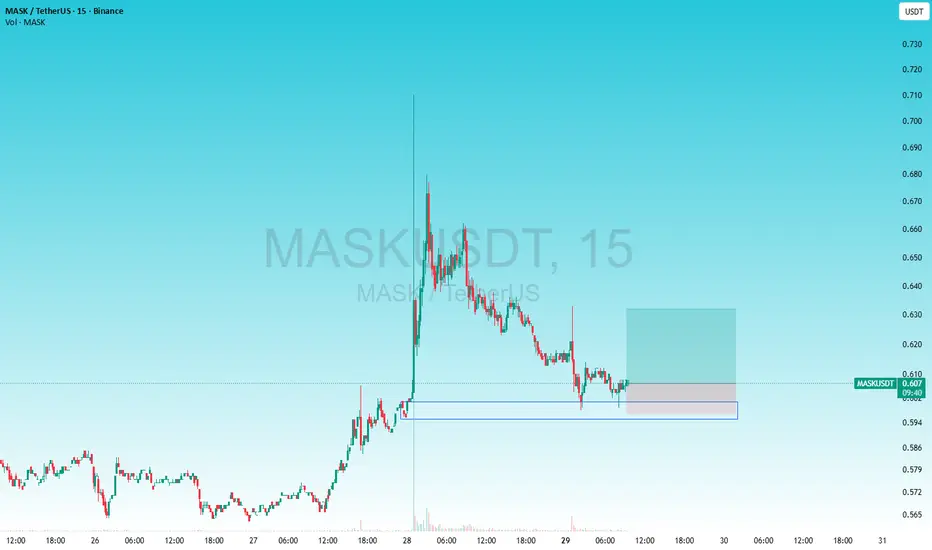
maskusdt longInstructions:
Entry point: yellow
Stop loss: red
Take profit: green
👉Leverage x 5-10-20 for crypto
👉Leverage x 20-50-100 for commodities, stocks, indices, and forex
👉Margin 1-5% max.
Always practice risk and money management.
Invest a maximum of 5% on any trade or across all your trades.
Invest only what you can afford to lose, as no one is in control of the market.
👉Our analyses are primarily based on:
breakouts: two trend lines (ascending and descending) and a line indicating a horizontal
maskusdt shortInstructions:
Entry point: yellow
Stop loss: red
Take profit: green
👉Leverage x 5-10-20 for crypto
👉Leverage x 20-50-100 for commodities, stocks, indices, and forex
👉Margin 1-5% max.
Always practice risk and money management.
Invest a maximum of 5% on any trade or across all your trades.
Invest only what you can afford to lose, as no one is in control of the market.
👉Our analyses are primarily based on:
breakouts: two trend lines (ascending and descending) and a line indicating a horizontal
MASK: local squeeze with $0.4587 destinationThe Macro Picture 🗺️
MASK unwound from the $0.6938 macro ceiling into a range and is now balancing at $0.3865, in the middle of the band above the $0.33 floor. The tape has flattened into rotation as it works off the downtrend.
The Setup ⚙️
The Range Floor 🟢
$0.3300 (Macro Support) is the demand base. The June low was defended and price has built above it — that's the floor this range pivots on.
The Decision Point 🔴
$0.4386 (Local High) is the gate. A daily close above it flips the local str
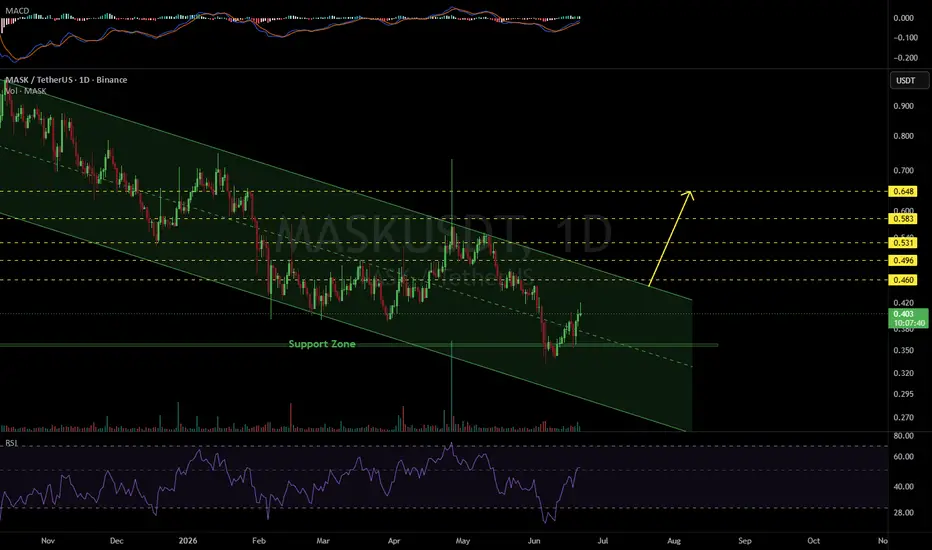
MASKUSDT 1D#MASK is moving inside a descending channel on the daily chart. Consider accumulating a small bag here and near the support zone.
In case of a breakout above the channel resistance, the potential upside targets are:
🎯 $0.460
🎯 $0.496
🎯 $0.531
🎯 $0.583
🎯 $0.648
⚠️ Always remember to use a tight stop-loss and maintain proper risk management.
MASK/USDT - Descending Trendline, Breakout or Another Rejection?On this 2D chart, MASK remains in a medium-to-long-term downtrend, highlighted by the yellow Descending Trendline 🔻 that has been acting as dynamic resistance since October 2025.
Each time price approaches this trendline, selling pressure reappears and pushes the market lower.
Currently, price is showing a rebound from the low area around $0.330 - $0.345 🟢 and is attempting to approach the major resistance represented by the descending trendline.
The overall market structure remains bearish,
Mask Network · The Start is Not the End!This is what I am talking about. From the recent low in late March, MASKUSDT is up almost 100%, recovering three months of bearish action already, and it will only go higher. You've seen nothing yet.
The start is never the end.
The recovery process (rounded bottom) and bullish breakout is the start of the bullish market phase. It is not like we get some growth and because there is some growth the market must move down. Better yet, the growth we are seeing shows the world coming back to Crypto
MASKUSDT Forming Bullish MomentumMASKUSDT is forming a clear bullish momentum pattern, a classic bullish reversal signal that often indicates an upcoming breakout. The price has been consolidating within a narrowing range, suggesting that selling pressure is weakening while buyers are beginning to regain control. With consistent volume confirming accumulation at lower levels, the setup hints at a potential bullish breakout soon. The projected move could lead to an impressive gain of around 40% to 50% once the price breaks above
MASK READY FOR MASSIVE REVERSAL🔥 Fortune AI Radar — NASDAQ:MASK
Fresh activity detected on NASDAQ:MASK today.
Data suggests increasing market interest & buyers stepping in.
Technicals currently lean bullish, with momentum trending upward.
Whales showing hints of accumulation and hype rising among trader
MASK/USDT – Potential Breakout in PlayMASK is showing signs of a bullish breakout after weeks of consolidation. Price has just pierced the descending resistance trendline with a surge in volume, indicating strong buying interest.
Key Levels to Watch:
Support: 0.635 USDT
Resistance 1: 0.769 USDT
Resistance 2: 0.859 USDT
A successful retest of the breakout zone could confirm bullish momentum. If volume sustains and price holds above the trendline, we may see a move toward the 0.769 and 0.859 levels.
🔍 Volume Spike: Recent surge
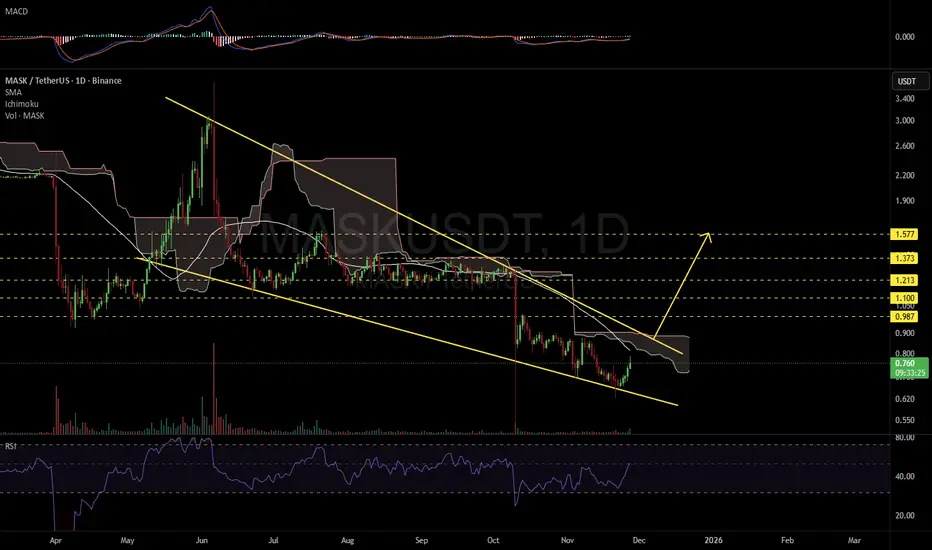
MASKUSDT 1D#MASK is moving inside a falling wedge pattern on the daily chart and has bounced off the wedge support line. For the bullish scenario to play out, price must break above the resistance cluster — first the daily SMA50, followed by the Ichimoku cloud and the wedge resistance. If that happens, the potential targets are:
🎯 $0.987
🎯 $1.100
🎯 $1.213
🎯 $1.373
🎯 $1.577
❌Invalidation: a daily candle closing below the wedge.
⚠️ Always remember to use a tight stop-loss and maintain proper risk manageme
MASKUSDT 1D#MASK is moving inside a descending triangle pattern on the daily timeframe. It is currently facing the triangle resistance and the daily SMA100. In case of a breakout above both, the potential targets are:
🎯 $1.411
🎯 $1.507
🎯 $1.602
🎯 $1.738
🎯 $1.911
⚠️ Always remember to use a tight stop-loss and follow proper risk management.
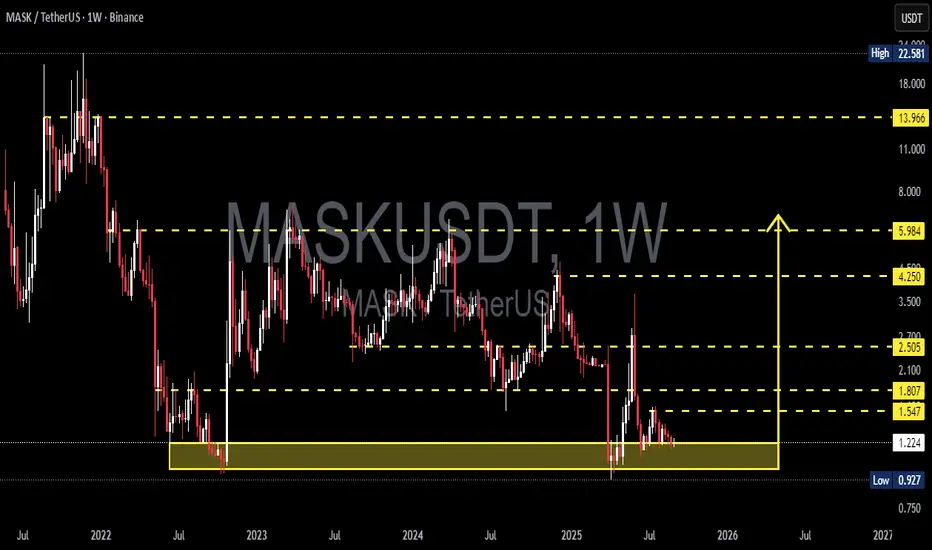
MASK/USDT — Testing Big Support! Big Rebound or Major Breakdown?
🔎 Overall Analysis
MASK is once again testing the historical support zone at 0.93 – 1.22 USDT (yellow box), an area that has repeatedly acted as a demand zone since 2022. Each time price revisited this region, it sparked strong rebounds.
However, the long-term structure remains bearish with a clear pattern of lower highs. This means that while support is strong, the broader trend is still downward unless we see a confirmed structural shift.
In short, MASK is now at a critical turning point:
MASKUSDT - SELLERS ARE IN CONTROLChart shows interesting pumps and dumps, but buyers still haven’t stepped in. The strongest selling area is marked with a black box where sellers remain in control.
Watching how price reacts if it returns there: if sellers stay strong, no trade; if we see footprint absorption + CDV divergence + structure reclaim, it may offer a reversal setup.
MASK Analysis (3D)The correction for MASK has started from the area marked as “Strat” on the chart.
This appears to be forming a symmetrical correction, and we seem to be approaching the end of wave I.
The green zone is considered the most favorable and low-risk area for the completion of wave I.
Targets are indicated on the chart.
A daily candle closing below the invalidation level will invalidate this analysis.
For risk management, please don't forget stop loss and capital management
Comment if you have an