MovieBloc (MBL): Altcoins Market Bullish Reversal PatternWe are coming out of a bear market... We then get a pause and bullish breakout to signal a trend reversal.
Everything starts with a downtrend sometime after mid-2025. Some projects started crashing in early 2024 but there was a marketwide pause in 2025. After this pause, some projects grew some while others continued lower.
So it all starts with this downtrend that intensified in late 2025 and ended early 2026.
After a major low in February, the market turned sideways. The transition period; bottom accumulation; consolidation and so on. The consolidation period ends with a very strong bullish breakout.
The market has hundreds and hundreds of projects, thousands. It takes a long while for the entire market to recover from the bear market bottom to start growing. We are seeing this extended recovery process now taking place.
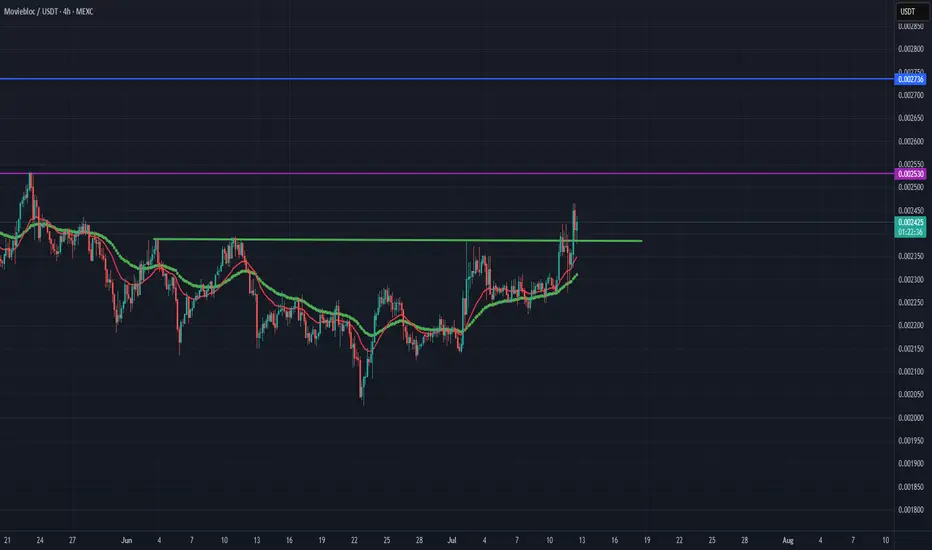
Some projects went bullish right after the February low, in March. Others turned bullish last month, April; while still others are breaking bullish just now—May. MBLUSDT (MovieBloc) is breaking bullish just today.
Many projects actually hit bottom in December and even November 2025. Many of these projects have been growing for 5-7 months non-stop. This is another variation. Most projects though are in the same situation as this one.
Now we get a bullish breakout supported by high volume. This moves confirms the start of a new market phase and also invalidates any possibility of additional bearish action in the short-, mid- and long-term. If the market was bearish, the consolidation period would resolve with a drop.
The projects moving lower bounce at support or create very shy new lows. The projects breaking bullish are doing massive numbers with high volume. All the ground that is gained is being maintained. Retraces are short and always end in a higher low.
With this current move, we can expect MBLUSDT to produce long-term growth. A long bearish cycle ended and we get the start of a long-term bullish cycle.
Balance. Night and day. Winter and summer. Light and dark. Down then up.
Namaste.
In-depth trading ideas
MBL potential targets First of all we should be realistic with market cap of this coin. At current moment in circulation around 18.8 Billion coins. The all time high market cap was around 150 million
On monthly timeframe we can see, in accumulation zone (based on this fib levels) we trade long time period and like usual we can see 2 scenarios!
Conservative - test yearly open, and zero level its around 1000% gains and rejection in to bear market again
Most positive - 500 million market cap with test of 0.5 level fibonacci (same direction to yearly open, sweep buy side liquidity and road can be open to new ath by market cap)
At current moment GATE:MBLUSDT trying break the point of control on Monthly timeframe!
✅Disclaimer: Please be aware of the risks involved in trading. This idea was made for educational purposes only not for financial Investment Purposes.
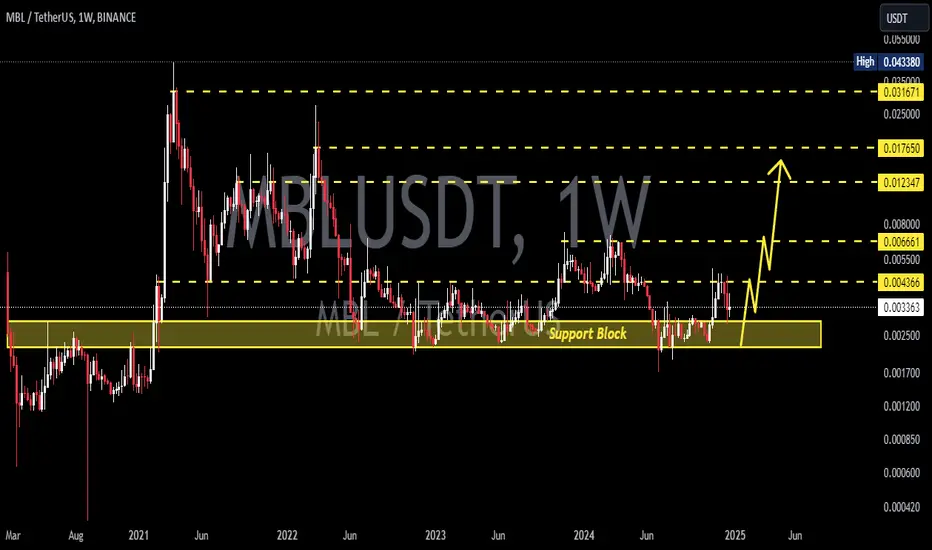
MBL/USDT — Descending Triangle: Breakout or Breakdown Ahead?🔎 Detailed Analysis
The MBL/USDT pair on the weekly chart is currently in a long-term price compression phase. The structure forms a Descending Triangle, characterized by:
Consistent lower highs along a long-term descending trendline (since 2021).
A strong horizontal support zone at 0.0017 – 0.0023 USDT (yellow box).
Price action consolidating into the triangle apex, suggesting a potential major breakout or breakdown in the coming weeks/months.
This pattern has been building for over 3 years, which makes any confirmed breakout highly significant.
---
📈 Bullish Scenario
Confirmation: A weekly close above the descending trendline and pivot level at 0.002874 USDT, supported by strong volume.
Retest: A successful retest of the breakout level turning into support strengthens the case for upside continuation.
Bullish Targets:
Target 1: 0.004419 USDT (nearest resistance).
Target 2: 0.006574 USDT.
Extended Target: 0.0177 – 0.0318 USDT if broader altcoin momentum strengthens.
✨ If this bullish breakout occurs, it could mark the beginning of a major reversal after years of consolidation.
---
📉 Bearish Scenario
Confirmation: A weekly close below the 0.0017 USDT support zone with strong bearish follow-through.
Implication: A breakdown of this historical support could open the door to much lower levels (sub-0.001), with an extreme projection toward 0.0006 USDT.
Note: Descending triangles often resolve bearishly in textbook cases, but in crypto they can also serve as accumulation zones before explosive rallies.
---
🛡️ Risk Management
Avoid entering positions solely because the price “looks cheap” — wait for clear confirmation.
Always set a Stop Loss below support (for longs) or above invalidation (for shorts).
Manage position sizing carefully → high reward potential but also high risk.
Use indicators (RSI, MACD, Volume) to confirm momentum shifts.
Weekly close is the strongest signal — avoid acting on intraday noise.
---
⏳ Timeframe & Potential
As this is a weekly timeframe pattern, confirmation may take several weeks to months.
The closer price gets to the triangle apex, the more explosive the breakout is likely to be.
Broader altcoin market sentiment will strongly influence which direction this resolves.
---
✨ Conclusion
MBL/USDT is at a critical crossroads:
Holding the 0.0017 – 0.0023 support and breaking the descending trendline could trigger a multi-fold rally.
Losing this support zone could lead to a sharp drop into uncharted sub-0.001 territory.
📍 This setup is highly attractive for swing traders and mid-to-long term investors waiting for a major move after extended consolidation.
---
#MBL #MBLUSDT #Crypto #Altcoins #TechnicalAnalysis #DescendingTriangle #Support #Breakout #Bullish #Bearish
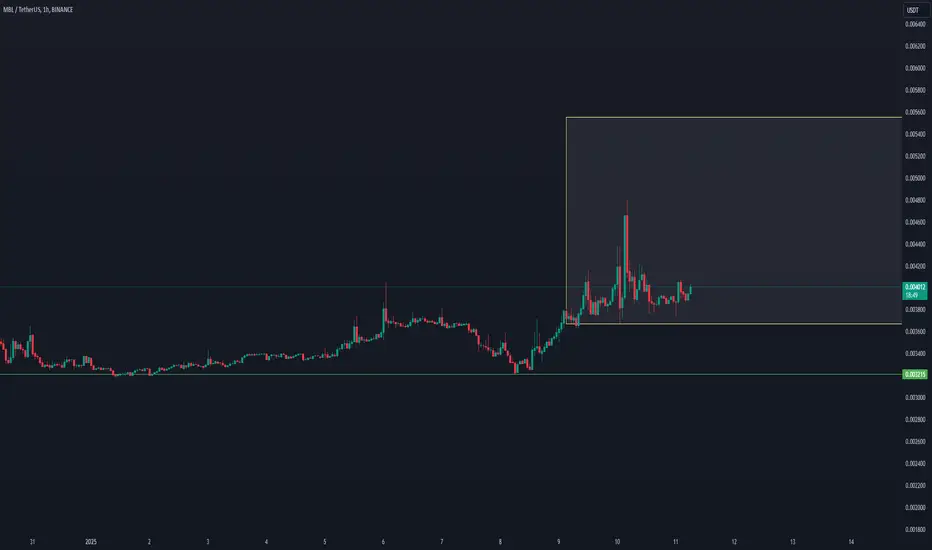
MBLUSDT Forming Bullish ReversalMBLUSDT is currently exhibiting signs of a bullish reversal pattern, indicating a potential trend shift in favor of the bulls. After an extended downtrend, the price appears to have found strong support, which is now serving as a base for upward momentum. This structure is often seen before a breakout rally, especially when paired with a steady increase in trading volume—suggesting accumulation by informed investors.
The recent price action confirms growing investor confidence in the MBL project. With volume picking up and a bullish reversal structure forming on the chart, traders are beginning to position for an anticipated move to the upside. Technical indicators support this sentiment, aligning with a potential gain of 20% to 30%+ in the short term if the current momentum is sustained.
As broader market sentiment continues to recover, MBLUSDT stands out with a clean technical pattern that offers a favorable risk-to-reward ratio. The combination of healthy volume, a well-defined support zone, and early signs of bullish continuation make this setup appealing to both swing traders and mid-term holders watching for breakout confirmation.
MBL’s fundamentals are also garnering interest, adding to the technical strength seen on the chart. If buyers continue stepping in near support levels, the breakout target could be reached faster than expected.
✅ Show your support by hitting the like button and
✅ Leaving a comment below! (What is You opinion about this Coin)
Your feedback and engagement keep me inspired to share more insightful market analysis with you!
Prepare to BUY Spot MBLUSDT (3M Cycle)🚀 Prepare to BUY Spot MBLUSDT (3M Cycle)
🌟 The 3M cycle for MBLUSDT is setting the stage for an explosive move – A rare opportunity to capitalize on a major crypto trend! 🌟
🌍 Market Overview:
MBLUSDT is projected to enter the bullish wave of its M cycle within the next 3 to 6 months. This cycle is significant not only in terms of magnitude but also in duration, making it a powerful setup for long-term gains.
📊 Trade Plan:
📌 Entry Point:
Ideal buying zone: $0.003393 – Prioritize accumulating near this level.
🎯 Target:
x5 potential returns as the M cycle gains momentum.
⏳ Hold Time:
Approximately 6 months – Matches the anticipated length of the M cycle wave.
💡 Note:
Focus on securing a strong position near the suggested entry price.
Monitor key market indicators and breakout signals to optimize timing.
Patience and consistency will be critical for maximizing your gains.
🔥 MBLUSDT is gearing up for a major cycle – Don’t miss out on this incredible opportunity! 🔥
Prepare to BUY Spot MBLUSDT on the D1 Cycle
🌟 Seize the Opportunity with MBLUSDT! 🌟
🌍 Market Overview:
MBLUSDT is showing strong bullish potential on the D1 timeframe, presenting an excellent opportunity for short-term gains with room for significant upside.
📊 Trade Plan:
📌 Entry: $0.033 - $0.039 – Accumulate in this range for an optimal setup.
🎯 Target:
+50% as the initial target.
If the price pushes higher by the end of the week, the target may exceed +100%.
⏳ Hold Time: 1-2 weeks – Short to mid-term hold based on market momentum.
🔍 Strategy Insights:
My custom tool RainBow MG3 confirms high probability for a strong upward trend.
Volume and market conditions suggest significant potential for achieving the extended target.
🚀 Next Steps:
💬 Reach out for tailored advice or deeper insights into the strategy.
💡 Note: This is not financial advice. Always DYOR before making any trading decisions.
🔥 MBLUSDT is ready for a powerful move – Secure your position now! 🔥
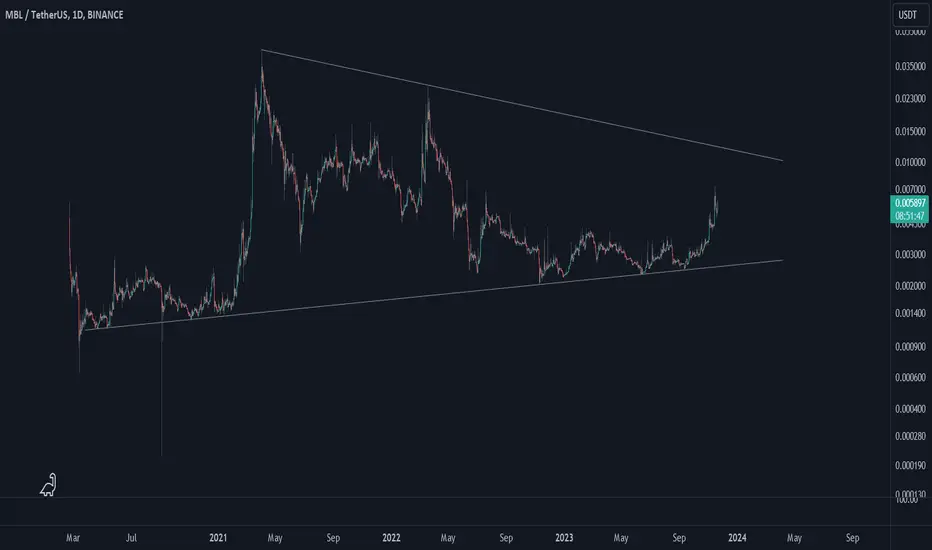
MovieBloc (MBL)MovieBloc is a decentralized movie and content distribution platform driven by the Korean video streaming platform Pandora TV. Anyway, MBL has formed a big triangle pattern and it seems a strong upward wave has started from the bottom of this pattern and going up. Let's see if MBL can break this triangle upward or not.
Trading Signal Alert: MBLUSDTAttention Traders,
We have identified a promising BUY opportunity for the MBLUSDT trading pair. Here are the details of the trade setup:
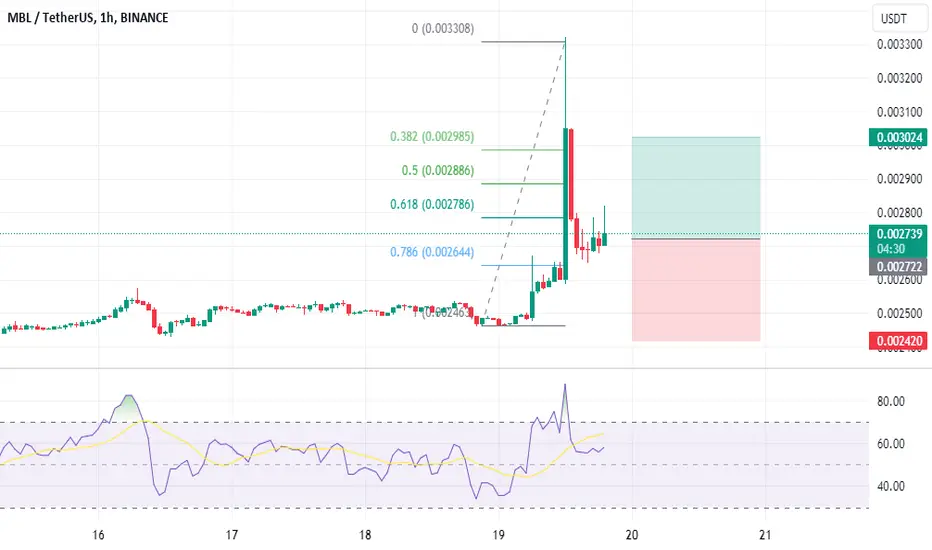
- Enter Price: 0.002522
- Take Profit: 0.002568
- Stop Loss: 0.002469
This signal is based on insights derived using our advanced EASY Quantum Ai strategy. Several factors have been considered to determine this movement:
1. Technical Analysis: Our indicators are showing a bullish trend for MBLUSDT. Moving averages and momentum oscillators suggest upward pressure, indicating a potential for price increase.
2. Market Sentiment: Increased market interest and positive sentiment around MBL have been observed in recent trading sessions, fostering a conducive environment for price growth.
3. Volume Activity: There has been a noticeable spike in volume, suggesting strong buying interest that could push the price higher.
4. Support and Resistance Levels: The given Enter Price aligns well with identified support levels, while the Take Profit target correlates with tested resistance, offering a favorable risk-reward ratio.
Make sure to manage your risk appropriately and adjust your position size accordingly. Keep an eye on market conditions as they can change rapidly. Happy trading!
Disclaimer
Please note: Trading involves risk, and it is possible to lose your invested capital. This signal is provided for informational purposes only and should not be construed as financial advice. Conduct your own research or consult with a financial advisor before making any trading decisions.
Stay updated with the latest trends and signals with EASY Quantum Ai.
Best of luck,
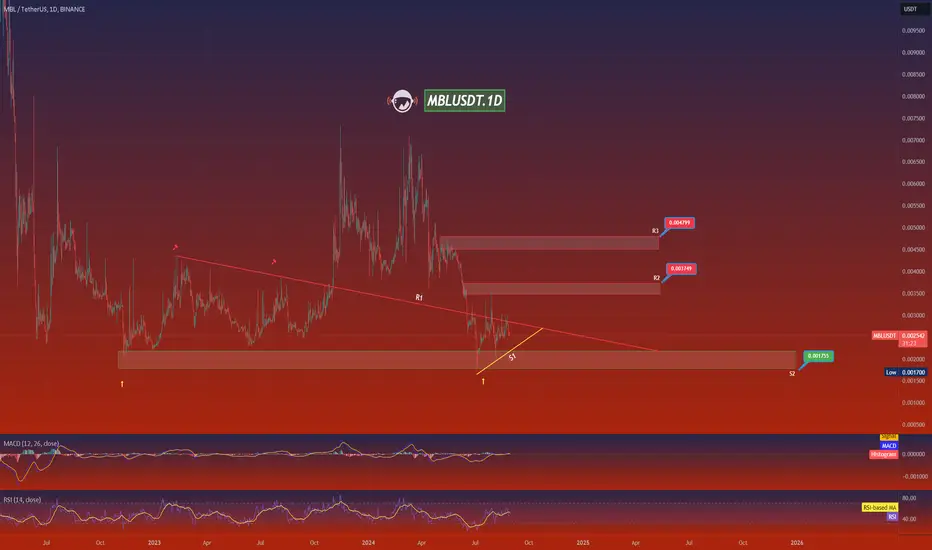
MBLUSDT.1DUpon reviewing the MBL/USDT daily chart, I can provide a comprehensive technical analysis based on the current market dynamics:
Observations and Chart Patterns: The MBL/USDT pair has shown a volatile and somewhat bearish trend over the past year. Notably, there's a descending triangle pattern forming, which typically suggests continuation of a downtrend. The recent price actions are compressed near the lower part of this triangle, indicating potential downward pressure.
Key Levels:
Support 1 (S1) at $0.001755 is pivotal. If this level fails to hold, it could trigger further declines, possibly towards the lower historical levels.
Resistance 1 (R1) at $0.002749 and Resistance 2 (R2) at $0.003749 represent significant barriers where previous rallies have faltered. These levels would need to be overcome to confirm any potential trend reversal.
Resistance 3 (R3) at $0.004799 is a much higher threshold, which would only come into play in a strong bullish scenario.
Technical Indicators:
The Moving Average Convergence Divergence (MACD) is slightly above the signal line but still very close to zero, suggesting a lack of strong momentum in either direction.
The Relative Strength Index (RSI) is around 54, which is slightly above neutral. This indicates a mild buying interest but not strong enough to suggest a reversal just yet.
Current Price Situation: The current price around $0.002548 is hovering just above S1. The near-term price action and reaction at S1 will be crucial in determining the next significant move.
Strategic Approach: Given the chart patterns and indicators, my current strategy would involve cautious monitoring of the price as it interacts with S1. A break below this level would make me wary of further declines, potentially allowing for short positions with a clear stop-loss just above S1. Conversely, a rebound from S1, particularly with increasing volume and an improving MACD, could offer a speculative long position with R1 as the initial target.
Conclusion: The trading environment for MBL/USDT appears challenging with limited bullish signals at the moment. Therefore, it would be prudent to wait for more definitive signs of momentum change before engaging in substantial trading activities. Keeping an eye on the broader market sentiment and any specific developments related to MovieBloc (MBL) will also be crucial for timely decision-making. Always ensure to use stop-losses and manage risks appropriately based on your individual trading profile and market conditions.
MovieBloc (MBL) Flag breakout confirmationThe best returns in the final phase of the bull market shall be afforded to those who enter long positions right now, when emotions are raw. Not when the euphoria comes, anyone can make gains in a raging bull market. Long positions taken now when emotions are raw and traders discombobulated shall make the strongest returns. There are many examples of such opportunities in the market right now.
On the above 10 day chart price action has corrected around 40% since late March. A number of reasons now exist to make this an attractive long position. They include:
1) RSI resistance breakout.
2) Hidden bullish divergence. Do you see it? Black arrows. You can wait years to see such a clean example. They occur as price action prints higher lows at the same time as oscillators print lower lows.
3) Price action breakout on flag. The flagpole extension forecasts a move to 10 cents. That is a 3000% upside move.
Is it possible price action corrects further? Sure.
Is it probable? No.
Ww
Type: trade
Risk: <= 6%
Timeframe for long: Now
Return: At least 2000%
MBLUSDT.1DIn my detailed analysis of the MBL/USDT chart, I've taken a close look at the daily timeframe to deduce the potential direction of the market. Notably, the Moving Average Convergence Divergence (MACD) is positioned just below the signal line and close to the zero line, indicating a slightly bearish momentum. However, the proximity to the zero line suggests that the market sentiment is not overwhelmingly bearish, and a reversal could be imminent if external factors come into play.
The Relative Strength Index (RSI) stands at 48.22, indicating a nearly neutral market with a slight tilt towards bearish territory. This level suggests that while there isn't extreme selling pressure, buyers have not taken full control either, creating a balanced yet tentative market condition.
The price has recently tested a key support level at $0.001755 (S1), and this level is crucial in determining the short-term market direction. If this support holds, it could act as a springboard for the price to potentially move towards the resistance levels identified at $0.003460 (R2) and $0.004283 (R3). Currently, the chart suggests a possible rebound towards these resistance levels, marked by the green arrows.
However, it's important to remain cautious. Should the support at $0.001755 fail to hold, the price could drop further, possibly testing lower historical supports. Given the current setup, my strategy would involve closely monitoring the $0.001755 level for potential buys, with stop-loss orders placed just below to manage risk effectively.
In summary, the MBL/USDT market is at a critical juncture, with potential for both a rebound and further declines. The key will be the market's ability to maintain above the current support level. A rebound above this level could offer a strategic entry point for a long position, targeting the aforementioned resistance levels.
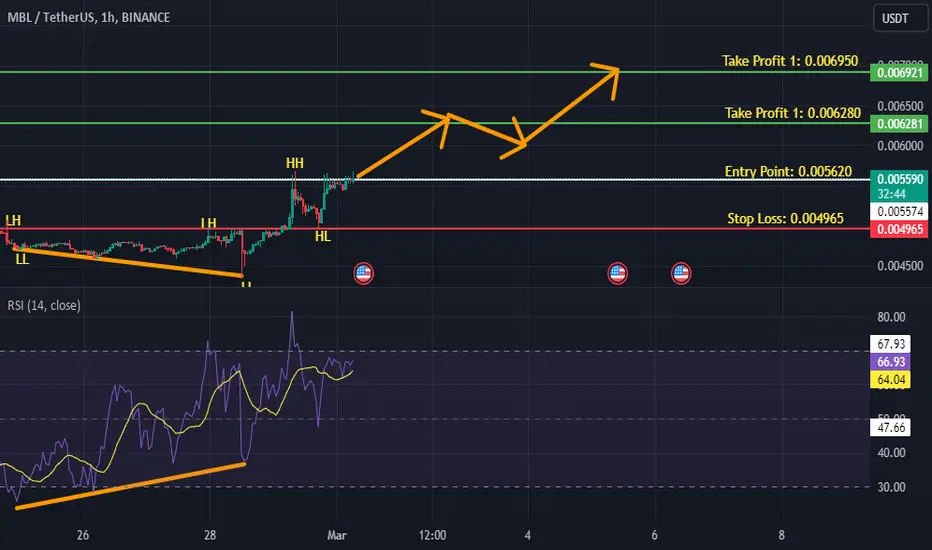
MBL/USDT NEW INCREASE VOLUMEMBL/USDT shows the low time frame possibility for new volume which can affect the price for an uptrend. ( depend all on high chance) There are no guarantees in the markets.
The new increase volume updates always start with interest if there is a confirmation to follow and if there is a building with a hold for a time.
90% of coins this time are not building coins. Some % also show a start fake trend and return to where it started. time frame confirmation + high levels building is important for a healthy coin.