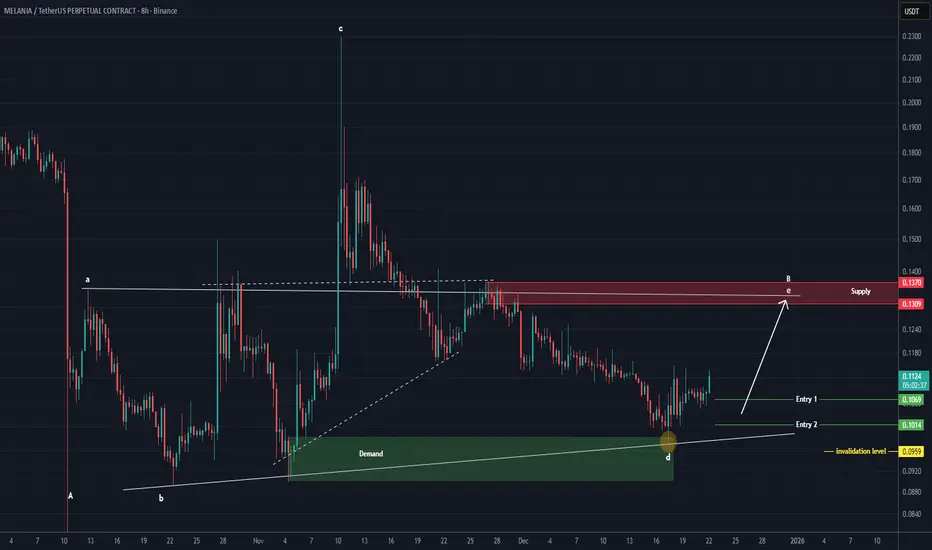
MELANIA / MELANIAUSDT Long Setup | Breaker Block ReclaimMARKET ANALYSIS
MELANIA is currently reacting from a key technical area highlighted on the chart.
As long as the protected support zone remains intact, the bullish market structure remains valid and higher liquidity targets may continue to attract price action.
A breakdown below the invalidati
MELANIAUSDT - Bear Flag Pattern, a Potential Breakdown?📊 Technical Analysis
💵 Coin: $MELANIA #MELANIA
⏳ Time Frame: 1D
📉 Pattern: Bear Flag
🎯 Market Bias: Bearish unless the upper resistance of the flag is reclaimed.
---
🚩 Pattern Overview: Bear Flag
The chart is forming a Bear Flag, a classic bearish continuation pattern that typically develops
MELANIA Analysis (8H)It seems that a triangle is forming, and wave D has not yet completed.
The price could make a bullish move for wave E.
We have marked two entry points for this wave, which should be entered using DCA.
The targets are marked on the chart.
A 4-hour candle close below the invalidation level will in
Crypto "Investors" Forget Too Quickly- Part OneI’ve never been much of a gambler.
I don’t chase roulette, I don’t play blackjack regularly, and casinos have never been my second home. But on the rare occasions when I did go—usually dragged by friends who actually like gambling—something strange happened to me.
I ended up losing considerable
Melania Meme · 877% Profits Potential & Technical AnalysisAfter 22-April, trading volume starts to go up, hard. MELANIAUSDT starts a final descent.
8-July marks the downtrend bottom and once more trading volume goes up, hard. It goes up really high but still, sideways. Not very strong bullish action but at least the downtrend is gone.
Yesterday, 25-Augu
Melania / USDT : Buy every dipMELANIA/USDT has successfully broken above the descending trendline, confirming the breakout. This shift suggests a bullish move, with the price now aiming towards the next target at $0.40 . The breakout indicates a change in market sentiment, and if the price continues to hold above this level, we
MELANIA: Divergence, Signal, BaseThis is MELANIA on the 1-day chart.
First, I want to emphasize the bullish divergence on the RSI, which started on April 21, while price continued to drop, RSI held or even moved higher.
Second, although we’re still below the 50MA and the chart doesn’t yet have a 200MA, both systems are long:
• PSAR
$MELANIA | Descending Channel Breakout Confirmed After months of compression within a well-respected falling channel, #MELANIA has printed a high-volume breakout above the channel resistance — confirming a reversal structure with strong momentum expansion.
🔍 Technical Confirmation:
• Breakout from long-term downtrend resistance
• Multiple clean t
See all ideas
Summarizing what the indicators are suggesting.
Oscillators
Neutral
Oscillators
Neutral
Summary
Neutral
Summary
Neutral
Summary
Neutral
Moving Averages
Neutral
Moving Averages
Neutral
Displays a symbol's price movements over previous years to identify recurring trends.