MEME Setup — Compression Above Prior Week Value
⚛️ MEME is setting up clean here.
The important part is not just the move off the lows. It is where the compression is forming.
Price reclaimed and is now holding above **PWVAH / prior week value**, which gives this a better location than a random mid-range breakout. The 1H structure is starting to tighten right under resistance, EMAs are curling into price, and the recent pullbacks are holding above the reclaimed value area instead of fully rejecting back into the lower LVN zone.
That tells me participation is trying to build.
HTF Context 🔭
Daily is coming off a larger range with liquidity still sitting above the recent highs.
The upper daily highs / wick cluster are the obvious magnet. If price can accept above the resistance zone, there is room for a push into that liquidity cloud.
This is the kind of setup where the market is saying:
reclaim value → compress under resistance → expand into liquidity
But confirmation still matters.
LTF Structure 🧱
On the 1H, MEME has:
* A strong impulse off the lows
* Compression forming near the highs
* EMAs tightening underneath price
* Price holding above the prior LVN / PWVAH area
* A clear resistance zone overhead
That is constructive.
The clean trigger is not just a wick through resistance. I want to see acceptance above the zone, ideally with volume/participation and price holding above it after the break.
Continuation Scenario 🟢
Bullish continuation opens up if MEME can:
1. Break above the resistance zone
2. Hold acceptance above it
3. Keep the 10/20 EMA structure underneath price
4. Avoid falling back into the prior value area
If that happens, the next logical magnet is the liquidity sitting above the daily highs.
Failure Scenario 🔴
This setup fails if MEME breaks above resistance but cannot accept, then rotates back below the zone.
The bigger failure is a loss of PWVAH / reclaimed value. If price accepts back below that area, the breakout idea weakens fast and this turns into another failed reclaim / chop-tax setup.
In-depth trading ideas
MEME has completed a bearish triangle pattern (4H)⚠️ Before anything else, please note that MEME is a very low-volume meme coin, so make sure to manage your position size and leverage accordingly.
From the point where we placed the green arrow on the chart, MEME appears to have started forming a triangle pattern, which has now been completed.
As long as the price remains within the red box, it can continue moving toward the specified targets.
Move your stop loss to breakeven once the first target is reached.
A 4-hour candle close above the invalidation level will invalidate this analysis.
If you have a symbol you want analyzed, first hit the like button and then comment its name so I can review it for you.
Do you also think MEME is bearish?
#MEMEUSDT may continue its trend after correction#MEME
The price is moving within an ascending channel on the 1-hour timeframe and has reached the lower boundary, heading towards a breakout. A retest of this boundary is expected.
The Relative Strength Index (RSI) indicates a downward trend, and this trend is likely to continue due to the overbought condition.
There is a key resistance zone (in green) at 0.000650, which the price has bounced off several times, making it a strong support level.
A consolidation trend is observed above the 100-period moving average, which we are approaching. This trend supports a decline towards this level.
Entry Price: 0.000595
Target 1: 0.000580
Target 2: 0.000560
Target 3: 0.000536
Stop Loss: At the resistance zone (in green).
Remember this simple rule: Manage your money wisely.
For any questions, please leave a comment.
Thank you.
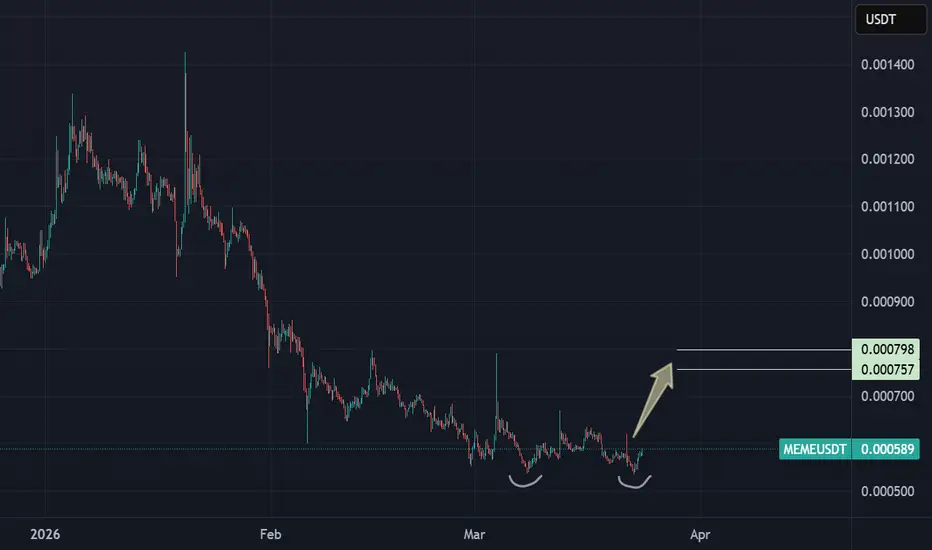
Memecoin · Buy the bottom to sell the topWe know meme coins has huge potential for growth, wild volatility and this can be confirmed from this chart. Without attempting a new all-time high, MEMEUSDT here shows 2,000% and even 5,000% profits potential, which is pretty crazy but at the same time quite do-able within a wild bullish market phase.
MEMEUSDT started its decline March 2024 and the bear market lasted exactly two years, until March 2026.
I shared a chart for this pair in April when we saw multiple green candles. The same is happening again. The difference now is a higher low and higher volume. The higher volume reveals the presence of more buyers. I have to warn though, it is still early, but early is best.
We know the usual fluctuations and strong price swings that show up after any type of advance. It becomes hard to buy or to hold or to know anything after the market starts to move. Should I sell? Should I continue holding? Will it continue lower? Will it resume growing? Should I buy more? After the first advance questions like this can plague our minds.
Buying low, as the chart looks now, removes all complexities in the future. When there is an advance and the market reaches resistance, you can easily secure some profits or you can continue holding. If you buy at the bottom, you can never go wrong.
MEMEUSDT is trading close to its all-time low, true bottom prices. While this is the best possible, not many people are around when the market hits bottom and that's one of the main signals that reveals the market is about to change.
You know the market reached a peak because of massive hype, euphoria and greed. There is no greed right now, there is only fear, doubt and uncertainty. Doubt and fear at the bottom, greed and hype at the top.
We know the market is trading at bottom prices because activity is very low. This is the signal to go all-in, buy, accumulate and go long. When the market becomes hot, that's the time to take profits. This looks like a good chart.
Namaste.
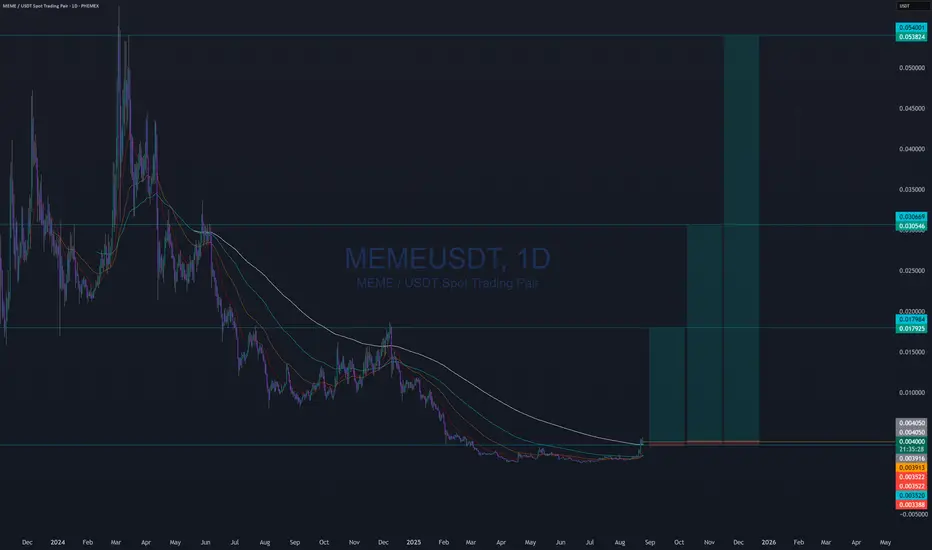
MEMEUSDT Forming Falling WedgeMEMEUSDT is forming a clear falling wedge pattern, a classic bullish wave signal that often indicates an upcoming breakout. The price has been consolidating within a narrowing range, suggesting that selling pressure is gradually weakening while buyers are beginning to regain control. With consistent volume confirming accumulation at lower levels, the setup hints at a potential bullish breakout soon. The projected move could lead to an impressive gain of around 90% to 100% once the price breaks above the wedge resistance.
This falling wedge pattern is typically seen at the end of downtrends or corrective phases, and it represents a potential shift in market sentiment from bearish to bullish. Traders closely watching MEMEUSDT are noting the strengthening momentum as it approaches a key breakout zone. Strong trading volume adds confidence to this setup, showing that market participants may be positioning themselves early in anticipation of a potential reversal.
Investors’ growing interest in MEMEUSDT reflects increasing confidence in the project's long-term potential and current technical strength. If the breakout confirms with sustained volume, it could mark the beginning of a fresh bullish leg. Traders may find this a valuable setup for medium-term gains, especially as the wedge pattern nears completion and buying momentum continues to accelerate.
✅ Show your support by hitting the like button!
✅ Leave a comment below! (What is your opinion about this coin?)
Your feedback and engagement keep me inspired to share more insightful market analysis with you! 📈🚀
meme on verge of breakout meme is currently testing a key resistance area where both the descending trendline and horizontal zone are meeting. If price manages to break above this confluence with a clear and clean breakout, it could confirm bullish momentum and open the door for a strong rally in the coming days.
For now, the breakout confirmation is the most important thing to watch. If buyers successfully reclaim this level and hold above it, then we can expect a potential 2x move from here. Until then, patience is needed and we should wait for proper confirmation before expecting the next major bullish rally.
MEMEUSDT 1D#MEME has seen a significant increase in volume and is currently attempting to break above the descending resistance and the SMA50 on the daily chart. If confirmed, the potential upside targets are:
🎯 $0.000661
🎯 $0.000774
🎯 $0.000865
🎯 $0.000955
🎯 $0.001085
🎯 $0.001250
⚠️ Always use a tight stop-loss and maintain proper risk management.
MEME:USDT INTO NEW CONFIRMED TREND TO THE...MEME has a confirmed trend, and this our first reason to follow the trend for more, there is expecting that meme can do new high levels, and even a breakout. we will follow it step by step to see how far it can go as long it holds this bullish confirmed trend.
MEMEUSDT Forming Bullish MomentumMEMEUSDT is forming a clear bullish momentum pattern, a classic bullish wave signal that often indicates an upcoming breakout. The price has been consolidating within a narrowing range, suggesting that selling pressure is weakening while buyers are beginning to regain control. With consistent volume confirming accumulation at lower levels, the setup hints at a potential bullish breakout soon. The projected move could lead to an impressive gain of around 40% to 50% once the price breaks above the wedge resistance.
This bullish momentum pattern is typically seen at the end of downtrends or corrective phases, and it represents a potential shift in market sentiment from bearish to bullish. Traders closely watching MEMEUSDT are noting the strengthening momentum as it nears a breakout zone. The good trading volume adds confidence to this pattern, showing that market participants are positioning early in anticipation of a reversal.
Investors’ growing interest in MEMEUSDT reflects rising confidence in the project’s long-term fundamentals and current technical strength. If the breakout confirms with sustained volume, this could mark the start of a fresh bullish leg. Traders might find this a valuable setup for medium-term gains, especially as the wedge pattern completes and buying momentum accelerates.
✅ Show your support by hitting the like button and
✅ Leaving a comment below! (What is your opinion about this coin?)
Your feedback and engagement keep me inspired to share more insightful market analysis with you!
MEME/USDT — Downtrend Pressure Weakening, Reversal or Fake BreakThe MEME/USDT (1D) chart shows a strong downtrend from previous highs, marked by consistent lower highs and lower lows. The descending trendline continues to act as a major resistance.
Currently, price is testing the trendline breakout area after a long consolidation phase at the bottom, indicating a potential shift in momentum.
---
📐 Structure & Pattern
Main observed pattern:
➡️ Descending Triangle / Falling Structure (Bearish Bias)
Diagonal resistance continues to suppress price
Horizontal support remains relatively stable
Volume is decreasing → sign of accumulation or seller exhaustion
➡️ However, toward the end:
A base / accumulation zone is forming
Multiple lower rejections → indication of growing buying interest
💡 This opens the possibility of an early reversal structure if a valid breakout occurs.
---
📊 Key Levels
Key Support: 0.00048 – 0.00056
Resistance Levels:
0.00065
0.00078
0.00089
0.00106 (major resistance)
---
🚀 Bullish Scenario
If price manages to:
✅ Break and close above the trendline resistance
✅ Hold above 0.00065
Then potential movement:
📈 Upside targets:
0.00078
0.00089
0.00106
🔥 Strong confirmation if:
Successful retest of the trendline as new support
Increasing volume during breakout
➡️ This could signal an early trend reversal after a prolonged downtrend.
---
⚠️ Bearish Scenario
If price fails to break out and:
❌ Gets rejected at the trendline
❌ Loses support at 0.00056
Then potential downside:
📉 Move toward:
0.00050
0.00048 (last support)
💀 A breakdown below this zone could lead to a new lower low and continuation of the long-term bearish trend.
---
📌 Conclusion
Structure remains bearish, but momentum is weakening
Price is at a critical decision zone
Breakout or rejection from the trendline will determine the next move
👉 This is a high risk – high opportunity phase
#MEMEUSDT #CryptoAnalysis #TechnicalAnalysis #Altcoins #Breakout #BearishTrend #BullishReversal #CryptoTrading #SupportResistance #Trendline #PriceAction
#MEME#MEME is showing consolidation 📈 after breaking out from a falling wedge pattern. Traders are now watching for a move towards the marked targets 🚀 at 0.0006300 and 0.0006500. Recognizing recurring chart patterns can provide clear entry and target levels for potential trades 📊.
#MEME #altcoin #chartpatterns #cryptotrading
Memecoin · Two years long bull market?The bear market started March 2024 and lasted exactly two years, until March 2026. You know how the Cryptocurrency market cycles continue to extend. As the market grows, the cycles become longer.
Here we have MEMEUSDT and the possibility of a new cycle, one that can last as much as the bearish one.
In the past, we would see six months of bearish action followed by six months of growth. One year of a bear market followed by one year of growth. And now we have a two years long bear market reaching its end, last month.
This clearly opens the possibility for a new market cycle lasting years...
With Bitcoin becoming stronger and ready to grow long-term; market conditions improving, the regulatory environment gets better, everything Crypto is starting to look great.
All these positive developments can support years of growth. When we look at all these charts, all these possibilities seem highly probable and even likely unavoidable. Long-term growth.
Long-term growth here would mean MEME growing, as well as the rest of the market, until March 2028. Many times a peak appears in March, so now it can happen again.
Some projects can peak before and other later. We are entering a bull market like never seen before. It is not like 2021, it will be better because it will last longer. It will last longer because of the preparation period, it has taken so long.
After the worst ever, we get the best possible. From the bottom we grow.
The altcoins market bull market starts now.
Thanks a lot for your continued support.
Namaste.
The MEME is currently the most bullish meme coin in crypto!Considering the higher lows formed after extended corrections and the bullish CH (Change of Character) visible on the chart, it is possible to take a buy/long position in the direction of the bulls.
There are specific entry points identified, and it is recommended to enter them gradually using a DCA (Dollar-Cost Averaging) approach.
The targets are clearly marked on the chart. Take partial profits at the first target and move your stop to breakeven to secure gains.
A daily candle closing below the invalidation level would negate this bullish outlook and signal a reassessment of the trade.
If you would like us to analyze a coin or altcoin for you, first like this post, then comment the name of your altcoin below.
What is your opinion about MEME?
#MEME/USDT is Bullish#MEME
The price is moving in a descending channel on the 1-hour timeframe. It has reached the lower boundary and is heading towards breaking above it, with a retest of the upper boundary expected.
We have a downtrend on the RSI indicator, which has reached near the lower boundary, and an upward rebound is expected.
There is a key support zone in green at 0.001144. The price has bounced from this zone multiple times and is expected to bounce again.
We have a trend towards consolidation above the 100-period moving average, as we are moving close to it, which supports the upward movement.
Entry price: 0.001172
First target: 0.001194
Second target: 0.001229
Third target: 0.001271
Don't forget a simple point: money management.
Place your stop-loss below the support zone in green.
For any questions, please leave a comment.
Thank you.
MEME Local Trend. Wedge. Reversal Zone. December 27, 2025Logarithm. 3-day timeframe.
The main trend is shown for clarity (dynamic support zone of the internal descending channel).
-98% decline from the high
The price is near the long squeeze zone, 10 10 2025. A descending wedge has formed, and the price is being squeezed. This is the local trend reversal zone if its resistance is broken, which can occur through sideways consolidation, i.e., a double bottom or dragon...
MEMEUSDT Forming Falling WedgeMEME/USDT is showing a highly interesting technical setup: price action is carving out a falling-wedge pattern, with tightening range lows and retracements that suggest compression and accumulation. Volume is improving, which adds credibility to the idea that smart money or traders are building positions and waiting for a breakout to the upside. If MEME can break above the upper wedge trendline on rising volume, that could spark a strong reversal.
On the fundamentals side, MEME (from Memeland) is more than purely speculative — it's tapping into growing meme-token demand while also trying to create real community traction. Even though it has characteristics typical of meme coins (viral potential, high volatility), the project still has active social engagement and volume, making it relevant at a time when meme-coin utility and narrative are being explored more seriously in the crypto community. The token’s identity as a meme coin makes it an important part of social-finance themes that many retail investors still flock to.
From a trading strategy perspective, the ideal entry would be on a confirmed breakout above the falling-wedge upper boundary, ideally supported by a strong volume bar and followed by a retest of that breakout level. That retest could provide a good risk-reward entry opportunity. A sensible stop-loss could be placed below the lower wedge or below a recent swing low, helping to define risk clearly. If the breakout holds, the measured move could produce a significant upside, especially given the wide range of price compression.
MEMEUSDT — The Bull Last Stand: Accumulation or Total Surrender?📉 Overview
MEME/USDT is standing on the edge — between a massive accumulation opportunity and complete market capitulation.
The price is now sitting right above the major support zone (0.0012 – 0.00165 USDT), a key defensive area that has been tested multiple times since April 2025.
Each visit to this zone has triggered liquidity absorption and stop hunts, followed by short-lived recoveries — but never a sustained reversal.
Now, once again, the market is testing this zone for survival.
---
🧩 Price Structure & Technical Context
Primary trend: Long-term downtrend since late 2024, forming consistent lower highs and lower lows.
Dominant pattern: Potential accumulation base following a liquidity sweep — a classic signal of possible smart-money accumulation.
Recent wick reaction: Sharp downward wick that was quickly absorbed — often a sign of institutional defense or smart buyer entry.
Highlighted zone: This yellow box is more than just support — it’s the psychological boundary between recovery and collapse.
---
📈 Bullish Scenario — “Rebirth from the Bottom”
If the price manages to close above 0.0017 and successfully flip this zone into support, it may trigger the beginning of a structural reversal phase.
Potential targets:
Target 1: 0.002167 → first resistance / short-term profit zone.
Target 2: 0.002914 → key validation level for continuation.
Target 3: 0.004117 → structural confirmation of trend reversal.
Key confirmation:
A 2D candle close above the box, followed by a clean retest and sustained momentum.
If volume expands, a mid-term rally could unfold.
Technical narrative:
This setup could evolve into a textbook case of “liquidity sweep followed by a reversal.”
If confirmed, it might mark the start of a major accumulation cycle ahead of the next hype phase.
---
📉 Bearish Scenario — “The Final Floor Breaks”
If the price fails to hold above 0.0012, the next meaningful support lies near 0.000836, the previous low.
A confirmed breakdown below this zone would imply:
The end of the accumulation phase,
Entry into full capitulation,
And a likely panic-driven selloff as retail stop-losses are triggered en masse.
Bearish confirmation: 2D candle close below the support zone with a strong follow-through.
If that happens, bulls are temporarily out of the game until a new structure forms at lower levels.
---
🎯 Summary
This yellow zone is not just another support area — it’s the psychological battlefield where smart money decides the next chapter.
The market is now in a quiet tension before the storm:
Either we witness a legendary rebound from deep accumulation,
Or the final breakdown of a fading trend.
For disciplined traders, this is not the time to guess — this is the time to prepare for both outcomes with precision and patience.
---
⚙️ Risk Management Strategy
Only enter after clear confirmation (2D close + retest).
Risk per trade: 1–3% of total capital.
Take partial profits at each target.
Move stop-loss to breakeven once Target 1 is reached.
---
🧭 Additional Notes
Mid-term bias remains bearish, but early signs of re-accumulation are emerging.
This isn’t just another random bottom — it’s a strategic battlefield between smart buyers and aggressive sellers.
---
#MEME #MEMEUSDT #AltcoinAnalysis #CryptoReversal #LiquiditySweep #SupportZone #BreakoutWatch #CryptoTechnicalAnalysis #SwingTrading #SmartMoneyConcepts #MarketStructure
Memecoin DailyView | The Web3 Power of Memeland💀 Hey , how's it going ? Come over here — Satoshi got something for you !
⏰ We’re analyzing Meme on the 1-Day timeframe .
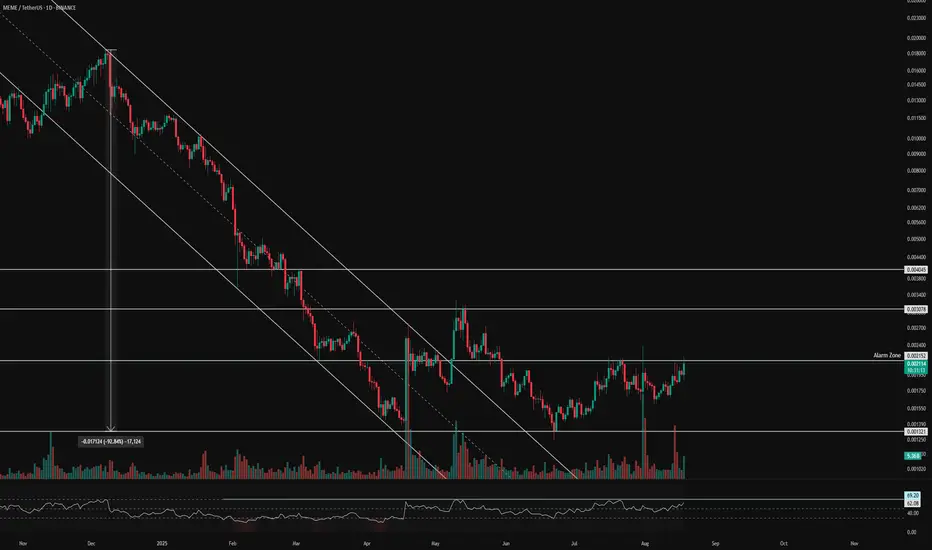
👀 On the daily timeframe of Memecoin, we can see that after a deep 93% correction, MEME broke out of its descending channel. It then faced another pullback on lower timeframes. A very strong bottom was formed around 0.001321, and from this level, with increasing volume and trades, MEME moved upward towards the resistance at 0.002152. Currently, it is trying to break this resistance, which has previously acted as the top of the box and caused rejections .
⚙️ The key RSI level is at 69.20–70. If this level is broken, increased buying momentum could push MEME into the Overbought zone, attracting more buyers .
🕯 Today, the number of long trades has increased, and the size of today’s daily candle looks strong so far. With more buying volume, MEME could break this resistance and aim for higher price levels .
💡 This coin was created by the 9GAG team, who are active in the memecoin sector. The project is a new form of internet money inspired by meme culture. It currently ranks #337 on CoinMarketCap. The project is fully decentralized and operates as a DAO, where NFT holders take part in governance and decision-making .
🔔 The Alert zone is at 0.002152. If this level breaks and confirms, it could provide a good entry for long trades. The short position alert zone is below the daily bottom, but personally, I would avoid shorting this coin .
❤️ Disclaimer : This analysis is purely based on my personal opinion and I only trade if the stated triggers are activated .
#MEME/USDT#MEME
The price is moving within a descending channel on the 1-hour frame and is expected to break and continue upward.
We have a trend to stabilize above the 100 moving average once again.
We have a downtrend on the RSI indicator that supports the upward break.
We have a support area at the lower boundary of the channel at 0.002644, acting as strong support from which the price can rebound.
We have a major support area in green that pushed the price upward at 0.002447.
Entry price: 0.02929.
First target: 0.003232.
Second target: 0.003604.
Third target: 0.004113.
To manage risk, don't forget stop loss and capital management.
When you reach the first target, save some profits and then change the stop order to an entry order.
For inquiries, please comment.
Thank you.
#MEME/USDT#MEME
The price is moving in a descending channel on the 1-hour frame and is adhering to it well and is heading to break it strongly upwards and retest it
We have a bounce from the lower limit of the descending channel, this support is at a price of 0.00284
We have a downtrend on the RSI indicator that is about to break and retest, which supports the rise
We have a trend to stabilize above the moving average 100
Entry price 0.00309
First target 0.00334
Second target 0.00355
Third target 0.00381