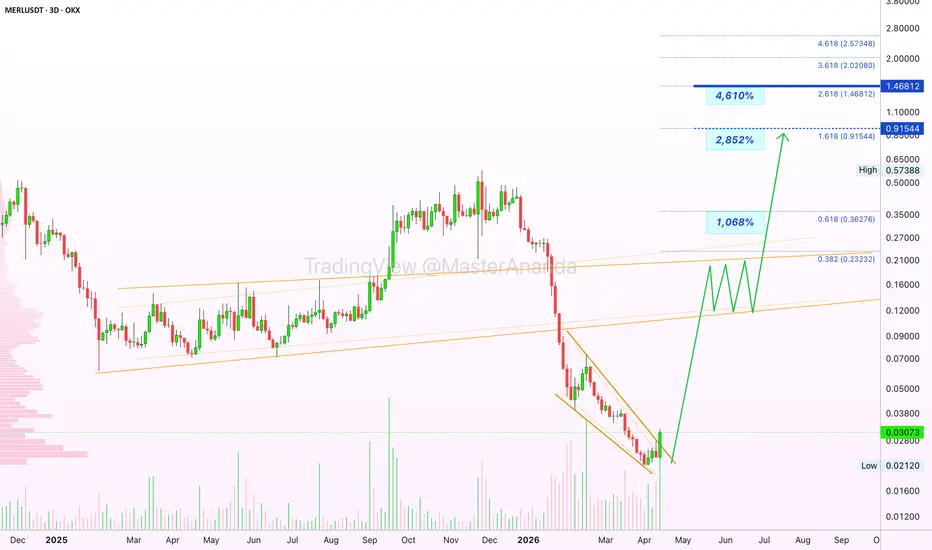
Merlin Chain (MERL) · Divergence & New All-Time High (PP: 4600%)See this last move on the chart, the ending diagonal in brown. Here we are very likely to find a strong divergence when compared to the oscillators, RSI & MACD.
MERLUSDT daily RSI:
Oversold conditions back in early 2025 led to a strong phase of expansion. The same signal but stronger has been rep
#MERL #MERL is currently trading within a falling wedge pattern 📐, showing signs of consolidation. This wedge formation suggests a potential bullish reversal 🐂 based on historical patterns. The target for a breakout from this wedge is approximately 0.02800 🎯.
A breakout above the wedge resistance could s
MERL looks like its setting up for a decent Pop⚛️ HTF Context (Daily)
Prolonged downtrend channel → controlled selling
Price pushing into range lows / exhaustion zone
Momentum clearly slowing
This is the shift:
👉 Trend → Exhaustion → Reversal Attempt
We are in the potential turning phase.
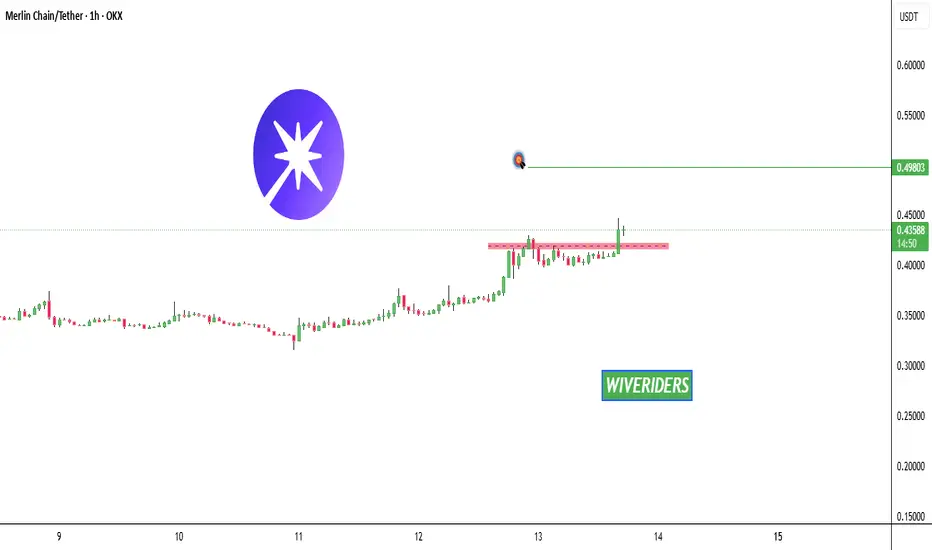
⚛️ LTF Structure (15m / Execution TF)
Strong impulse
MERL: ready for a bounce? key levels and targets to watchMERL
Who’s brave enough to knife‑catch this one? MERL just got hammered with the rest of the alt market after the latest risk‑off wave in crypto, as traders rotate back into majors according to industry sources. Today’s headlines about increasing regulatory noise around smaller projects are not he
MERL: potential bounce ahead? key levels to watch for todayMERL. Buying blood or catching a falling knife? While majors are cooling off after the latest risk mood swing, small caps like MERL are quietly grinding into strong support. No fresh FUD around the project, just a broad alt flush that scared out late buyers.
On the 4H chart price is sitting in the
Merlin Chain recovers, back above long-term supportMERLUSDT is moving back above long-term support, the low from February 2025. Revealing the last move as a stop-loss hunt event.
MERL broke below support and stayed below just barely in order to activate all stop-loss orders. As this goal is now complete, the market recovers. Above the February 2025
MERL — Strong Bull With Squeeze Fired**MERL — Strong Bull With Squeeze Fired, Parabolic Recovery & Triple Candle Pattern Confluence**
**Overview**
MERL is flashing one of the strongest multi-signal setups across the board — 72.7% bullish alignment, a squeeze that just fired with bullish momentum, and an extraordinary 87x parabolic rec
$MERLUSDT QUICK ANALYSIS (1H)OKX:MERLUSDT is experiencing aggressive sell-side pressure, confirmed by both price structure breakdown and a 4.7× abnormal volume spike.
Price is down –20.78% in past 24 hours, indicating panic-driven exits rather than healthy consolidation.
By aligning with the dominant trend traders can capit
$MERL/USDT (Swing Setup)TRADE – $MERL/USDT (Swing Setup)
Type: LONG
Mode: Isolated
Entry Zones:
• Entry 1: $0.350 – $0.344 (trendline and EMA confluence)
• Entry 2: $0.333 – $0.327 (strong demand and LQ sweep area)
Targets (Long-term):
• TP1: $0.400
• TP2: $0.505
• TP3: $0.680
• TP4: $0.800
Stop Loss (Full Safest): $0.2
See all ideas
Summarizing what the indicators are suggesting.
Oscillators
Neutral
SellBuy
Strong sellStrong buy
Strong sellSellNeutralBuyStrong buy
Oscillators
Neutral
SellBuy
Strong sellStrong buy
Strong sellSellNeutralBuyStrong buy
Summary
Neutral
SellBuy
Strong sellStrong buy
Strong sellSellNeutralBuyStrong buy
Summary
Neutral
SellBuy
Strong sellStrong buy
Strong sellSellNeutralBuyStrong buy
Summary
Neutral
SellBuy
Strong sellStrong buy
Strong sellSellNeutralBuyStrong buy
Moving Averages
Neutral
SellBuy
Strong sellStrong buy
Strong sellSellNeutralBuyStrong buy
Moving Averages
Neutral
SellBuy
Strong sellStrong buy
Strong sellSellNeutralBuyStrong buy
Displays a symbol's price movements over previous years to identify recurring trends.