above 500% and 1000%There are several resistance zones ahead. If they are broken, the price could push toward the next zone.Longby satooshi12427
MERLThese published trades represent a portion of a trading history and are not investment advice. A trade is typically published with a 1:1 risk ratio; this does not mean I adhered to these limits, but rather that the closing price will fall within them. Longby BlackSwanVIIUpdated 0
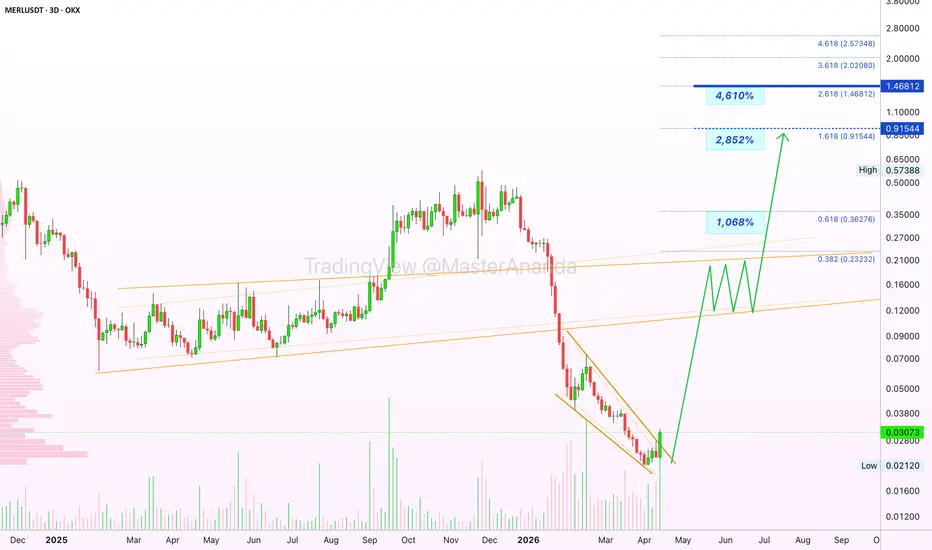
Merlin Chain (MERL) · Divergence & New All-Time High (PP: 4600%)See this last move on the chart, the ending diagonal in brown. Here we are very likely to find a strong divergence when compared to the oscillators, RSI & MACD. MERLUSDT daily RSI: Oversold conditions back in early 2025 led to a strong phase of expansion. The same signal but stronger has been repeated in early 2026, sustained growth is now possible. MERLUSDT daily MACD: I find this signal interesting because of the date, the same month one year apart. In FEB 2025, MERLUSDT hit bottom on the MACD and this signal preceded an extended bullish cycle leading to a major high. In FEB 2026, the same signal is present. The fact that the MACD hit bottom much lower allows for even stronger growth, a full reset. First the bottom and the MACD starts rising followed by the bullish cross. After the bullish cross, sustained long-term growth. A new all-time high is possible in the coming months. Can easily happen in late 2026 or early 2027. If it doesn't happen on these dates, then later down the road. Growth is expected to happen from now on. Namaste.Longby MasterAnanda6
#MERL #MERL is currently trading within a falling wedge pattern 📐, showing signs of consolidation. This wedge formation suggests a potential bullish reversal 🐂 based on historical patterns. The target for a breakout from this wedge is approximately 0.02800 🎯. A breakout above the wedge resistance could signal renewed bullish momentum. #MERL #crypto #trading #altcoinLongby MosFLI0
MERL looks like its setting up for a decent Pop⚛️ HTF Context (Daily) Prolonged downtrend channel → controlled selling Price pushing into range lows / exhaustion zone Momentum clearly slowing This is the shift: 👉 Trend → Exhaustion → Reversal Attempt We are in the potential turning phase. ⚛️ LTF Structure (15m / Execution TF) Strong impulse off the lows First real displacement against trend Holding above EMA cluster Beginning to build a base Key detail: 👉 This is the first time buyers are holding control ⚛️ Model Read This is: 👉 Reversal Extension (Early Stage) NOT crossback yet. This is where: Shorts get trapped Early longs position Market decides if it wants to rotate higher ⚛️ What I’m Watching This is the key question: 👉 Does this extension hold and build, or immediately fail? ⚛️ Scenarios 🟢 Bull Case (Primary) Hold above EMA support Continue building higher lows Push into prior structure highs This leads to: 👉 Reversal → THEN Crossback → THEN Trend 🔴 Bear Case (Failure) Lose the base Immediate rejection Back into downtrend structure This becomes: 👉 Failed Reversal Extension → continuation lower ⚛️ Execution Plan This is NOT breakout chasing. Looking for: Pullbacks into support Tight consolidation LTF continuation triggers ⚛️ Teaching Point This is where most traders lose money. They: Short into exhaustion Or wait too long and miss the move The edge is here: 👉 Trading the first shift — not the confirmation ⚛️ Closing This is early — but that’s the opportunity. If this holds, this becomes a full sequence: 👉 Reversal Extension → Crossback → Trend Expansion Right now: 👉 We are at Step 1Longby QuantumEdge_QTGUpdated 0
MERL: ready for a bounce? key levels and targets to watchMERL Who’s brave enough to knife‑catch this one? MERL just got hammered with the rest of the alt market after the latest risk‑off wave in crypto, as traders rotate back into majors according to industry sources. Today’s headlines about increasing regulatory noise around smaller projects are not helping sentiment, so liquidity is thin and moves are exaggerated. On the 4H chart, price is parked right on that green demand zone after a vertical dump, while RSI is buried in oversold territory with early signs of flattening. I’m leaning toward a relief bounce long from here, targeting the nearest liquidity pockets around 0.033 and then 0.036, where previous volume spikes and a big supply block sit. If buyers actually show up, this could turn into one of those classic “dead cat that jumps higher than expected” squeezes. My play: I’m stalking reactive longs in this demand area, with invalidation just under the recent low so the risk is tight. Base case, we grind up into 0.033 then 0.036, and in a full squeeze 0.04 is on the table. ⚠️ If this zone fails and we close 4H candles below it, I step aside and let it bleed lower – I might be wrong, but I don’t argue with fresh lows.by Trade_Logic_AI1
MERL: potential bounce ahead? key levels to watch for todayMERL. Buying blood or catching a falling knife? While majors are cooling off after the latest risk mood swing, small caps like MERL are quietly grinding into strong support. No fresh FUD around the project, just a broad alt flush that scared out late buyers. On the 4H chart price is sitting in the big orange demand block where previous accumulation started, with visible volume parked in this area. RSI bounced from oversold and is curling up, so I’m leaning toward a corrective long: first magnet around 0.060, next liquidity pocket closer to 0.068 inside the red supply zone. I might be wrong, but I’d rather stalk entries in demand than chase green candles into resistance. My base plan: look for a bullish 4H reaction inside 0.049–0.052 and build a tight long there ✅. If buyers fail and we get a clean 4H close below the lower orange band around 0.048, the idea dies and we can even see a slide toward 0.043–0.044 ⚠️. I’m flat for now and waiting for the next 4H candle to confirm whether the bounce is real or just a dead cat.by Trade_Logic_AI3
Merlin Chain recovers, back above long-term supportMERLUSDT is moving back above long-term support, the low from February 2025. Revealing the last move as a stop-loss hunt event. MERL broke below support and stayed below just barely in order to activate all stop-loss orders. As this goal is now complete, the market recovers. Above the February 2025 low, bullish potential becomes active once more. The support in question is the one that initiated a 800% strong bullish move. It happened last year, it can easily happen again. The strong correction simply means buyers took profits, the market taking profits. Once profit taking is over we get a reversal and the start of a new bullish cycle. The last bullish cycle last 294 days. The present one can unravel much faster or it can be similar. It happened that MERLUSDT moved in isolation to the rest of the market, and this is a desirable event. For this project, anything goes. When a project creates its own chart regardless of marketwide action, it should be traded as it means real human action is happening behind the scenes. Most trading pairs move based on algorithms which makes for very similar and repeating patterns marketwide. These are easy to predict but also hard. Since everything is the same, the market can easily trick the masses. When it comes to organic price action, it is a completely different game. The action is happening at the bottom with a recovery taking shape. The week is early and MERL is green. This implies plenty of room for prices to move higher; a good trading pair. Thank you for reading. Namaste.Longby MasterAnanda115
MERL — Strong Bull With Squeeze Fired**MERL — Strong Bull With Squeeze Fired, Parabolic Recovery & Triple Candle Pattern Confluence** **Overview** MERL is flashing one of the strongest multi-signal setups across the board — 72.7% bullish alignment, a squeeze that just fired with bullish momentum, and an extraordinary 87x parabolic recovery ratio. After a tiny -0.9% retrace, the 81% bounce is massively disproportionate, indicating explosive demand reclaiming price with barely any pullback to work with. Premium is in slight backwardation with volatile standard deviation and a rising MeanZ — the structural backdrop is shifting. **Price** Trading at 0.07132 spot / 0.07110 futures. Premium sits at -0.31% (Z: -1.3), a mild backwardation that favors long positioning. The futures discount suggests shorts are paying longs through funding — a structural tailwind for bulls that the -338% APY yield confirms. **Bias** Strong Bull with 45.5% spread. EMA structure reads 6:3 bullish — the majority of timeframes have price above EMA50 with EMA50 above EMA200, confirming clean uptrend alignment. Ichimoku TK is dominant at 10:3 bullish, and C>T reads 11:3 bull — price is holding above Tenkan on almost every timeframe. Candle bias at 9:5 bull shows consistent upward pressure. This is broad-based bullish alignment across all major signal categories with no contradictions. **Volume** All three Z-scores sit at Average — Spot 0.32, Futures 0.02, Combined 0.05. Volume isn't screaming yet but it's present and steady. F/S ratio at 3.78x is normal for this pair. Momentum is rising at 0.42 — the first sign of volume acceleration. Structural momentum expanding at 136.2% confirms the trend has underlying volume support. Both spot and futures squeezes are building (1 and 2 bars respectively), with structural momentum expanding — setting up a potential dual squeeze fire. Liquidations clear and no whale activity — this is organic participation. **S/D** dd:1 ss:3 — supply zones outnumber demand 3 to 1 overhead, which is the primary structural challenge. However, the squeeze fire and parabolic recovery suggest price has the momentum to challenge these zones. Each supply break would add fuel as trapped shorts are forced to cover. **Momentum** The squeeze just fired with Bull ↑ momentum at bandwidth 45.89% — the compression was significant and the release carries meaningful energy. Three White Soldiers detected on 3 timeframes with zero bearish — this is a heavyweight continuation pattern confirming the bullish thesis. One Morning Star and one Evening Star create mild pattern noise, but the 4:1 bullish pattern total overwhelmingly favors the upside. The combination of squeeze fire plus Three White Soldiers is a high-conviction confluence. **Scenarios** 🟢 Bull (Primary): Everything aligns — 72.7% bullish signals, squeeze fired bull, 87x parabolic recovery, Three White Soldiers across 3 timeframes, backwardation premium favoring longs, and -338% APY yield penalizing shorts. If volume Z-scores push above 0.5 to Active, the move through supply zones could accelerate. The dual squeeze building on both spot and futures suggests additional compression energy waiting to release. Premium Z at -1.3 implies futures have room to catch up to spot, providing another upside catalyst. 🔴 Bear (Counter): The 3:1 supply-to-demand imbalance is the bear case — stacked resistance overhead could stall the move. The parabolic 87x recovery ratio, while impressive, also signals potentially overextended conditions that could lead to a sharp mean reversion. StdDev at 0.171% reads Volatile, meaning premium swings are elevated and conditions could shift rapidly. If volume fades and the squeeze energy gets absorbed at the first supply zone, a retrace toward the single demand zone below is the risk scenario. **Watch** Volume acceleration is the key confirmation — momentum rising at 0.42 needs to push Z-scores from Average to Active to sustain the squeeze breakout. MeanZ rising at 1.4σ shows the premium regime is shifting structurally — if this pushes above 2.0σ it signals an extreme move in premium structure. Watch for supply zone breaks as each one removes overhead resistance and traps shorts. The dual squeeze building on spot and futures could provide a second wave of energy if both fire bullish. **Risk** Premium volatility is elevated (StdDev 0.171%) which means conditions can flip quickly. Despite the overwhelming bullish alignment, the 87x parabolic ratio could be signaling a blow-off rather than sustainable trend. The 3 supply zones overhead are real resistance. Risk management should respect the nearest supply level as a partial profit target, with trailing stops below the squeeze fire candle. The backwardation and yield structurally support holding longs but position sizing should account for the volatile standard deviation environment. 👆More analysis on my profile. --- Tags: `MERL` `MERLUSDT` `bullish` `squeeze` `multitimeframe` `technicalanalysis` `breakout` `priceaction` `ichimoku` `volumeanalysis` `premium` `crypto` `threesoldiers`Longby stingrayea0
$MERLUSDT QUICK ANALYSIS (1H)OKX:MERLUSDT is experiencing aggressive sell-side pressure, confirmed by both price structure breakdown and a 4.7× abnormal volume spike. Price is down –20.78% in past 24 hours, indicating panic-driven exits rather than healthy consolidation. By aligning with the dominant trend traders can capitalize on momentum-driven downside continuation. This setup offers clear invalidation, defined risk, and downside targets aligned with high-volume distribution zones. Confluence Highlights Market Structure: Lower highs and lower lows remain intact on the 1H timeframe. Supply Zone Rejection: Willing Strong rejection from $0.1831 – $0.1915, a former support flipped into resistance. Volume Confirmation: Current Volume: $5.97M Average Volume: $1.26M 4.7× bearish volume spike, confirming institutional selling. Momentum: Red impulse candles show sellers in control, not absorption. Trade Setup Direction: SHORT Entry Zone: ~$0.1870 Stop Loss: $0.1995 (above supply & structure invalidation) Target 1: $0.1645 (minor demand) Target 2: $0.1370 (higher-timeframe demand) Until price reclaims and holds above the selling zone with declining sell volume, any bounce remains a sell-the-rally opportunity. This is a high-volume bearish continuation setup.by coinpediamarketsUpdated 3
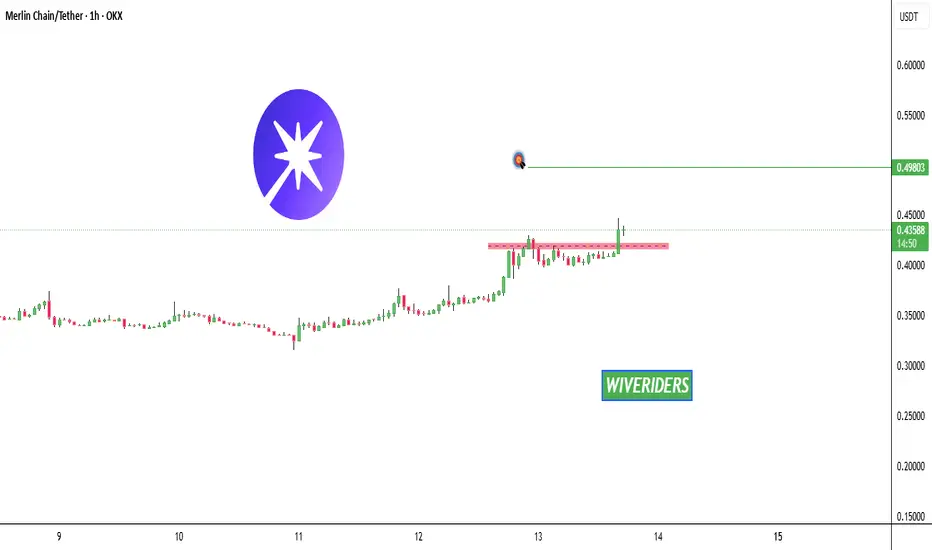
MERL Update🚨📊 MERL Update MERL has broken out above the red resistance zone 🔴🚀. If momentum continues to hold, the first target will be the green line level 🟩🎯. Longby WaveRiders23
$MERL/USDT (Swing Setup)TRADE – $MERL/USDT (Swing Setup) Type: LONG Mode: Isolated Entry Zones: • Entry 1: $0.350 – $0.344 (trendline and EMA confluence) • Entry 2: $0.333 – $0.327 (strong demand and LQ sweep area) Targets (Long-term): • TP1: $0.400 • TP2: $0.505 • TP3: $0.680 • TP4: $0.800 Stop Loss (Full Safest): $0.2920 – Below the major structure base and invalidation zone. Risk/Reward: • From average entry ~$0.34 to TP4 $0.80 = 1:4.6R, satisfying the 1:4–1:5 minimum criterion. Summary: On the 2-day chart, MERL/USDT is maintaining a strong bullish structure above the main ascending trendline and the Ichimoku cloud, confirming mid-term trend continuation. After multiple rejections near the $0.40–$0.42 resistance zone, price has retraced toward the previous breakout base around $0.32–$0.33, where demand has consistently held. Volume expansion during upward pushes and contraction during retracements indicate accumulation. The 50-EMA is trending upward and acting as dynamic support, with higher lows forming along the rising base. As long as the price sustains above $0.30–$0.32, the structure remains intact, suggesting potential continuation toward the upper range between $0.60–$0.80, and ultimately the major resistance at $1.38. In summary, the 2-day chart structure shows a healthy consolidation phase within a bullish continuation pattern. The key pivot support sits near $0.32, while a breakout above $0.42 would likely trigger momentum toward the next higher liquidity zone around $0.80. Longby SpyOnGems18
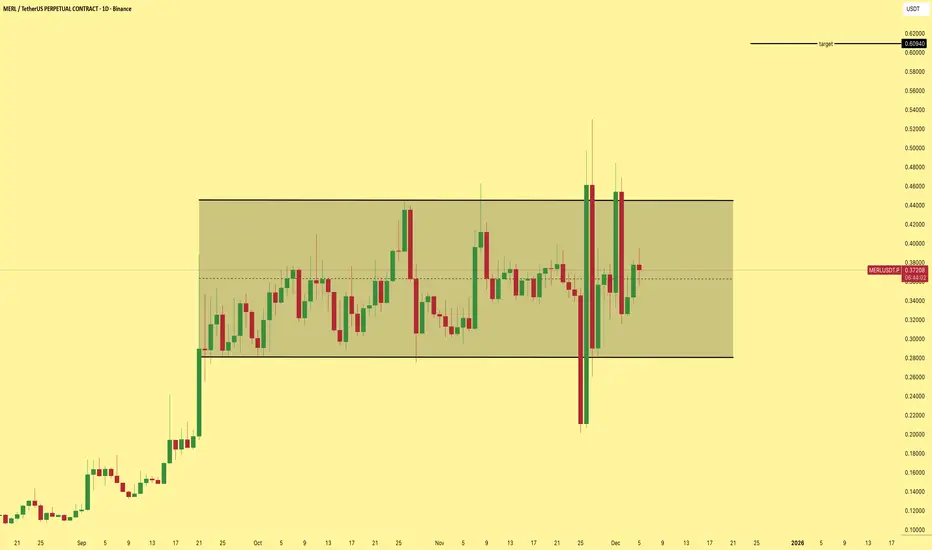
MERLAQUISUK:MERL has been in a tight range for over 70 days. Extended consolidation usually precedes expansion. A clean breakout from this base opens the door for a 70% upside move if volume confirms.Longby BandForBands0
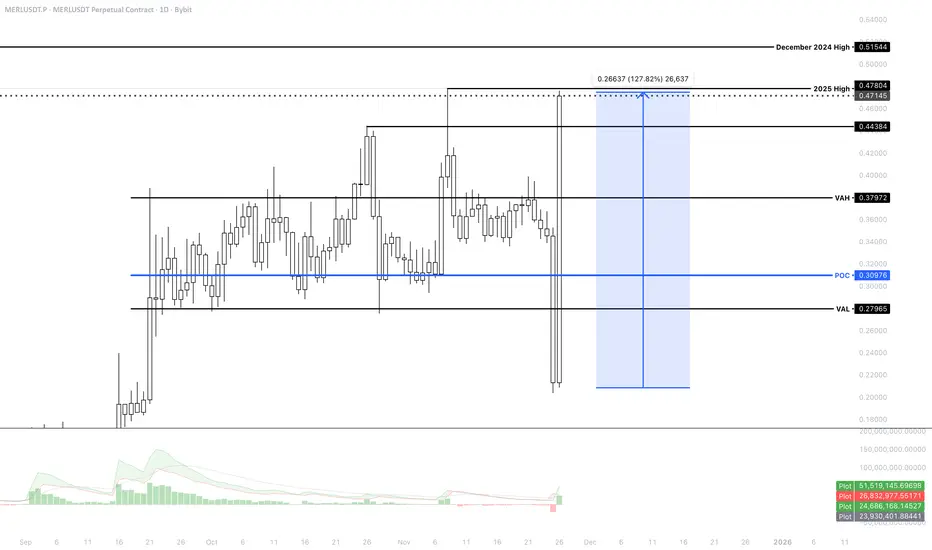
MERLMERL is in a broad bullish structure but currently inside a cooling-off phase. Key resistance: 0.37670 Key support: 0.30000, then 0.12293 As long as 0.30000 holds, the long-term trend remains positive. Break above 0.37670 reactivates the strong uptrend.by sladkamala123221
MERLUSDT PERPETUAL TRADE SELL SETUP Short from $0.35500MERLUSDT PERPETUAL TRADE SELL SETUP Short from $0.35500 Currently $0.35500 Targeting $0.34400 or Down (Trading plan IF MERL go up to $0.38 will add more shorts) Follow the notes for updates In the event of an early exit, this analysis will be updated. Its not a Financial adviceShortby salahuddin20041Updated 332
MERL Correction LoadingWhat Goes Up Must Come Down. Waiting for one of the major resistances to hit and then short the correction towards VAH.Shortby GLITCHCAPITALUpdated 446
MERL/USDT -accumulation boxMERL has formed a strong accumulation box that has acted as solid support for the past 110 days. This green zone represents a high-conviction area for DCA (Dollar-Cost Averaging) entries, ideal for building a long position. The current price structure indicates a potential parabolic move in the making. With a 300% upside target, this zone could be the final accumulation phase before a significant breakout. Key Points: Strong support zone holding for 110 days Ideal area for DCA entries marked in green Targeting 3x move from current levels Time to fill your bags slowly and patiently Accumulation precedes expansion, don't miss the moveLongby Captain-MAOUpdated 14
MERL Market Update📊 AQUISUK:MERL Market Update AQUISUK:MERL is testing the 🔴 red resistance zone. If breakout occurs with confirmation, the first target will be the 🟢 green line level. 📈 Longby WaveRiders24
MERL/USDT UPCOMING VOLUME + BREAK effectMERL is coming with a new volume, which can be confirmed in the coming time frames with a break. Longby SatochiTraderUpdated 6
MERL Markup phase inbound? Overall, PA has been building up nicely on the daily TF with a clean Wyckoff range building. In phase D we’re seeing increased volume on up bars with larger spreads than the pullback candles. Market could be ready to move into Phase E (markup) after the SOS and pullback. The pullback is sitting nicely on the range top, range 50% level and FVG of Thursdays 22/5 candle. Daily swings 1 bar and weekly 1bar/2bar swings are up. Could enter now for more aggressive play as 25 May daily high is broken indicating continuation of trend with SL under the low. However, have to be careful as BTC is primed for a potential pullback to around 98-100k~ Longby AlvinDeo96110
Buy Trade Strategy for MERL: Unlocking AI-Driven DeFi PotentialDescription: This trading idea focuses on MERL, a promising cryptocurrency that powers the Merlin AI platform—an innovative project blending artificial intelligence with decentralized finance (DeFi). MERL plays a central role in enabling AI-based trading strategies, analytics, and user-friendly DeFi tools. As demand grows for smarter, automated blockchain solutions, Merlin AI aims to streamline complex DeFi operations for everyday users and institutional investors alike. Its unique positioning in the AI x DeFi narrative, combined with active development and a growing community, strengthens MERL’s long-term potential. Still, investors must remain cautious, as the crypto space is highly volatile and influenced by factors such as market sentiment, regulatory developments, and emerging competition. MERL's future performance will depend on user adoption, continued innovation, and overall market conditions. Disclaimer: This trading idea is provided for educational purposes only and should not be considered financial advice. Investing in cryptocurrencies like MERL involves substantial risk and may result in the loss of your entire investment. Always perform your own due diligence, assess your financial situation carefully, and consult a professional advisor before making any financial decisions. Past performance is not indicative of future results.Longby MoonWaveSpot2
MERL Forming Ascending Pattern – Breakout Ahead?🚀 AQUISUK:MERL Forming Ascending Pattern – Breakout Ahead? 📈 AQUISUK:MERL is currently forming an ascending pattern! 📊 If the price continues to rise, we could see a strong breakout soon. Keep an eye on this potential setup! 🔥 Let’s ride this breakout together! 💼💸by WaveRiders22
Merlin Chain Simple TA: 282% Target —535% Bullish WaveCurious name... The candle 11-Nov. has the highest volume of all candles and it closed green. The action is happening daily above MA200. MERLUSDT (Merlin Chain) is now bullish. I don't want to annoy you with too many details... We have a 282% target short-term and a 535% bullish wave. The numbers can be seen on the chart. Let's see how it goes... Will it move fast? Will it move next? Or, are we going to be left holding the pair with a long wait? Patience is key. The chart is pointing up. Define support and resistance levels, secure a great entry —the market takes care of the rest. Thank you for reading. Namaste.Longby MasterAnanda12

 Long
Long