Is Meta in the Danger Zone Heading Into Earnings?Meta Platforms NASDAQ:META has struggled recently, down some 13% from its July 15 near-term high and about 25% from its August 2025 all-time peak (although the stock has also gained nearly 15% from its March low). This plus some weakness for growth stocks and the broader market make for a very interesting approach to this week's upcoming Meta earnings release.
Let's get into it, shall we?
Meta's Fundamental Analysis
META plans to go to tape with Q2 numbers on Wednesday after the bell, with the Street looking $7.22 in GAAP earnings per share on $60.3 billion of revenue.
That would represent a 1.1% gain from Meta's $7.14 year-ago EPS print, while revenue would have increased by roughly 27% year over year.
However, the analyst community is somewhat split on how this release will play out, with 24 of the 45 sell-side analysts that I know to cover META having upwardly revised their earnings estimates since the period started. (Thirteen of the remaining 21 analysts have revised their numbers lower, while eight have left their expectations unchanged.)
Of course, given the market's landscape of late, investors might focus less on Meta's earnings and revenues and more on its capital expenditures and free cash flow. That's what happened last week when Meta's fellow "Magnificent Seven" stocks Alphabet NASDAQ:GOOGL NASDAQ:GOOG and Tesla NASDAQ:TSLA reported results.
Meta's Technical Analysis
Next, let's go to META's chart going back some 2-1/2 months and running through Tuesday morning (July 28):
Readers will see that from late May into early July, META put together a falling-wedge pattern of bullish reversal.
Shaded in tan, that set-up worked perfectly and Meta rallied into mid-July ... when the stock's bubble burst.
META first gave up its 200-day Simple Moving Average (or "SMA," denoted by a red line). This probably forced some portfolio managers to reduce their long-side exposure.
The stock then surrendered its 21-day Exponential Moving Average (or "EMA," marked with a green line) a day or two later. This likely prompted a number of swing traders to switch sides as well.
Now Meta is testing its 50-day SMA from above. The stock broke below this level (marked with a blue line at $605.10) late last week, but hasn't definitively lost it yet.
But should Meta do so after already giving up its 200-day SMA, the stock's outlook could become really dicey.
Some portfolio managers will likely lop off another pound of flesh in that case. Then again, some managers will likely start adding back the shares they sold in mid-July if Meta finds support at the 50-day line.
Moving on to the other technical indicators in the chart above, Meta's Relative Strength Index (the gray line marked "RSI" at the chart's top) has been weakening, but still remains close to neutral.
However, the stock's daily Moving Average Convergence Divergence indicator (or "MACD," denoted by blue bars, a black line and a gold line at bottom) has recently started to look a lot more bearish.
The histogram of the 9-day EMA (the blue bars) dropped below the zero-bound within the past few days, which is a short-term bearish sign.
The 12-day EMA (black line) has also crossed below the 26-day EMA (gold line). That's also bearish -- although the fact that these lines are still in positive territory might mute this signal a little bit.
(Moomoo Technologies Inc. Markets Commentator Stephen "Sarge" Guilfoyle had no position in META at the time of writing this column.)
This article discusses technical analysis, other approaches, including fundamental analysis, may offer very different views. The examples provided are for illustrative purposes only and are not intended to be reflective of the results you can expect to achieve. Specific security charts used are for illustrative purposes only and are not a recommendation, offer to sell, or a solicitation of an offer to buy any security. Past investment performance does not indicate or guarantee future success. Returns will vary, and all investments carry risks, including loss of principal. This content is also not a research report and is not intended to serve as the basis for any investment decision. The information contained in this article does not purport to be a complete description of the securities, markets, or developments referred to in this material. Moomoo and its affiliates make no representation or warranty as to the article's adequacy, completeness, accuracy or timeliness for any particular purpose of the above content. Furthermore, there is no guarantee that any statements, estimates, price targets, opinions or forecasts provided herein will prove to be correct.
Moomoo is a financial information and trading app offered by Moomoo Technologies Inc. In the U.S., investment products and services on Moomoo are offered by Moomoo Financial Inc., Member FINRA/SIPC.
TradingView is an independent third party not affiliated with Moomoo Financial Inc., Moomoo Technologies Inc., or its affiliates. Moomoo Financial Inc. and its affiliates do not endorse, represent or warrant the completeness and accuracy of the data and information available on the TradingView platform and are not responsible for any services provided by the third-party platform.
In-depth trading ideas
META: Horizontal Consolidation, Another Buying OpportunityMeta Platforms (META) stock recently traded around $553.22 following a sharp post earnings drop driven by surging artificial intelligence spending, massive infrastructure guidance, and shrinking free cash flow. Major firms including Goldman Sachs, Evercore ISI, and Scotiabank lowered their price targets to reflect near-term margin compression, though most maintained a longer term buy consensus.
Technical Insight:
Meta is trapped inside a ranging channel, Roaming in a sideways formation. The stock have been moving on this parallel structure of support and resistance, for a couple of months now. The best alternative stills remains buying at the support zone and selling at the resistance, while we anticipate patiently for possible breakout outside the channel.
Key Points:
Hold on buy position, with target eyeing $680, as next potential bullish.
Thanks for reading.
Meta - The final textbook entry!🎲Meta ( NASDAQ:META ) is currently testing clear support:
🔎Analysis summary:
Despite the major corrections on Meta during 2022 and 2025, the underlying trend is clearly bullish. And with a lot of short term volatility lately, Meta retested a significant higher timeframe support area. Meta is currently preparing another bullrun much higher.
📝Levels to watch:
$520
Keep your #LONGTERMVISION🙏
— Phil (@TheTraderPhil)
Week 31 of 52 | META: Revenue Up 28%—So Why Is the Stock CrashinNASDAQ:META revenue is still growing. Ads are still working. Users are still spending time on Facebook, Instagram and WhatsApp.
So the problem is not the main business.
The problem is how much money Meta is spending on AI.
Revenue grew 28% to $60.8 billion, but costs increased much faster. Meta generated almost $32 billion in operating cash flow and spent more than $31 billion on infrastructure, data centers and AI development.
That left the company with less than $1 billion in free cash flow for the quarter.
That is what the market did not like.
Meta is basically telling investors: the business is strong, but most of the cash is going back into AI for now. The question is whether those investments will eventually produce enough growth to justify the spending.
Technically, the chart was already showing weakness before earnings.
META has continued forming lower highs, and every major rally has been rejected near the descending trendline. The latest rejection around $680 kept that bearish structure intact.
Now the stock is approaching the $530–$540 area after earnings.
I would not call that confirmed support yet. It is simply the first level where the market is reacting.
The more important area is between $510 and $485. That zone previously produced a strong rally and could attract buyers again.
If META holds this area, the first major resistance on a recovery would be around $580–$600. That was support before the drop, so it may now become resistance.
A move back above $600 would be the first real sign that buyers are taking control again.
On the other hand, a daily close below $510 could send the price deeper into the support zone, with $485 and possibly $460 becoming the next levels to watch.
My view is simple:
Meta is not falling because the business is broken. It is falling because investors are losing patience with the amount of money being spent before seeing a clear return.
For long-term investors, $510–$485 could become an interesting area to slowly build a position.
For a swing trade, I would rather wait for confirmation instead of buying immediately after the gap.
The business is still growing.
Now Meta has to prove the AI spending is worth it.
Support: $540 – $510 – $485
Resistance: $580 – $600 – $640
This analysis is for educational purposes only and is not financial advice.
Meta (META) LONG — 1D ALMA Setup (WR 78% · avg RR 1.4)█ SETUP
NASDAQ:META · 1D · long only.
(Context: Meta Platforms — ads + Reality Labs / AI infra beta — trades with Mag7 and hyperscaler capex tape, not a discretionary “buy the print” call.)
ALMA Averaging Strategy: ALMA 3 / σ2, SD band 2, min diff 3/3 (primary) · twin 4/3, 25% per bar, up to 4 adds, hard stop −10% from average entry.
Strategy Tester (META 1D):
Win rate 78% · profit factor 1.8 · max drawdown 11%
Avg winning trade +14.5% · avg losing trade −10.4%
Typical hold ~39×1D bars on winners — Mag7 mean-reversion grid on the daily Averaging template
═
█ WHY NOW
Fresh 1D ALMA long on the 29 Jul 13:30 UTC bar ~ $593.3 — two concurrent Averaging templates armed on the same cash close (each lot 1 of 4).
Fill sits into the pre-/around-print wash with spot ~$590–593 on the board — process re-arm on the daily ALMA tag, not a size-up into a guidance call. Hard stop −10% from fill ~ $534 . Exits follow Pine ALMA flip + min diff or the hard stop. Scale-in stays 25% per bar, up to 4 adds per template, if lower bars qualify.
═
█ MACRO
Sector: META = digital ads + AI / data-center spend — beta to hyperscaler capex scrutiny, Reality Labs burn, and Mag7 multiple compression more than a single index print.
Tape (28–29 Jul): earnings window for Meta / Microsoft 29 Jul ; pre-print tape already soft on AI-capex skepticism after Alphabet’s report; same session cluster: Meta–BlackRock ~$14B Texas AI data-center venture headline and “stock buckles / bitter complaints” framing into the print. Execution is 1D ALMA Averaging on the fill bar — not an EPS, capex-guide, or data-center JV forecast.
═
█ OUTLOOK
Positive factors
- Tester: 78% WR · PF 1.8 · avg win +14.5% vs avg loss −10.4% (avg RR 1.4) — hit-rate edge with bounded −10% ALMA stop path
- Twin templates arm on the same 29 Jul close ~$593 — early pyramid depth without waiting for a second discretionary add
- ALMA 1H→1D SHORT with OVERHEAT-S (1H S:6 vs avg ~3.7 · 4H S:19 vs avg ~3.6 · 1D S:9 vs avg ~3.7) — stretched below the band = mean-reversion fuel for a discount long
- Long-score ~36 vs short-score ~−36 — model discount read into the Mag7 wash
- SMC 4H/1D: bull FVG / OB enter around the ~$593 fill zone 27–28 Jul — demand tagged near entry
- 1H EMA below-session time-stretched (Cur S:59 vs Avg S:~10.7) — deep LTF rubber band under the daily template (structure color only; idea executes on 1D)
Negative factors
- EMA 4H→1W still Below with young below-sessions on the idea ladder: 4H Cur S:9 vs Avg S:~10.6 · 1D Cur S:5 vs Avg S:~6.4 · 3D Cur S:2 vs Avg S:~12.3 · 1W Cur S:2 vs Avg S:~7.8 — bounce not mature on slow TFs; downside can extend
- ALMA 15m already LONG (L:1) while HTF ALMA stays SHORT — LTF repair vs HTF short-phase split
- Fractal high formed + Resistance Break TL 28 Jul — local structure not a clean breakout long
- SMC 1W still shows recent bear FVG raid history (~$646 13 Jul ) — weekly supply overhead
- Earnings / capex narrative can gap through the −10% zone before the ~39×1D sample hold completes
- First lots only (1 of 4 on each template) — thin day-1 cushion if the daily bar fails
- No VWAP Touch row on the 29 Jul board for META — no Active Support/Resistance levels to lean on here
Takeaway: the 1D ALMA strategy and 78% WR support a disciplined twin first-lot re-arm into a Mag7/earnings wash near ~$593, and ALMA OVERHEAT-S plus bull FVG at the fill frame discount fuel — but young EMA below-sessions on 4H–1W, weekly supply, and print/capex gap risk cap upside into a repair grind, not a clean guidance reclaim; nominal risk stays on the −10% hard stop / Pine exit path.
Base case: follow 1D ALMA Averaging on both templates · hold/add on qualifying daily closes while ~$590–593 cushions · mean-revert toward the mid-$640s weekly raid shelf if Mag7/ads tape stabilizes without a fresh gap through the stop.
Bear case: print/capex headline gap · lose the ~$590 pocket · template posts −10% toward ~$534 from this fill · wait for the next bar-close arm.
Chart: NASDAQ:META 1D — ALMA Averaging Strategy.
Educational idea. Live position — past backtest ≠ future results. NFA.
META Platforms Options Ahead of EarningsIf you haven`t bought META before the rally:
Now analyzing the options chain and the chart patterns of META Platforms prior to the earnings report this week,
I would consider purchasing the 590usd strike price Calls with
an expiration date of 2026-8-21,
for a premium of approximately $36.15.
If these options prove to be profitable prior to the earnings release, I would sell at least half of them.
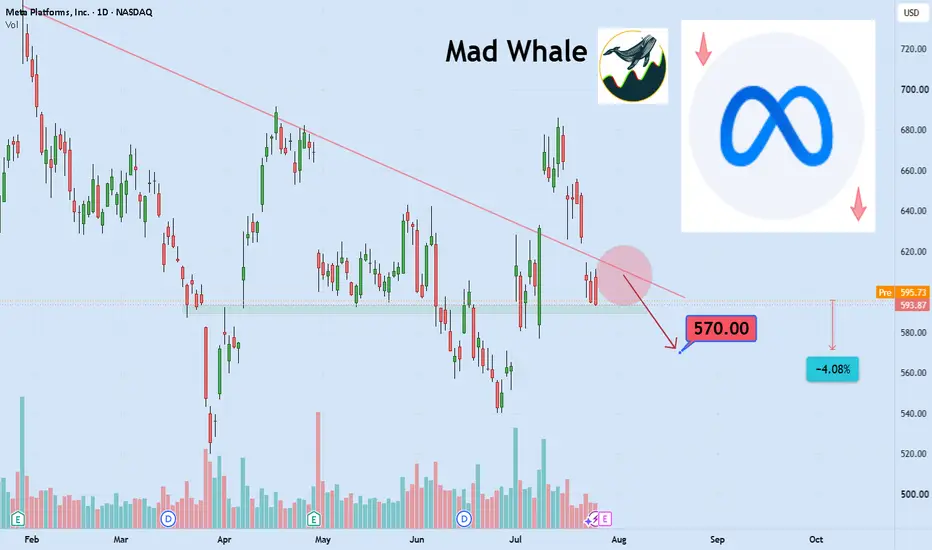
Geopolitical Risks And Technical Weakness Could Push Meta LowerHi,
Apart from the geopolitical factors, which are the main reason behind my bearish view on Meta, the price is now approaching a key resistance trendline and an important daily support zone. If this support level is lost, a drop of at least 4% with a target of $570 would be a very realistic scenario.
Meta holders - quick update The stock is taking a hit on the EPS miss and continued heavy capex spend, and the chart reflects it.
We’re clearly in a downtrend, printing lower highs consistently. There was one fake‑out attempt, but it went nowhere and momentum faded immediately.
From a trading or short‑term swing perspective, this is not the chart you want to be involved with right now. Structure is weak, trend is down and buyers aren’t defending levels with any conviction.
If you’re a long‑term investor, different story — you already know the drill. Ignore the noise, let the volatility do its thing, and DCA when the time is right. META isn’t going anywhere; the business is solid, but the chart setup simply isn’t attractive for active trading at the moment.
Right now, there are cleaner opportunities and better risk/reward setups in the market — especially among the heavily discounted AI names that have been beaten down but are starting to show signs of life.
GL
Ley
Why Meta Had to Borrow Billions This QuarterMeta delivered another strong quarter on the surface, with Q2 revenue climbing 28% year over year to $60.8 billion, slightly ahead of expectations. GAAP EPS fell 13% to $6.18, but that was largely due to $2.4 billion in legal costs tied to youth safety lawsuits and $1.2 billion in severance expenses
Excluding those one time charges, operating income would have increased 9% instead of falling 8%. Even so, investors focused on the bigger picture, sending the stock down as much as 10%
💸 AI Spending Eats Up Cash Flow
The biggest concern was cash flow. Meta generated $31.9 billion in operating cash flow but spent $31.1 billion on capital expenditures and finance leases, leaving just $784 million in free cash flow, a 91% drop from a year ago. The company also borrowed $24.9 billion and paused share buybacks. Meta has the financial strength to support these investments, but this quarter marked the first time its AI infrastructure spending essentially consumed all of its free cash flow and pushed it into the debt market
🏗️ Bigger AI Plans, Bigger Price Tag
Meta also raised the lower end of its 2026 capital spending forecast for the second quarter in a row, now expecting between $130 billion and $145 billion. To help manage those costs, the company is partnering on a 1 GW data center in El Paso, where BlackRock will own 80% of the project while Meta keeps a 20% stake and leases the entire facility. The arrangement reduces the upfront cash commitment but does not change Meta's long term investment plans
🤖 AI Is Already Driving Ad Growth
The encouraging part is that AI is already improving Meta's core advertising business. Ad revenue grew 27% as impressions increased 14% and average pricing rose 12%. The company's latest AI models drove an 8% increase in ad clicks and a 16% improvement in Facebook conversions. Meanwhile, Advantage+ reached an annual revenue run rate above $75 billion, showing that AI investments are already producing measurable business results.
👥 User Growth Keeps Momentum Strong
User growth also remained strong. Family Daily Active People reached 3.6 billion, Instagram surpassed two billion daily users, and Threads grew past 500 million monthly users. WhatsApp's paid messaging and subscription offerings also helped Family of Apps' "other" revenue exceed $1 billion for the first time.
Outside advertising, Mark Zuckerberg outlined additional ways to generate returns from Meta's AI investments, including paid access to its AI models and potentially renting excess computing capacity to outside customers, although building a competitive cloud business would still require significant investment
🔮 Monetization Is Coming, But Patience Is Required
Reality Labs posted another $4.6 billion operating loss despite revenue increasing 16%, helped by stronger demand for AI powered smart glasses. Looking ahead, Meta expects Q3 revenue between $61 billion and $64 billion, with the midpoint slightly below Wall Street's expectations, while full-year expenses are now projected at $165 billion to $169 billion. Meta's advertising business is becoming more profitable thanks to AI, and new monetization opportunities are starting to emerge.
The challenge is that the company's spending is happening immediately, while many of those new revenue sources will take much longer to make a meaningful impact
META: Shares May Drop to Channel's Lower Trendline at $520Shares in Facebook and Instagram parent Meta Platforms (META) plunged 7% in extended trading on Wednesday after the Magnificent Seven member issued a light revenue forecast and reported shrinking free cash flow, sparking concerns about the returns from significant AI infrastructure investments.
Taking a closer look at Meta's chart, the price has oscillated within a long-term descending channel stretching back to the stock's record high last August, creating clear support and resistance levels for tactical traders.
If the shares continue to lose ground post earnings, monitor how the price responds near the descending channel's lower trendline, currently around $520. This area could attract strong buying interest, especially if it coincides with the RSI moving into oversold territory.
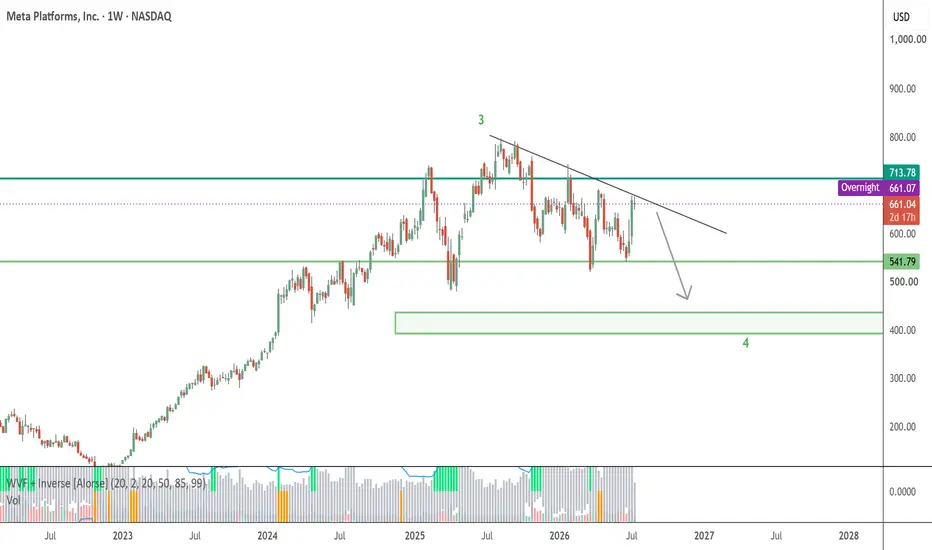
The Risk with Meta I published a chart in May, Meta to 900, which stays true on a longer time frame as the 5 wave completion of Meta shows it reaching 890-900 mark.
At present we are in the supercycle wave 4 correction which ideally completes at 0.618 Fib mark i.e. at 530$. The ensuing umove from 530 to 680 is still showing a corrective structure and does not look ready to immediately start its 900 mark journey. We are at the top of Ichimoku cloud, upper trend line mark with divergences flashing across small to large time frames which makes Meta susceptible to hit 390 -440 zone which would be at 0.5fib levels of its wave 3.
TLDR Summary: New investors should until October 2026 before entering Meta, for long term investors - the journey to 900 will continue and reach in early 2027. For short term investors, keep your positions hedged, the charts are looking poised for more correction.
Trading META's Choppy Price ActionMETA has been jumping up and down over the past few weeks and the charts are suggesting the price action will likely continue. META is at the center of the AI buildout and Capex worries, and tomorrow's earnings report will likely move the stock +/- $45.
A few interesting areas to watch would be the numerous gaps on the daily chart. Looking more broadly, META has been trading in a wedge pattern on a weekly chart, where it just rejected off the $680 level, now heading below $600. To find a confluence of support zone, I think the gap close ~ $565 is attractive as it has a high probability of being filled and the 0.618 fib level ~ $560 to back it up. Just below that level sits the rising trendline that has been respected numerous times. This offers a favorable risk reward setup.
I would be targeting the two large gaps that exists above the current price. Specifically, another retest of the descending resistance trendline would mean both the $625 and $660 gaps should get filled.
Looking at a few gap stats over time for META's daily chart, the chance of the gap downs getting filled is a highly probable event, while the gap ups also have a good chance of getting filled and have additional layers of support to back up that ~ $560 level.
Fundamentally, META is looking to capitalize on the large investment and buildout of AI and with a proprietary fair value ~ $655 and consensus price target ~ $800, there seems to be a good opportunity for investors that are willing to wait for another retest of prior support and wait for the gaps to fill before heading higher.
* A similar trade can be seen back in June 2026 where META pulled back to retest the support trendline while filling a prior gap right before exploding upward over $100. Looking for a similar setup.
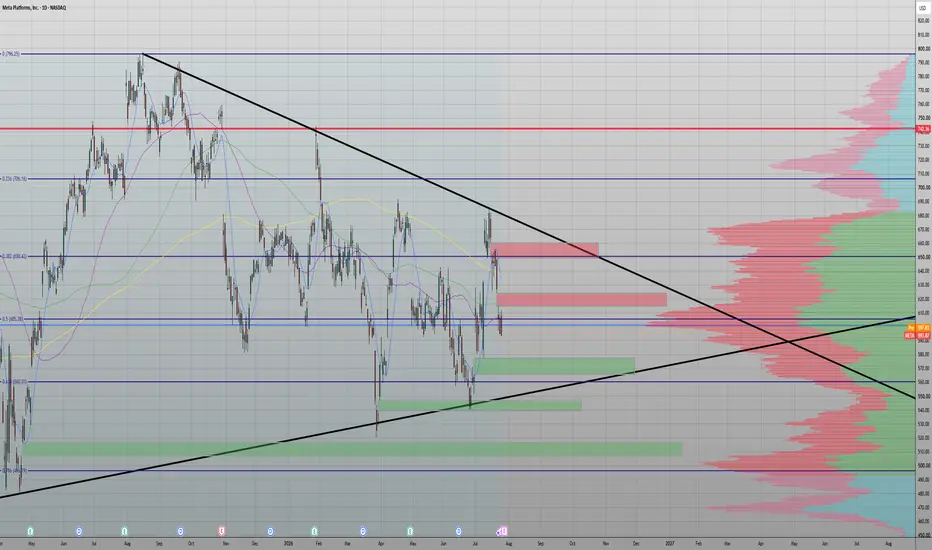
META: Earnings report , make or break META has been in a downtrend since the double top formation made at 683$ and it may already be giving signs to its next big move.
Down more than 13% since mid July , META has now arrived at a key area , the midrange of the parallel channel and it is make or break for the stock. A hold of this level , will likely lead to another retest of the months high at 683$. This will have to coincide with strong earnings this week.
On the other hand, a loss of 580$ will likely take us towards the bottom of the channel towrads 539$, 520$ and possibly as low as 478$.
For now , the price is favouring the bears: a key loss of the highs coinciding with the top of the channel do show weakness.
This week is huge for META. Make sure to look out closely for how price reacts from current levels.
Hope you liked today’s analysis, make sure to follow for more.
META (NASDAQ) | 1W Technical AnalysisMeta is approaching a critical technical inflection point after completing a massive multi-year Head & Shoulders reversal pattern. Price has already broken below the long-term ascending trendline and is now testing a major confluence resistance zone, where the broken trendline intersects with the descending neckline.
The current rally appears to be a classic bearish retest rather than the start of a new bullish impulse. Unless buyers reclaim this resistance cluster with strong weekly closes, the broader technical outlook remains bearish.
Technical Outlook
Bias: Bearish (Medium to Long Term)
The Head & Shoulders pattern is well-defined, signaling a potential trend reversal after a prolonged uptrend.
Price has lost the long-term ascending trendline, confirming deterioration in market structure.
The recent rebound is testing the breakdown area, where previous support has now turned into resistance.
Rejection from this zone would confirm the retest and strengthen the probability of a continuation lower.
Key Resistance
640–660 USD: Initial supply zone.
690–710 USD: Confluence of the descending neckline and broken trendline.
750 USD: Right shoulder high and major bearish invalidation level.
Key Support
518 USD: Primary downside target and major horizontal support.
400 USD: Secondary target if selling pressure accelerates and the weekly support fails.
Trading Scenario
As long as price remains below the descending resistance and fails to reclaim the 690–710 USD zone, the prevailing outlook favors further downside.
A confirmed weekly rejection from the current resistance would increase the probability of a decline toward 518 USD. If that support breaks decisively, the broader Head & Shoulders measured move opens the door for an extension toward the 400 USD region.
Conversely, a weekly close above 710 USD, followed by sustained acceptance above the broken trendline, would invalidate the bearish thesis and suggest that the recent breakdown was a false move.
Conclusion
Meta remains at a decisive technical level. The chart reflects a large-scale Head & Shoulders reversal, reinforced by a break of the long-term uptrend and an ongoing retest of former support. Until bulls reclaim the broken structure, the path of least resistance continues to favor the downside, with 518 USD as the first major objective and 400 USD as the longer-term bearish target.
Meta (META): news flow leaning bullish — the net read
The wire has been busy on Meta (META). Weighing the stories from the last 24h against each other — new against old, and tracking which ones have already faded:
+++ Sorry, AI Bears: Meta, Microsoft, and Google Lead Record Data Center Demand - 24/7 Wall St.
+++ Mark Zuckerberg's Meta Is in Talks for a $10 Billion Anthropic Deal That Would Make Meta the Fourth Major Cloud Provider. Meta Stock Reports Q2 Earnings on July 29.
+++ OpenAI's cloud spending could hit $750B by 2030: report
+++ From OpenAI to Nvidia, firms channel billions into AI infrastructure as demand booms
++ AI Data Center Boom Strains Global Construction Capacity - Data Center Knowledge
Net read: +++ leaning bullish — top of our scale.
What this is: a measure of which way the *news* is leaning right now — not a promise about price. Strong reads fade as the market digests them, and a fresh headline can flip the whole picture. That's exactly what we track.
The rule of this account: every read gets a public update once the market has had time to speak — the ones that landed and the ones that didn't. No deleted reads. Watch for the update on this idea.
(Informational only — not financial advice, not a signal.)
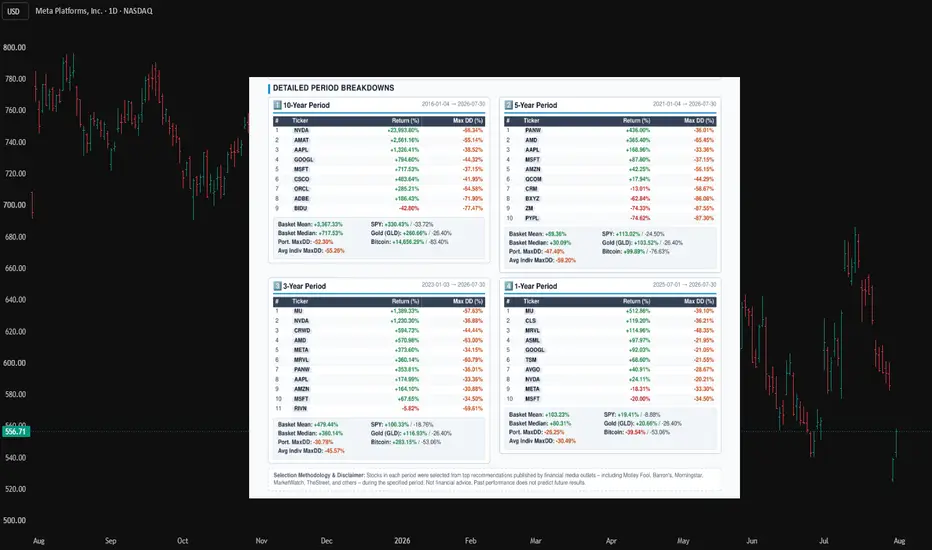
Multi-Period Study: Tech Stocks vs. Gold, Bitcoin & S&P 500 🎯 Objective
This study evaluates how **consensus technology stock recommendations** from leading financial publications performed across four different investment horizons compared with three widely followed benchmarks:
- 📈 S&P 500
- 🥇 Gold
- ₿ Bitcoin
Four historical recommendation baskets (approximately **10-year, 5-year, 3-year, and 1-year**) were constructed and evaluated using two investor-focused performance metrics:
- Total Return** (including dividends where applicable)
- Maximum Drawdown** (largest peak-to-trough decline)
The objective was to evaluate not only which investments generated the highest returns, but also the level of risk investors experienced while achieving those returns.
---
🛠️ Methodology
1. Basket Construction
For each investment period, technology stocks were selected from recommendations published by leading financial publications and research platforms *(e.g., Motley Fool, Barron's, Morningstar, MarketWatch, TipRanks, and Seeking Alpha)* near the beginning of each period. Stocks were ranked by recommendation frequency across multiple sources to produce a consensus basket. Selections were independently cross-checked to ensure consistency.
2. Performance Measurement
Each basket was evaluated from its respective start date through a common end date using:
* Total Return** based on adjusted closing prices *(including dividends and splits)*.
* Maximum Drawdown**, measuring the largest decline from a previous peak.
* An **equal-weight buy-and-hold portfolio** was created for each basket to measure overall portfolio-level performance and drawdown.
3. Benchmarks & Data
* Benchmarks:** S&P 500, Gold, and Bitcoin over the exact same investment windows.
* Data Source:** Historical market data obtained from Yahoo Finance and processed via Python in Google Colab using a consistent, reproducible framework.
---
📈 Results
✅ Return: Basket vs. Benchmarks
- 🚀 **2016 Basket:** Mean return **+3,367%**, comfortably outperforming the **S&P 500 (+330%)** and **Gold (+261%)**, although Bitcoin produced an extraordinary **+14,656%**. NVIDIA (+23,994%) accounted for much of the basket's exceptional performance.
- ⚠️ **2021 Basket:** Mean return **+89%**, underperforming both the **S&P 500 (+113%)** and **Gold (+104%)**. This was the only period where consensus technology selections failed to beat a passive index, largely due to severe declines in PayPal, Zoom and Block.
- 🏆 **2023 Basket:** Mean return **+479%**, decisively outperforming the **S&P 500 (+100%)**, **Gold (+117%)**, and **Bitcoin (+283%)**, making it the strongest overall basket in the study.
- 📈 **2025 Basket:** Mean return **+103%**, substantially outperforming both the **S&P 500 (+19%)** and **Gold (+21%)**, while Bitcoin declined **−40%** over the same period.
---
⚠️ Risk: Maximum Drawdown & Diversification
- ✅ The **largest diversification benefit** occurred in the **2021** and **2023** baskets, where the portfolio's maximum drawdown was **11.8** and **14.8 percentage points** smaller than the average drawdown of the individual stocks.
- ⚠️ Every technology basket experienced a **larger maximum drawdown** than the S&P 500 over the same investment period, demonstrating that higher returns required accepting greater volatility.
- 🥇 Gold produced the **same maximum drawdown (-26.4%)** across all four investment windows because its largest decline occurred entirely within **Jan–Jul 2026**.
- ₿ Bitcoin's maximum drawdown depended heavily on the observation window:
- **−83.4%** (2017–18 crash) appears only in the 10-year study.
- **−76.6%** (2021–22 crash) appears in windows of approximately five years or longer.
- Shorter windows capture only the more recent **−53.1%** correction (Oct 2025–Jun 2026).
---
## ⭐ Durable Favorites
Several companies appeared repeatedly across multiple recommendation periods:
- 🍎 Apple — 2016, 2021, 2023
- 🪟 Microsoft — All four baskets
- 🚀 NVIDIA — 2016, 2023, 2025
- 💾 Marvell Technology — Two baskets
- 🔒 Palo Alto Networks — Two baskets
---
🏆 Biggest Winners
- 🚀 **NVIDIA (2016):** **+23,994%**, the highest return in the entire study despite experiencing a **−66.3%** maximum drawdown.
- 💾 **Micron Technology:** Ranked #1 in both the **2023 (+1,389%)** and **2025 (+513%)** baskets.
- 🛡️ **CrowdStrike:** Returned **+595%** over three years despite a major outage-related setback and a **−44.4%** maximum drawdown.
---
❌ Biggest Disappointments
- 📉 **PayPal, Zoom and Block (2021):**
- Returns between **−63%** and **−75%**
- Maximum drawdowns between **−86%** and **−88%**
- Worst combination of return and risk in the entire study.
- 📉 **Baidu (2016):**
- Return: **−43%**
- Maximum Drawdown: **−77%**
- 📉 **Rivian (2023):**
- Return: **−6%**
- Maximum Drawdown: **−70%**
---
📌 Conclusion
Across four investment horizons, consensus technology stock recommendations generally outperformed traditional benchmarks, beating both the **S&P 500** and **Gold** in **three of the four** study periods.
The principal exception was the **2021 basket**, which was assembled near the peak of the post-pandemic growth-stock cycle. As interest rates increased and market leadership shifted, many high-growth technology companies experienced substantial valuation contractions, causing the basket to underperform the S&P 500.
In contrast, the **2023 basket** benefited from the powerful technology-led bull market driven by artificial intelligence and semiconductor demand, producing the strongest broad-based outperformance of the study.
The results also demonstrate the importance of **diversification**. Although individual technology stocks frequently experienced severe drawdowns, equal-weighted baskets consistently reduced portfolio risk relative to holding individual stocks alone.
Nevertheless, superior returns were accompanied by **higher volatility**. Every technology basket experienced a larger maximum drawdown than the S&P 500 over the corresponding investment period, illustrating that higher long-term returns required accepting substantially larger interim losses.
Several companies—including **Microsoft, NVIDIA, Apple, Micron Technology, and Palo Alto Networks**—appeared repeatedly across multiple recommendation periods, suggesting persistent analyst conviction across changing market environments. However, the study also highlights that consensus recommendations are not infallible, with companies such as **PayPal, Zoom, Block, Baidu, and Rivian** producing poor long-term outcomes.
Overall, the findings suggest that a diversified basket of consensus technology recommendations has historically been a competitive long-term investment approach. However, investment outcomes remain highly dependent on the prevailing market regime: post-bubble corrections and rising interest rates can significantly impair performance, while innovation-driven bull markets can create exceptional opportunities for technology leaders.
META | Q3 2026 - Week ChartMeta Platforms, Inc.||
MARKET-BEATING SCORE = 7/10
"engages in the development of social media applications. It builds technology that helps people connect, find communities, and grow businesses.."
-----------------------------------
PEGY 1.12 — mildly overvalued.
EPS growth 18.6% — solid.
Revenue growing 28.0% YoY — strong.
Gross margin 81.8% — strong moat.
FCF margin 22.4% — real cash generation.
D/E 0.43 — conservative leverage.
-----------------------------------
KEY RISK ASSESSMENT
"Could a policy change or major competitor disrupt growth in the next 2 years?"
Meta faces significant headwinds from evolving global regulations, particularly the EU’s Digital Markets Act and ongoing FTC antitrust litigation, which could limit data collection and acquisition strategies. The persistent dominance of TikTok in the short-form video space continues to challenge engagement metrics, while the rapid shift toward generative AI necessitates massive capital expenditures that may pressure margins. These factors, combined with potential policy shifts regarding Section 230 and user privacy, create a volatile environment for sustained growth over the next two years.
Risk Level:
High
----------------------------------
POSITIVE CATALYST OUTLOOK
"Could a policy change or competitor headwinds create a positive catalyst in the next 2 years?"
The potential U.S. ban or forced divestiture of TikTok represents a major positive catalyst, as it would likely shift significant market share and advertising revenue toward Meta’s Reels platform. Furthermore, Meta’s strategic pivot to open-source AI via Llama provides a cost and innovation advantage over competitors, enhancing its ad-targeting capabilities and user engagement. Finally, increased regulatory pressure on other Big Tech rivals may create a more favorable relative competitive landscape for Meta to expand its dominance in social commerce and messaging.
Positive Outlook:
High
-----------------------------------
Multiple Time-Frame Analysis; Color Code | Strength favors the higher timeframe.
Yearly timeframe = black
Monthly timeframe = pink
weekly = grey
daily = red
4hr = orange
1hr = yellow
15min = blue
5min = green if they are shown. (Level visibility on intervals is set to timeframe the level was found on and below to keep chart view organized.)
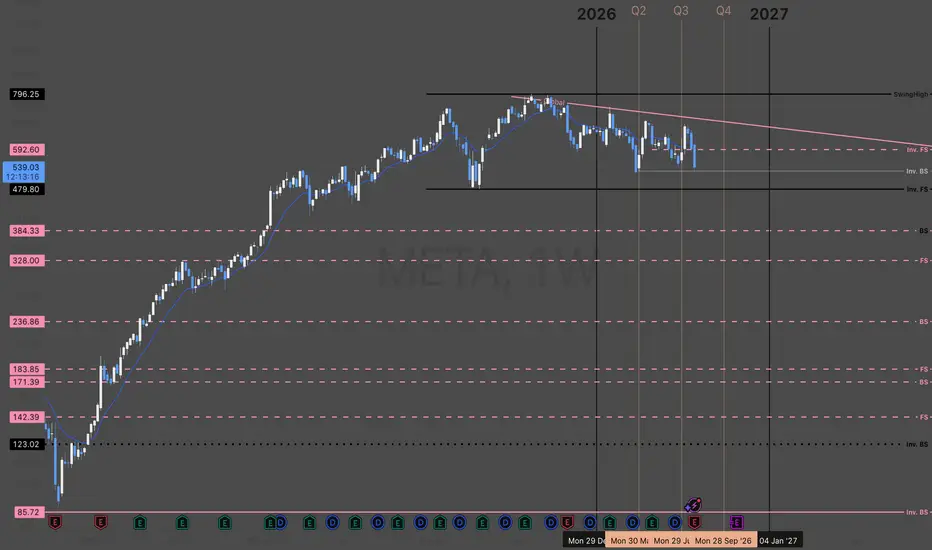
** Candle Science explained **
A Range = two or more consecutive color candles.
There are two types of ranges - accumulation and distribution. **A single candle is a range on a lower timeframe. *Find the range and define its, creation dates, prices, and risk parameters. A range is broken down into 4 candle, which create 6 levels that define the range and illustrate market structure.
Focus only on the first and last candle of each range. The last candle of each type of range has two levels - see FS & Inv. FS Candles below.
DISTRIBUTION RANGES DEFINED:
When price is above a distribution range, these candles/levels act as support.
(BS) BACKSIDE Candle - First distribution candle in a distribution range. Expectation = strong reaction to price. long wicks reaching to or away from level. high angle accumulation trends, f.v,g's
(FS) FrontSide Candle - Last distribution candle in a distribution range. Expectation = reversal, create a low angle accumulation trend. The top of Distribution candles are used as support. The bottom of the FrontSide candle is the SwingLow of the range. The FS candle wants to protect the SwingLow. When/if Price Action closes below the SwingLow, the level is invalidated. Find another range to trade.
ACCUMULATION RANGES DEFINED: When price is below an accumulation range, these candles/levels act as resistance.
INVERSE BACKSIDE (Inv.BS) - First Accumulation candle in an accumulation range. Expectation. = strong reaction to price. long wicks reaching to or away from level. Creates high angle distribution trends, f.v.g, protects the Inv.FS candle
INVERSE FRONTSIDE (Inv.FS) - Last accumulation candle in an accumulation range. Expectation = reversal, create a low angle distribution trend. The bottom of Accumulation candles are used as resistance.
The top of the Inv.FrontSide candle is the SwingHigh of the range. The Inv.FS candle wants to protect the SwingHigh. When/if Price Action closes above the SwingHigh, the level is invalidated. Find another range to trade.
$META (2-W): Pre-earning analysis, too early to buy? Apart from Microsoft, we'll also get NASDAQ:META earnings after today's U.S. session. Both reports are equally important, but the biggest focus will be Q3 guidance and expectations for the rest of the year.
A few hours earlier we'll have the FOMC. Markets are pricing around a 64% probability of no rate change, so as usual the key will be Kevin Warsh's tone. If rates stay unchanged, I expect a relatively hawkish message.
Back to $META. Looking at the weekly chart since 2023 keeps me cautious. There is still plenty of room for a much deeper correction. Any meaningful miss in the report or weaker guidance could easily trigger a much larger discount.
One of the biggest questions will be CAPEX - spending on data centers, Nvidia chips and Meta's own AI projects. The market continues to question whether this level of investment is justified in such an uncertain macro environment. On top of that, oil keeps threatening sharp rallies every time tensions with Iran escalate, while the TVC:DXY remains strong.
My subjective conclusion is that another 20-40% downside would not surprise me. That would be the area where I'd start paying much closer attention, because fundamentally the company is still producing very strong numbers, and I don't expect that to change anytime soon.
💙👽
META | June, 2026 | The time to go long has come- Timeframe: Weekly
- Trade type: Buy stop order
- Price: 605.81
- Take Profit: Open
- Stop Loss: 563.10 (-3.10 %)
Idea: Long on a breakout above last week's high - bullish momentum continuation.
Entry: Buy stop above last week’s high.
Stop-loss: Below the low of the same candle.
If the weekly candle closes below this level, the trade is invalidated.
Take Profit: Trailing stop following the lows of new weekly candles.
META Channel Down rejection targeting $485.Meta Platforms (META) has been trading within a Channel Down even since the August 11 2025 All Time High (ATH) and just last week it hit its Top (Lower Highs trend-line) and got rejected. This rejection can technically start the pattern's new Bearish Leg.
Trading already within its 1W MA50 (blue trend-line) and 1W MA100 (green trend-line), this price action displays a lot of technical similarities with the 2018 correction. That fractal also made a first Low on its 1W MA100 before rebounding to an ATH and then initiated the even stronger correction that marginally breached below the 1W MA200 (orange trend-line), completing a -43.77% total decline before rebounding.
Our main long-term Target for META remains $485, which is on Support 1 and by the time it hits, it will be below the 1W MA200 as in late 2018. If the drawdown extends as in 2018, we can see a max drop to complete a -43.77% decline at $450.
---
** Please LIKE 👍, FOLLOW ✅, SHARE 🙌 and COMMENT ✍ if you enjoy this idea! Also share your ideas and charts in the comments section below! This is best way to keep it relevant, support us, keep the content here free and allow the idea to reach as many people as possible. **
---
💸💸💸💸💸💸
👇 👇 👇 👇 👇 👇
META failed trendline will it hold the 200 sma?$480-460 has been and still is my target despite their BS news of selling excess compute. Look at their balance sheet, cash flow is being absorbed on capex, they'll have to issue debt or raise money in the bond market to keep this going.. Lets wait and see what earnings announcement does.....