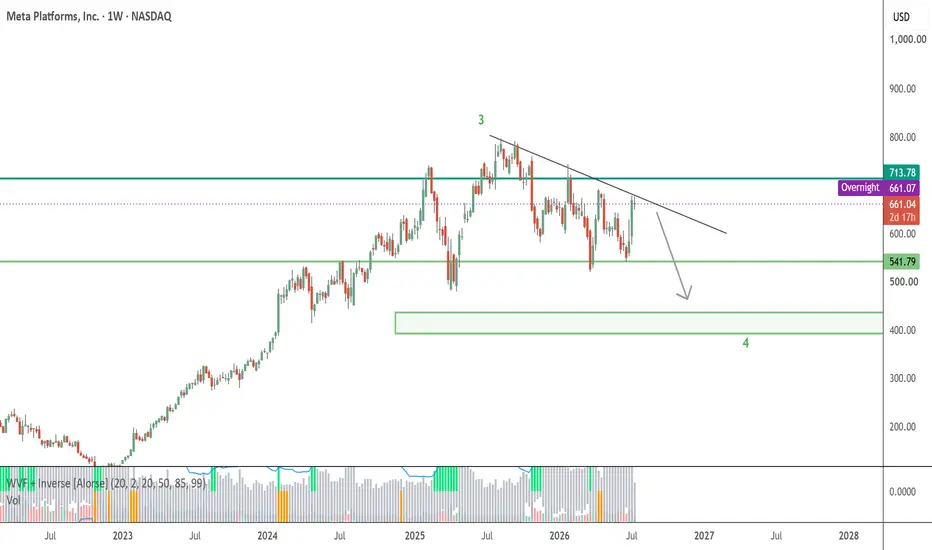
META Channel Down rejection targeting $485.Meta Platforms (META) has been trading within a Channel Down even since the August 11 2025 All Time High (ATH) and just last week it hit its Top (Lower Highs trend-line) and got rejected. This rejection can technically start the pattern's new Bearish Leg.
Trading already within its 1W MA50 (blue trend-line) and 1W MA100 (green trend-line), this price action displays a lot of technical similarities with the 2018 correction. That fractal also made a first Low on its 1W MA100 before rebounding to an ATH and then initiated the even stronger correction that marginally breached below the 1W MA200 (orange trend-line), completing a -43.77% total decline before rebounding.
Our main long-term Target for META remains $485, which is on Support 1 and by the time it hits, it will be below the 1W MA200 as in late 2018. If the drawdown extends as in 2018, we can see a max drop to complete a -43.77% decline at $450.
---
** Please LIKE 👍, FOLLOW ✅, SHARE 🙌 and COMMENT ✍ if you enjoy this idea! Also share your ideas and charts in the comments section below! This is best way to keep it relevant, support us, keep the content here free and allow the idea to reach as many people as possible. **
---
💸💸💸💸💸💸
👇 👇 👇 👇 👇 👇
In-depth trading ideas
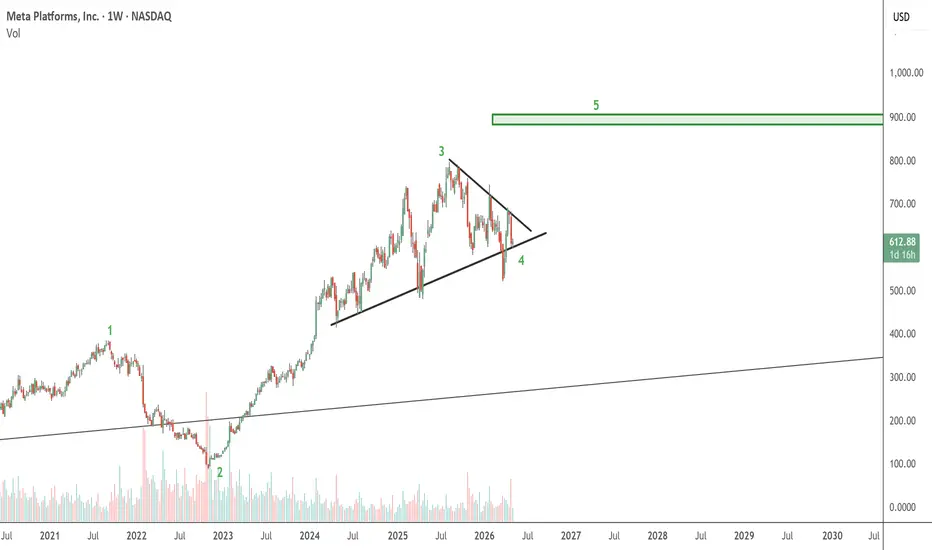
The Risk with Meta I published a chart in May, Meta to 900, which stays true on a longer time frame as the 5 wave completion of Meta shows it reaching 890-900 mark.
At present we are in the supercycle wave 4 correction which ideally completes at 0.618 Fib mark i.e. at 530$. The ensuing umove from 530 to 680 is still showing a corrective structure and does not look ready to immediately start its 900 mark journey. We are at the top of Ichimoku cloud, upper trend line mark with divergences flashing across small to large time frames which makes Meta susceptible to hit 390 -440 zone which would be at 0.5fib levels of its wave 3.
TLDR Summary: New investors should until October 2026 before entering Meta, for long term investors - the journey to 900 will continue and reach in early 2027. For short term investors, keep your positions hedged, the charts are looking poised for more correction.
Meta: Target profit hit at $681 here's where the trade standsHere's a quick follow-up on the trade idea that I had written up on Meta Platforms on 13 July 2026 ,the week in which the stock went up by fifteen percent after launching the Iris AI chip and Meta Compute. My first target of $681.85 has been hit with the stock trading at $684.60, the MACD crossover confirmation that I had highlighted back then has now been realised completely, and forty-two out of fifty-three analysts rate Meta as a strong buy with a consensus price target of $823. In this video, I take you through where the trailing stop is currently, my second and extended targets, and explain why 29 July earnings are the next critical point for this trade. Whether you are a stock trader or just a passive investor interested in seeing a MACD crossover confirmation in action, this video should be interesting.
META's Explosion at Price-Time Gate: Legendary Surge or Trap? 🌐META: The Macro Vector Matrix and the Imminent High-Velocity Expansion Phase
━━━━━━━━━━━━━━━━━━━━━━━━━━━━━━━━━━
1. Structural Hypothesis
This study is not a conventional technical analysis, nor is it a collection of retail chart patterns or speculative price projections.
Instead, it is built upon a proprietary structural framework designed to decode market cycles through the convergence of price, time, geometric symmetry, and multi-layered structural compression across multiple macro timeframes.
Within this framework, the primary macro cycle of META has evolved through a sequence of highly coordinated structural vectors, each serving as a critical stage in the development of the broader market architecture.
The entire structural matrix originates from the historical Price-Time Box extending from the absolute low of 18.87 in November 2012 to the major cycle peak of 218.62 in July 2018. This foundational coordinate established the structural validation of Vector Alpha (v.α), which subsequently became the reference point governing every major macro development that followed.
From this origin, the market successfully completed its historical expansion phases before entering the deep equilibrium reset represented by Vector Gamma (v.γ). Rather than signaling structural failure, this phase fulfilled the necessary conditions for a new macro cycle by restoring long-term balance throughout the entire framework.
Following that reset, the market generated an upward directional correction toward Vector Delta (v.δ), completing the next major stage of the structural sequence. The inherent nature and behavioral dynamics of this Delta wave clearly demonstrate the immense potential and strength of the market's next directional move, which is anticipated to be highly sharp and accelerated.
Importantly, the peak established at Vector Delta did not initiate a classical markdown phase. Instead, it marked the beginning of a sophisticated structural reorganization process that initiated precisely on February 10, 2025, and concluded on June 29, 2026.
Throughout this period, price has continued to compress internally while maintaining the integrity of the broader macro structure. From the perspective of this model, the ongoing consolidation should not be interpreted as distribution or structural weakness. Rather, it represents a controlled phase of energy accumulation, during which both volatility and structural pressure are progressively compressed in preparation for the next macro expansion cycle.
Consequently, the current market environment is viewed not as the conclusion of the existing trend, but as the final stage of structural preparation preceding the next high-velocity phase transition.
━━━━━━━━━━━━━━━━━━━━━━━━━━━━━━━━━━
2. The Architecture of Terminal Compression
The corrective and sideways development observed since META's late-2025 peak is not a random consolidation or a market driven by uncertainty. Within this framework, it represents a structured sequence that has evolved according to the laws of the price-time vector system.
Throughout this period, the market has progressively constructed a flawless contracting compression matrix through the internal vector sequence of α➔β➔γ➔δ➔, culminating at Omega (ω) in July 2026. This entire consolidation cycle has successfully completed the higher-degree Vector Omega (v.ω) structure.
This terminal structure is not only geometrically complete but also perfectly synchronized with the Vector Beta temporal anchor. Such alignment confirms that both the spatial and temporal dimensions of the macro cycle have matured simultaneously.
The 540.40 level has consequently emerged as the definitive structural floor of the entire compression process. At this coordinate, structural compression, temporal maturity, and long-term geometric symmetry converge into a single decision zone, while continuing to respect the multi-year cycle originally established from the 2012 Price-Time Matrix.
Within this model, the significance of this region extends far beyond conventional support or resistance analysis. It represents the final stage of structural equilibrium, where price, time, and behavioral organization become fully synchronized before the market commits to its next directional expansion.
Historically, whenever price-time symmetry, structural compression, and geometric alignment reach this degree of coherence, the probability of a high-velocity structural phase transition increases dramatically.
From the perspective of this framework, the ongoing consolidation should therefore be interpreted as a process of structural preparation rather than structural deterioration. The market has gradually absorbed volatility, balanced internal pressure, and accumulated the energy required for the next macro expansion.
As a result, the current environment reflects a market that has reached structural maturity. Rather than remaining trapped in prolonged consolidation, the entire macro framework indicates that META is approaching the completion of its compression cycle and is becoming increasingly prepared for a decisive, high-momentum breakout into the next phase of its long-term structural evolution.
━━━━━━━━━━━━━━━━━━━━━━━━━━━━━━━━━━
3. Structural Decision Window & Multi-Decade Confluence
The macro and multi-year pathway ahead is strictly governed by two definitive structural boundaries:
• Confirmation Zone: The definitive horizontal and vertical trigger that activates the entire macro expansion process.
• 520.26 Level: The absolute structural invalidation boundary of the bullish framework. A high-volume breach below this level will signal that the complex reorganization process within Vector Omega (v.ω) at higher degrees is not yet concluded and requires further structural duration and corrective expansion.
However, because the spatial compression, temporal symmetry, and overall market behavior are currently organized at the highest level of coherence, the probability of this invalidation scenario under the price-time vector system is approaching zero.
━━━━━━━━━━━━━━━━━━━━━━━━━━━━━━━━━━
4. Primary Scenario: Generational Expansion & The 10-Year Structural Floor (High Probability)
Upon a clean and high-velocity breakout through the initial Confirmation Zone, the market will encounter two highly critical algorithmic validation targets (the two major execution coordinates marked on the chart):
1. First Strategic Confluence Node: 1083.18
2. Second Strategic Confluence Node: 1233.86
These two coordinates are not merely price targets; they function as absolute "Time-Price Gates." A decisive breakthrough above these two specific spheres within their designated time windows will provide the ultimate structural validation for a historic, multi-decade expansion. Once these gates are conquered, the price-time vector system guarantees that META will not revisit these current structural floors for more than a decade (10+ Years).
Following the successful unlock of these time gates, the macro trend will shift into a legendary, unhindered, and high-momentum expansion phase. Based on the hyper-extended matrix shown on the chart, the long-term targets are established at:
• Fibonacci Extension Coordinate of 127.20% to price: 12190.36
• Fibonacci Extension Coordinate of 138.20% to price: 15960.53
• Fibonacci Extension Coordinate of 161.80% (4187% on the chart) to price: 20455.21
This final level represents the absolute spatial boundary and expansion capacity of the current structural cycle under the strongest possible institutional capital flows and macro accumulation.
━━━━━━━━━━━━━━━━━━━━━━━━━━━━━━━━━━
Conclusion & Research Signature
This model defines the strict conditions under which actual market velocity can be evaluated against the predefined price-time vector system. The validity of this framework is measured not by random forecasting, but by the precise alignment of price and time. Ultimately, the market reveals its own path; however, the present structural setup indicates that META is on the verge of a massive, unavoidable phase transition that will completely redefine its valuation for the next decade.
━━━━━━━━━━━━━━━━━━━━━━━━━━━━━━━━━━
✍ Mohsen Nirumand
META: Strong Earnings Forecast, Weak Relative Strength | Why I’mMETA continues to post an impressive long-term earnings outlook, with analysts forecasting approximately +40% earnings growth in 2026. Under normal circumstances, this would support a bullish thesis.
However, price action tells a different story.
Following the February 2025 tech selloff, META rebounded strongly and respected the EMA, signaling renewed momentum. But after the Q3 2025 earnings report, where net income was negatively impacted by a significant tax charge, the stock began losing relative strength.
Since then, price has remained around or below the EMA, reflecting weaker momentum and continued underperformance versus the broader market.
Although this TradingView chart only displays the EMA, my full ApexTrendEngine indicator combines trend and relative strength analysis. At the moment, the indicator remains ORANGE, which means:
🟠 No clear edge
🟠 Relative strength is weak
🟠 Patience is preferred over prediction
Strong earnings forecasts alone are not enough. I prefer to wait until price confirms the fundamental story before considering a new long position.
What I’m watching next:
* A sustained move back above the EMA.
* Improving relative strength versus the market.
* ApexTrendEngine turning back to GREEN.
This analysis is for educational purposes only and should not be considered financial advice. Always do your own research before making investment decisions.
META failed trendline will it hold the 200 sma?$480-460 has been and still is my target despite their BS news of selling excess compute. Look at their balance sheet, cash flow is being absorbed on capex, they'll have to issue debt or raise money in the bond market to keep this going.. Lets wait and see what earnings announcement does.....
Meta: Down 29% in March, Up 15% this week here is the trade.This video is an analysis of Meta Platforms and the trade setup that I have built on the 13th July 2026, a week where Meta is up fifteen percent since the company revealed its new technology named Meta Compute, fast-tracking the manufacture of its own AI chip dubbed Iris AI which will be available in September, and announced plans to start its own cloud computing business that will sell excess AI capabilities to third parties, thereby putting Zuckerberg directly in competition with Microsoft Azure and Google Cloud. With the volume close to double its average and Cathie Wood making purchases with a vengeance and MACD histogram contracting sharply towards a bullish cross, this is a full-blown analysis of Meta Platforms whereby I guide you through the EMA crossover, RSI signal, and my trading strategy for the stock ahead of the Q2 earnings of July 23.
Meta is on its way to 900We managed to correctly predict Meta's lows in the previous chart. On a larger cycle, Meta seems to now be moving towards the 900$ mark with the the slow 1 and 2 move completed.
There are quite a few signs of moving up from here, Very good risk rewards for a safe 50% upmove.
Meta Platforms:The story just changed; the chart is catching up?There has been a major shift at Meta Platforms Inc. and it was neither related to an earnings report nor to a product rollout. Rather, there has been an important strategic rebranding which will take time for the markets to value. On July 10, Meta announced the roll out of Meta Compute, along with the development of the Iris AI chip – a customized computer chip going into production this September and enabling plans to double their capacity of computing from 7 gigawatts by 2026 to 14 gigawatts by 2027. Meta is considering starting a cloud computing service which would compete directly with Microsoft Azure, Google Cloud, CoreWeave and Nebius.. The response of the market was quite clear. Meta rose by 15% over the week, ending at a price of $669.21 on Friday, with a volume of 40.61 million shares compared to an average of 23.63 million per day, which is close to double. Jim Cramer pointed out that Meta delivered on the 18% rise that he predicted, while 3Fourteen Research highlighted that the stock should continue rallying until July. Cathie Wood made purchases into the rally aggressively. Bank of America pointed out that Meta is approaching a positive inflection point for its chip aspirations in AI. The market sentiment changed from 'Meta is spending too much money on AI' to 'Meta is building the infrastructure to monetize AI at hyperscaler scale'.
The daily chart is a great example of how fast sentiment can switch when a fundamentally different story starts unfolding. What is happening here is that a stock that has been down by 29% since its all-time high of $796.25 reached in August 2025 has recovered back to levels not seen since late March, when the stock traded near the 52-week lows of $520.26. EMA configuration has changed decisively. EMA 9 and EMA 20, which were forming the resistance ceilings all through June, have been taken out and are now turning up with an angle typical of an institutional accumulation, rather than a short term rally based on a retail buying interest. The MA Cross between the 9 and 21 lines is at $579.73 and $617.03 respectively – both way below current price, indicating that the short-term and medium-term trends have reversed from bearish to bullish overnight. The RSI indicator at 66.34 is what matters the most on the chart. It is well above its signal line at 48.04 – an 18-point difference showing the strength of the buying interest this week. The RSI has not yet reached overbought territory above 70, which means there is technical runway remaining before momentum exhaustion becomes a genuine concern. The MACD is where the setup becomes most compelling. The MACD line at −9.59 is crossing above the signal line at −27.15, with the histogram at −17.56 beginning to contract sharply toward zero ;a classic early-stage bullish crossover in motion. The histogram bars are still negative but they are narrowing at pace, and a full crossover into positive territory would be one of the strongest MACD signals visible on this chart in months.
Trade recommendation
Direction : Long
Entry horizon : $647 – $665
Primary target : $681.85
Secondary target : $720
Stop loss : $598.3
Technical scenarios
Bullish momentum and technical validation : Should the MACD histogram transition into positive territory within the upcoming sessions, it would signal a robust trend confirmation alongside an RSI push north of 70. Reclaiming the $681.85 intraday peak on a daily close would validate the Meta Compute thesis, suggesting institutional re-accumulation is firmly in control. This confluence of factors points toward a sustained trajectory toward the $720 resistance zone. Ultimately, a Q2 earnings delivery that pairs advertising acceleration with strategic capex expansion would provide the fundamental fuel necessary to challenge the 52-week high of $796.25.
Mean reversion and structural support : After an aggressive 15% weekly rally, a period of healthy digestion toward the $647–$655 reclaim zone is entirely plausible as overextended momentum cools. A retreat in the RSI toward the mid-50s and a narrowing MACD histogram would represent a tactical reload opportunity rather than a trend reversal. For market participants seeking entry, the EMA 9 remains the primary zone of interest, provided that the EMA 20 at $598 continues to function as the definitive floor for this emerging bullish structure.
Bearish divergence and margin risk : The inherent volatility of Zuckerberg's AI narrative was underscored by the brief 5% dip following his July 11 commentary on long-term monetization. If the July 23 print reveals softening ad revenue or suggests that massive infrastructure spending is severely eroding margins without an immediate ROI, the stock faces a sharp unwind. Such a disappointment could trigger a rapid descent to test the $598 support level. A decisive breach of the EMA 20 would invalidate the recent recovery, signaling that the broader corrective phase from the $796 peak is resuming.
META 2026 - VENDER META 2026 - VENDER
TENDECIA DE BAIXA
NAO SEGURE
ANDANDO DE LADO / QUEDA
A technical sock analysis evaluates the product’s material composition, construction parameters, biomechanical performance, thermal regulation, moisture management, durability, and user comfort under defined conditions of use. The analysis typically considers fiber content, yarn structure, knit density, elasticity, compression behavior, abrasion resistance, seam placement, cushioning zones, and dimensional stability after washing.
META target $480- 460 still in tactMETA constantly hits the 150 MA resistance and is in a long term downtrend. META announced it's selling it's excess compute and building their own cloud system. How are they going to pay for all this? Their margins SUCK!! Does anyone know how to read a free cash flow balance sheet??? They went from hoarding cash to hemorrhaging it!!
I'm waiting for them to issue shares any day now which should hit the stock 10-20 %.
Meta (META) — A New Hope from a Fundamental ShiftMeta (META) — A New Hope from a Fundamental Shift
Fundamental Analysis
1. Meta is shifting from a major AI chip buyer to developing its own AI chips and infrastructure, aiming to reduce costs and generate revenue through its chip, infrastructure, and API/model ecosystem.
2. META remains a high-quality Big Tech stock, supported by strong ad growth, high margins, and a massive user base. However, the key question is whether its heavy AI capex can generate returns quickly enough.
3. Meta’s ad business remains strong, with ad impressions up 19% YoY and average price per ad up 12% YoY. This shows AI recommendations and ad targeting are improving ad efficiency, while its 3.56 billion Family daily active users continue to support growth.
4. A key opportunity is Meta’s Iris AI chip, expected to enter production in September 2026, as part of its plan to reach 14 gigawatts of computing capacity by 2027. Partnering with Broadcom and TSMC could reduce reliance on Nvidia and AMD and lower AI infrastructure costs.
5. Meta also plans to sell excess AI computing capacity through a cloud business. If successful, AI capex could shift from a heavy cost into a new revenue stream, similar to Amazon, Microsoft, and Alphabet.
Technical Analysis
6. After rebounding from the lower bound of the descending channel, META formed a higher low within the channel, suggesting the possibility of an uptrend shift. However, this still needs confirmation through an upside breakout above the channel.
7. The bullish EMAs confirm that the price remains in an uptrend. Although the recent pullback indicates a consolidation phase, the price has continued to hold above EMA200, suggesting that the long-term trend remains bullish.
8. If META breaks above the channel, it would signal a bullish trend continuation. However, if the price fails to break above the channel, it may retest the ascending channel support again.
9. In summary, after a long consolidation phase, the price is starting to show early signs of a reversal and is now at a critical point that could determine whether the recovery can be sustained.
Analysis by: Krisada Yoonaisil, Financial Markets Strategist at Exness
Meta Platforms, Inc.(META): Price Breaks Above Resistance LineMeta Platforms (META) is trading around $655 following a strong week of AI-driven gains. However, the stock faces mixed sentiment as EU regulators threaten potential fines, analysts predicting rising AI capital expenditures could lower free cash flow, and Meta recently discontinued an Instagram AI image generator due to privacy concerns.
Technical Outlook:
Stock is on momentum rise, after breaking above the significant resistance line. Price is currently making a pullback, in respect to the structure. We are anticipating bullish continuation, after this retest.
Key Points:
A confirmed reverse between $628-$631, activates a buy position $730, as next potential bullish.
Thanks for reading.
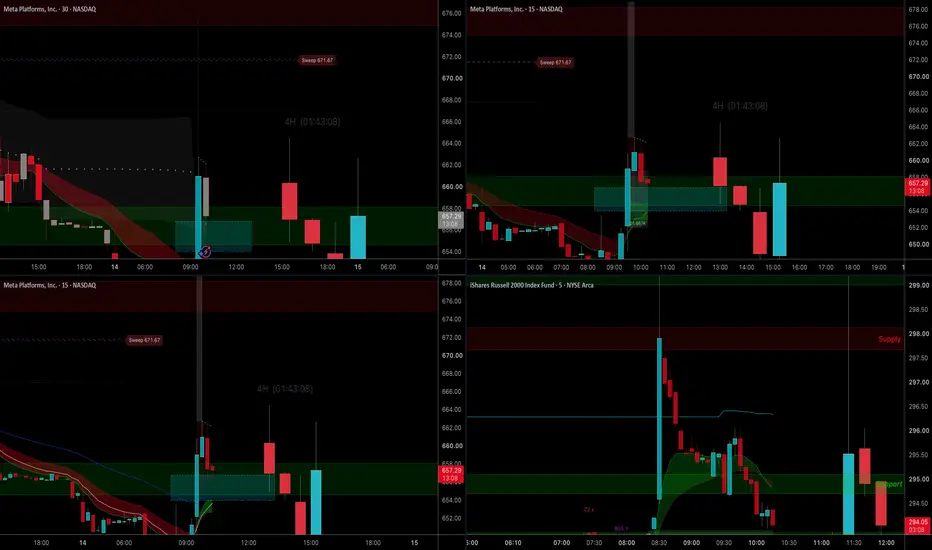
META Murderers (Negative DATA center News Stock Reaction)META is trading almost entirely on headline risk after reports tied to concerns about a deadly bacteria linked to a data center. Whether those reports prove material or are ultimately viewed as overblown will likely dictate the rest of the week's price action.
From a technical perspective, I don't see much of a sideways scenario here. The 15-minute chart is outlining two very different paths:
• Bull case: If additional reporting eases concerns or the market decides the news is being overreacted to, this could trigger a sharp relief rally. With sentiment already shaken, shorts could quickly find themselves trapped as price reclaims resistance and squeezes higher into the end of the week.
• Bear case: If the story deteriorates with more negative developments or raises broader operational concerns, support could fail and sellers may stay in control, leading to an accelerated move lower.
My current lean is that the market may be overreacting to the initial headlines, but this is a news-driven trade, not a conviction trade. Expect volatility and be ready to adapt as new information comes out.
Key takeaway: I see expansion, not consolidation. The remainder of the week looks like a directional move rather than a range.
Not financial advice. Manage risk accordingly.
META (D) — The bounce meets the long moving-average wallNASDAQ:META
Meta Platforms trades at 600.29 after a bounce that has carried it from the recent low in the 520 area up to the long moving averages, reclaiming much of the ground lost in the correction in just a few sessions. The current session moves between 581.76 and 603.58 and closes at 600.29, above the daily EMA 5 (586.29), EMA 9 (580.13) and EMA 20 (581.50), and also over the daily EMA 50 (596.64), while the ceiling is now set by the EMA 100 (613.60) and the daily EMA 200 (630.06), the two references that decide whether the bounce turns into something more. Daily momentum backs the turn. The MACD keeps its main line still below zero at −5.70 but already above its signal at −10.74, with a positive histogram of 5.04 that reflects the improvement, and the TRIX confirms with the fast line at 0.48 above the slow at −0.17 and a 0.65 histogram, a clean bullish cross. The oscillators travel in the mid zone, with the classic Stochastic (Stoch 14) at 66.4 and the fast (Stoch 5) at 64.8, while the intermediate (Stoch 50) at 41.3 and the macro (Stoch 89) at 46.1 leave room ahead. The RSI 14 at 54.0 reclaims the buy side and the RSI 2 at 66.9 comes along. The dissonant note is the daily A/D, with the fast line at −78.0 below the slow at −61.9 and a −16.1 histogram, a flow that has not turned yet and is worth watching closely.
Weekly Analysis. On the intermediate timeframe the real scale of the correction becomes clear, along with the floor the bounce leans on. Price at 600.29 sits above the weekly EMA 9 (591.36) and EMA 100 (598.41), but still below the EMA 20 (607.32) and above all the weekly EMA 50 (626.24), the major mid-term resistance, with the EMA 200 far below at 512.47 marking that the long-running underlying trend is still alive despite the drop close to 25% from the highs in the 790 area. Weekly momentum has not turned yet and that is the nuance that calls for caution. The MACD stays negative at −18.33 below its signal at −16.74 with a −1.59 histogram, and the TRIX keeps the fast line at −0.72 below the slow at −0.52, still on the sell side. The sign of hope is in the Stochastic, which prints its first bullish cross from the low zone with the fast line reactivating at 40.0 over the classic at 30.5, the intermediate at 21.2 and the macro at 31.6, an oversold picture that is starting to unwind. The RSI 14 at 47.8 approaches neutrality and the RSI 2 at 78.5 reflects the strength of the short-term bounce. The weekly A/D, by contrast, stays negative with the fast line at −76.7 below the slow at −59.4, a reminder that mid-term flow does not confirm yet.
Four-Hour Analysis. The short term is where the bounce looks strongest and where price has already reclaimed almost the entire structure. At 600.38 it trades above the EMA 20 (579.69), EMA 50 (584.56), EMA 9 (587.12), EMA 5 (593.05) and EMA 100 (596.93), with the four-hour EMA 200 just above at 613.83 as the first dynamic resistance to beat. Momentum comes along without cracks. The MACD has crossed up over zero at 4.45 above its signal at −0.79 with a 5.24 histogram, and the TRIX keeps the fast line at 0.59 over the slow at 0.28, both in positive territory. The Stochastic travels in the mid zone with the classic at 59.6, the intermediate at 51.5 and the macro at 48.1, while the fast at 37.1 suggests a very short-term pause. The RSI 14 at 58.0 and the RSI 2 at 75.4 confirm the intraday buy bias. The weak point is again the flow, with the four-hour A/D sunk with the fast line at −89.3 and the slow at −82.2, a clear divergence between a price that rises and a flow that does not back it yet.
Meta Platforms is the giant of social media and digital advertising, with Facebook, Instagram and WhatsApp at the core of an ecosystem that reaches billions of users. Its advertising business remains the cash machine, now reinforced by artificial-intelligence-based recommendation and targeting tools, while the company keeps an aggressive bet on AI with its own models and on Reality Labs. The main risk is the high level of capital investment, which pressures margins and makes the name sensitive to any disappointment about the return on that spending, on top of recurring regulatory scrutiny. The next relevant catalyst is again the quarterly earnings release, with the focus on advertising revenue growth and on capex guidance.
Key levels:
- Immediate dynamic resistance: daily EMA 100 and four-hour EMA 200 (613-614)
- Decisive structural resistance: daily EMA 200 and weekly EMA 50 (626-630)
- Recovery resistance: pre-correction highs (660-690)
- Ceiling and all-time high: 790 area
- Immediate support: daily EMA 5, EMA 9 and EMA 20 cluster (580-586)
- Dynamic support: daily EMA 50 (596.64)
- Structural support: recent low (519-520)
- Major long-term support: weekly EMA 200 (512.47)
Setup Rating — 3/5 ⭐⭐⭐☆☆ (Bounce with short-term momentum turning up and the long-term trend intact, against a demanding long moving-average resistance and an A/D flow that has not confirmed on any of the three timeframes)
✅ Positive factors:
- Short-term momentum turning up, with the four-hour MACD crossed over zero and the daily TRIX in a bullish cross
- Price has reclaimed on the daily the EMA 5, EMA 9, EMA 20 and EMA 50, which shift from resistance to immediate support
- First bullish cross of the weekly Stochastic from the low zone, with mid-term oversold starting to unwind
- Long-term underlying trend intact, with the weekly EMA 200 far below at 512.47
- Daily and weekly Stochastic with room ahead before reaching overbought
⚠️ Cautions:
- Negative A/D flow and not turning across all three timeframes, with a clear divergence against a price that rises in the short term
- Weekly momentum still on the sell side, with the MACD and the TRIX in negative territory
- The block of the daily EMA 100 and EMA 200 (613-630) is a dense resistance that can stall the bounce
- A rejection in that zone would send price back toward the short moving-average cluster and, below it, toward the recent low
👍 As long as Meta holds the daily short moving-average cluster (580-586) and the daily EMA 50 (596.64) on a close, the bounce has room to attack the immediate resistance of the daily EMA 100 and the four-hour EMA 200 at 613-614. Clearing that band on a close would open the path toward the decisive zone of the daily EMA 200 and the weekly EMA 50 (626-630), and above it toward the pre-correction highs at 660-690. The cleanest signal would be the A/D reclaiming its fast line and finally coming along with price.
👎 If price is rejected at the long moving-average wall and loses the daily EMA 50 (596.64) and the short moving-average cluster on a close, the bounce would lose steam and shift the focus back to the support of the recent low at 519-520. As long as that reference and the weekly EMA 200 (512.47) hold, the drop would remain a correction within the major trend; its loss on a weekly close would cool the floor thesis and open a deeper adjustment.
Break the long moving-average wall or better to wait for the flow to turn? 👇
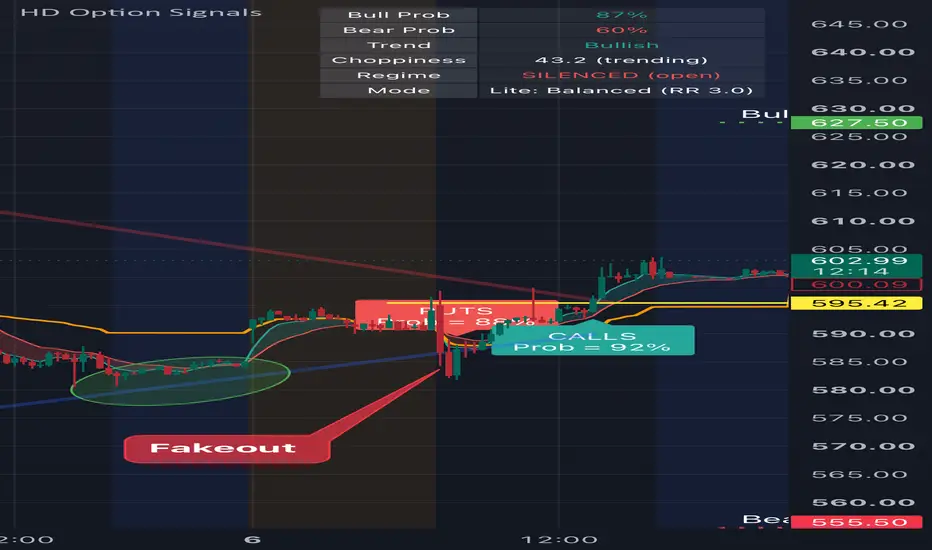
META “small timeframe big money” This is basically just an update from an earlier post “small timeframe big money”
We got our call signal late in the day to get in this position after a brief Put signal (semi false signal still playable on 3-5 minute candles) Now we need to see a hold above horizontal support around 596 area to see a continuation of the bullish breakout
Meta Breaks Out, Then Pulls BackWhat's changed?
After some initial hesitation, Meta stock surged out of the green Target Zone ($539.39–$585.54) last week. However, it quickly slipped back just below the lower edge of the zone, so the area remains active for now and could still be used for entries.
Primary Scenario
Currently, we see META in the third segment of an upward impulse, which should push the stock above resistance at $691.58 and $796.25. In the near term, we expect renewed gains out of our green Target Zone ($539.39–$585.54).
Long-Term Outlook
The daily chart confirms that the final upward move should complete the long-term uptrend at new all-time highs above resistance at $796.25. In our long-term alternative scenario, Meta would have already finished the uptrend and would subsequently sell off below support at $471.67 and $383.79. In that case, we would expect the next sustainable trend reversal above $88.09 (probability: 35%).