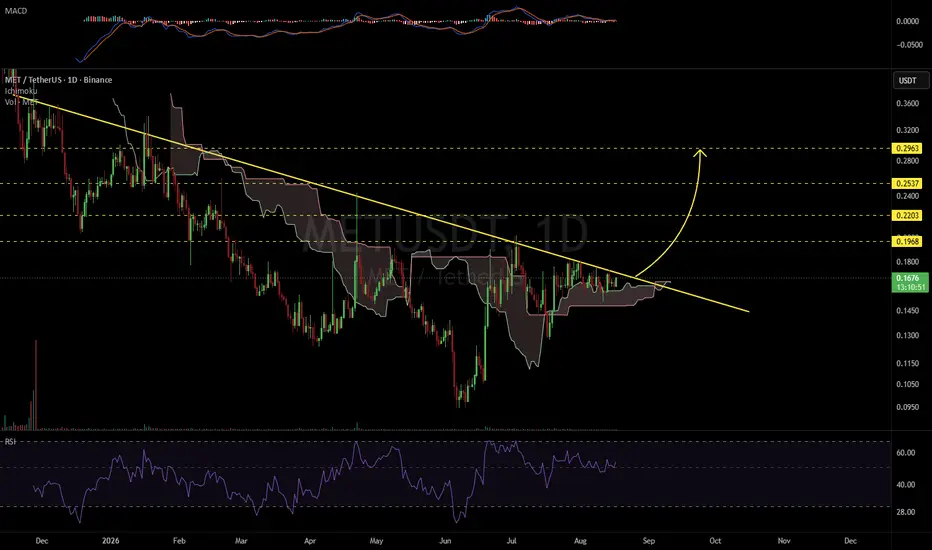
METUSDT 1D#MET is trading above the Ichimoku Cloud and is on the verge of breaking above the descending resistance on the daily timeframe. A confirmed breakout could trigger a bullish move toward the following upside targets:
🎯 $0.1968
🎯 $0.2203
🎯 $0.2537
🎯 $0.2963
⚠️ Always use a tight stop-loss and apply proper risk management.
METEORA/USD Tether Spot
No trades
No trades
In-depth trading ideas
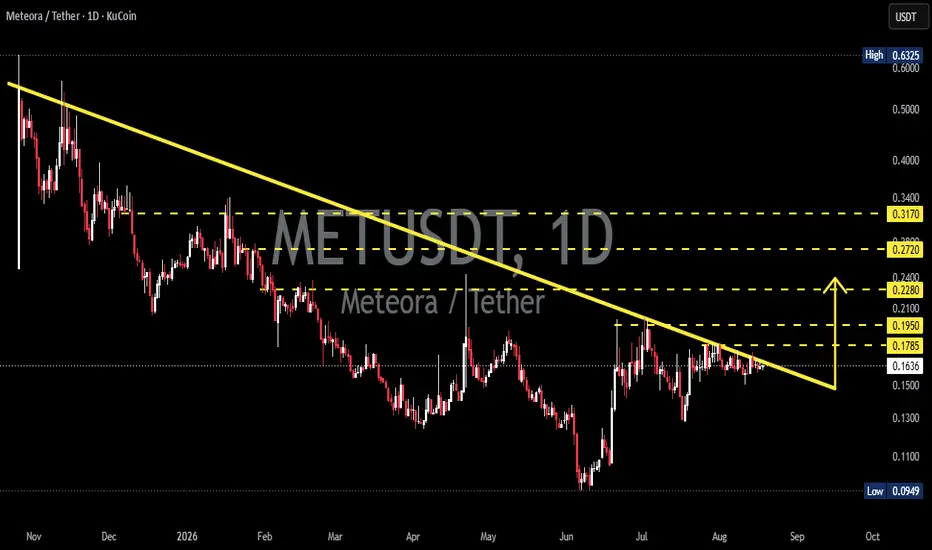
METEORA - Breakout Loading? Descending Trendline Under Pressure!📊 Market Overview Meteora (MET) on the 1D timeframe is still in a medium-term bearish structure, but the price is currently showing consolidation right below the Descending Trendline.
The price is around $0.1633, making the trendline the key resistance currently being tested.
🔎 Key observation: the longer the price remains near the trendline without making a significant decline, the more important the potential breakout becomes.
📐 Pattern — Descending Trendline
🔻 The Descending Trendline is formed by a series of Lower Highs (LH) since late 2025.
📉 This trendline acts as dynamic resistance and has repeatedly pushed the price lower.
⚠️ As long as the price remains below the trendline, the overall structure remains bearish.
🔥 However, if a Daily Candle Close occurs above the trendline, the structure could shift toward a bullish reversal / breakout setup.
📌 Breakout confirmation would be stronger if accompanied by:
📈 Increasing volume
🕯️ Daily close above the trendline
🔄 Successful retest of the trendline as support
🚀 Price beginning to form Higher Highs and Higher Lows
🎯 Key Resistance Levels
R1 — $0.1785 🔸 Nearest resistance and the first area that needs to be broken.
R2 — $0.1950 🔸 Next resistance and an important area for measuring bullish momentum.
R3 — $0.2280 🔸 Major resistance if the breakout gains strong momentum.
R4 — $0.2720 🔸 Next resistance and an important psychological area.
R5 — $0.3170 🔸 Major bullish target marked on the chart.
🟢 Bullish Scenario
🚀 The bullish scenario becomes active if MET breaks out and achieves a Daily Close above the Descending Trendline.
If the breakout is confirmed:
➡️ $0.1785 → first resistance ➡️ $0.1950 → next target ➡️ $0.2280 → major resistance ➡️ $0.2720 → extended target ➡️ $0.3170 → major bullish target
🔥 If the price successfully breaks above $0.2280 with strong volume, bullish momentum could become more aggressive toward $0.2720–$0.3170.
🔄 A retest of the trendline after the breakout is also an important area to determine whether the former resistance has turned into support.
🔴 Bearish Scenario
⚠️ If MET is rejected again by the Descending Trendline and fails to break out:
📉 The price could retest the $0.1500 area.
If that support fails:
➡️ $0.1300 ➡️ $0.1100 ➡️ $0.0950 as the major low area on the chart.
❌ A failed breakout or false breakout could signal that sellers are still controlling the structure.
🧠 Conclusion
MET is currently at a crucial area below the Descending Trendline.
🔻 Below the trendline: the structure remains bearish. 🔓 Breakout + Daily Close: opens the possibility of a structural shift. 🔄 Successful Retest: provides additional confirmation. 🚀 $0.1785 → $0.1950 → $0.2280 are important resistances during the bullish move. 🎯 If momentum becomes very strong, the next levels to watch are $0.2720 and $0.3170.
📌 Most important levels right now: Descending Trendline + $0.1785.
Not financial advice. Use proper risk management and wait for price action confirmation.
#MET #Meteora #Crypto #Altcoin #CryptoTrading #TechnicalAnalysis #PriceAction #DescendingTrendline #Breakout #BullishSetup #BearishScenario #USDT #Altcoins
Meteora MET price analysis#Meteora #MET is one of those projects that simply feels interesting.
Looking at the OKX:METUSDT chart, one detail stands out. Every attempt to break the long-term trendline is happening with a smaller swing, while each rejection is followed by a weaker pullback. Sellers seem to be losing momentum.
It almost looks like the market is compressing a spring.
And maybe... preparing for something much bigger. 👀
From a conservative perspective, the safest entry would be after a confirmed breakout and daily close above $0.18.
But let's look at the bigger picture. The crypto market is still relatively thin, sentiment remains cautious, and Meteora's market cap is only around $88M. It wouldn't take a massive amount of capital to push the price toward $0.33–0.34, effectively doubling today's valuation.
And if momentum really kicks in? A move toward $0.43–0.44 doesn't look impossible either.
🍿 Will it happen? Nobody knows.
But the chart is definitely becoming one of the more interesting ones to watch.
Whether to buy or not... that's a decision every investor has to make for themselves.
💬 What's your view on #MET ? Is this the beginning of a major breakout, or just another consolidation before the next pullback?
______________
◆ Follow us ❤️ for daily crypto insights & updates!
🚀 Don’t miss out on important market moves
🧠 DYOR | This is not financial advice, just thinking out loud
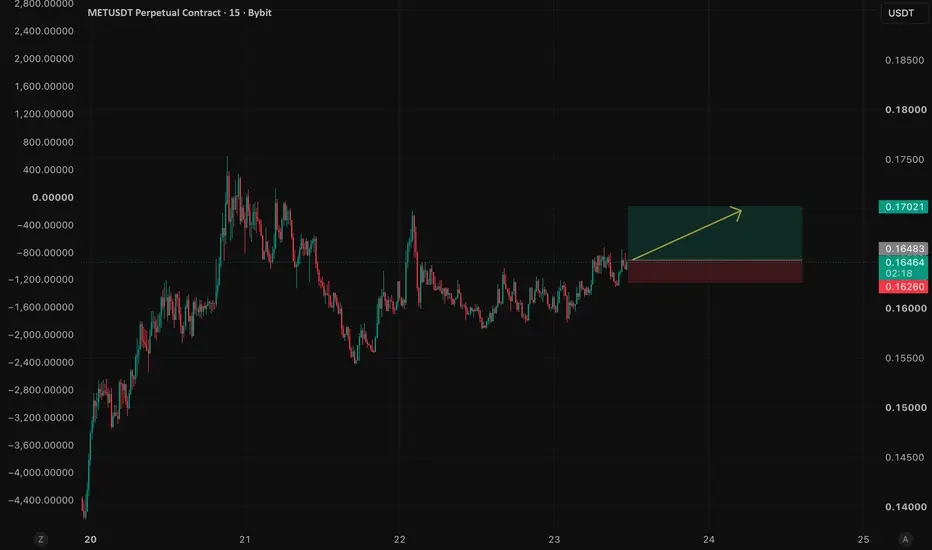
METUSDT: Bullish Breakout Opens the Door for Further UpsideMETUSDT is showing signs of strengthening momentum after reclaiming a key support zone and forming a series of higher lows. Buyers remain in control as price continues to hold above the recent breakout area, suggesting the uptrend may have further room to develop.
As long as 0.16260 holds as support, the bullish outlook remains intact. A sustained move from the current zone could extend the rally toward 0.17021, while a break below support would invalidate the setup and increase the risk of a deeper pullback.
Trade Setup
Entry: 0.16471
Target: 0.17021
Stop Loss: 0.16260
I'll be watching for buyers to defend the breakout zone and maintain higher lows before expecting the next leg higher. Holding support would reinforce the bullish continuation scenario, while a loss of support would invalidate the setup.
Is MET Building Momentum Again? A Look at the analysis.MET seems to be moving again. One thing I like about this chart is that it's finally showing signs of life after spending days trapped inside a heavy accumulation range.
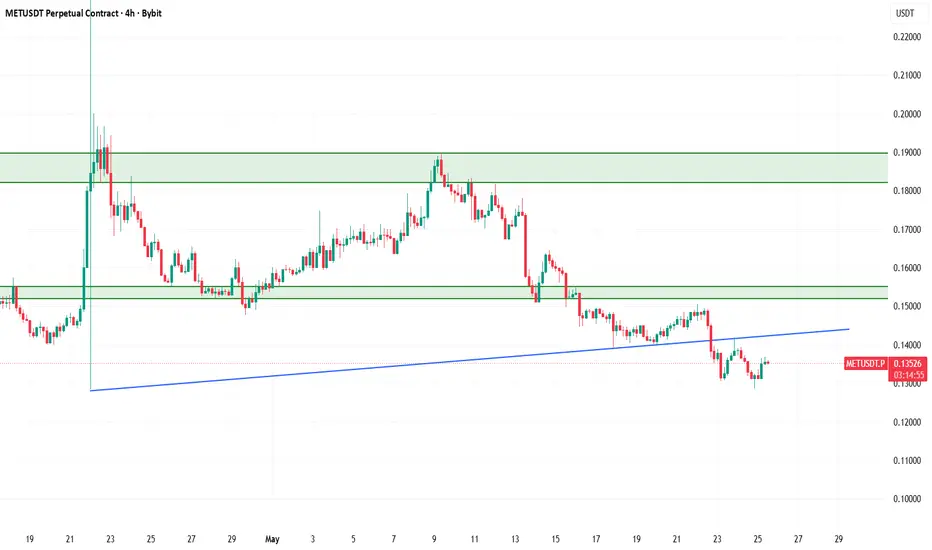
According to the 4H chart, MET has shown a notable recovery after printing a local bottom around $0.128-$0.130, followed by a strong impulsive move back above $0.16. The latest candles suggest buyers are stepping back in, although the price is now approaching a resistance area where previous rallies have struggled.
Chart Analysis:
After weeks of lower highs and steady selling pressure, MET finally found strong demand near the $0.13 zone. That support triggered a sharp reversal accompanied by rising volume, often a sign that larger participants are accumulating rather than simply short-covering.
The recent breakout toward $0.17 confirms renewed momentum, but price has pulled back slightly, which is healthy after such a fast move. As long as MET continues holding above $0.155-$0.145, bulls remain in control of the short-term trend.
Why More Eyes Are Turning Toward BITGET:METUSDT :
One of the biggest reasons traders have started watching Meteora more closely is the expansion of its ecosystem through the new Referral Staking Program.
This introduces another layer of utility for MET holders by allowing staking rewards to benefit from the growth of Meteora's liquidity network and DLMM-generated trading activity. Instead of relying purely on market sentiment, the token gains stronger connections to actual protocol usage.
The combination of improving token utility and renewed buying pressure helps explain why MET has started appearing on more traders' watchlists.
Market Outlook:
MET is becoming a project worth keeping on the watchlist; not only because of recent price action, but also because the narrative is increasingly being supported by expanding utility and growing activity within the Solana DeFi ecosystem.
The current chart doesn't suggest a full trend reversal just yet, but it does indicate that momentum has shifted significantly compared to the prolonged downtrend seen earlier. Buyers have defended key support, volume is improving, and higher lows are beginning to form.
For now, I'm watching the reaction around $0.145 very closely. Hold that level, and I think the market has a realistic shot at challenging $0.17-$0.18 again before attempting the bigger $0.19 resistance. However, if MET collapses, I will start DCAing it on Bitget for the long-term.
As always, this is just my personal chart view; not financial advice. So always DYOR.
METUSDT Forming Bullish MomentumMETUSDT is forming a clear bullish momentum pattern, a classic bullish wave signal that often indicates an upcoming breakout. The price has been consolidating within a narrowing range, suggesting that selling pressure is gradually weakening while buyers are beginning to regain control. With consistent trading volume confirming accumulation at lower levels, the current setup hints at a potential bullish breakout in the near future. The projected move could lead to an impressive gain of around 90% to 100% once the price breaks above the key resistance level.
This bullish momentum pattern is typically seen at the end of downtrends or corrective phases, representing a potential shift in market sentiment from bearish to bullish. Traders closely watching METUSDT are noticing strengthening momentum as the price approaches a critical breakout zone. Strong trading volume adds confidence to this setup, showing that market participants are positioning early in anticipation of a sustained upward move.
Growing investor interest in METUSDT reflects increasing confidence in the project's long-term fundamentals and its improving technical outlook. If the breakout is confirmed with sustained buying volume, it could mark the beginning of a fresh bullish leg. The ongoing consolidation phase suggests steady accumulation, creating favorable conditions for a strong continuation rally once the resistance level is cleared.
Traders may find this an attractive medium-term opportunity, especially as the bullish momentum pattern nears completion and buying pressure continues to build. A confirmed breakout could attract additional market participation and accelerate the move toward the projected upside target.
✅ Show your support by hitting the like button.
✅ Leaving a comment below! (What is You opinion about this Coin)
Your feedback and engagement keep me inspired to share more insightful market analysis with you!
METUSDT Forming Bullish MomentumMETUSDT is forming a clear bullish momentum pattern, a classic bullish wave signal that often indicates an upcoming breakout. The price has been consolidating within a narrowing range, suggesting that selling pressure is weakening while buyers are beginning to regain control. With consistent trading volume confirming accumulation at lower levels, the current setup hints at a potential bullish breakout in the near future. If the breakout is confirmed, the projected move could lead to an impressive gain of around 70% to 80%.
This bullish momentum pattern is commonly seen at the end of downtrends or corrective phases, signaling a potential shift in market sentiment from bearish to bullish. Traders closely watching METUSDT are noticing strengthening momentum as the price approaches a key breakout zone. Healthy trading volume further reinforces this setup, indicating that market participants are positioning early in anticipation of a sustained upward move.
Growing investor interest in METUSDT reflects increasing confidence in the project's long-term potential and its current technical structure. If buyers successfully push the price above resistance with sustained volume, it could mark the beginning of a fresh bullish leg. The ongoing consolidation phase suggests steady accumulation, creating favorable conditions for a strong continuation rally once the breakout is confirmed.
Traders may find this an attractive medium-term opportunity, especially as the bullish momentum pattern nears completion and buying pressure continues to build. A confirmed breakout could attract additional market participation and accelerate the move toward the projected upside target.
✅ Show your support by hitting the like button.
✅ Leaving a comment below! (What is You opinion about this Coin)
Your feedback and engagement keep me inspired to share more insightful market analysis with you!
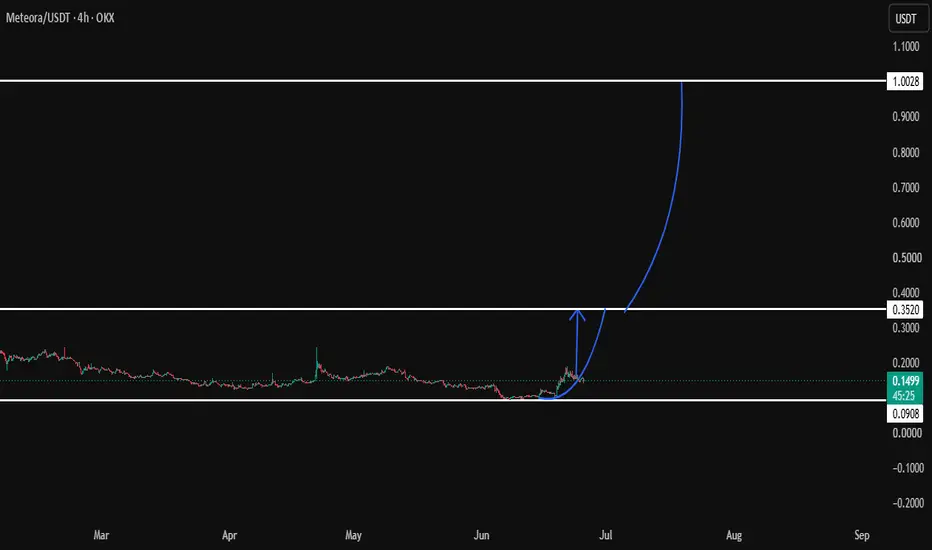
METAORA (METUSDT) CAN BECOME THE NEXT 1 USD+ GOLDEN TOKENDepending on cycle trend and accumulation zone following, MET:USDT showing an interesting view, which explains that there is high chance of a breakout followed by entering new cycle trend, which is even runing now, this can be the start of someting great, and even 1 usd breakout is a possiblity we check out with time.
METEORA (MET/USDT) — the Beginning of a Major Reversal?The MET/USDT chart on the 1D timeframe shows that price has been in a prolonged downtrend since reaching its peak around $0.63. Over the past several months, price has consistently formed Lower Highs (LH) and Lower Lows (LL), confirming strong seller dominance.
However, market conditions are beginning to change after price established a strong base within the $0.118 – $0.135 range, which is acting as both a major accumulation zone and key support area. A strong impulsive candle and increasing momentum have now pushed price above the previous bearish structure.
---
🔍 Pattern Formation
📈 1. Descending Trendline Breakout
The long-term descending trendline connecting major highs since November 2025 has finally been broken.
✅ Key breakout characteristics:
• The breakout occurred after an extended downtrend.
• Price reclaimed an important support zone.
• Bullish momentum has increased significantly.
• Market structure is beginning to shift from bearish to neutral-bullish.
A breakout of a long-term descending trendline is often one of the earliest signals of a potential trend reversal.
---
🏗️ 2. Accumulation Base Formation
The highlighted yellow zone represents a strong accumulation area.
📍 Key levels:
• Main Support: $0.118 – $0.135
• Fibonacci 0.5: $0.1347
• Fibonacci 0.618: $0.1281
• Fibonacci 0.786: $0.1187
The longer price holds above this area, the stronger the probability that it becomes the foundation for the next upward move.
---
🔄 3. Potential Trend Reversal
If this breakout remains valid, the market structure could transition into:
✅ Higher Low (HL)
✅ Higher High (HH)
These are the primary conditions required for the formation of a new bullish trend.
---
🎯 Key Levels
🚧 Immediate Resistance
🔹 $0.184
🔹 $0.207
🔹 $0.227
🛡️ Major Support
🔸 $0.135
🔸 $0.128
🔸 $0.118
❌ Bullish Invalidation
A daily close below $0.118.
---
🟢 Bullish Scenario
🚀 Primary Scenario
If price successfully holds above the $0.135 region and maintains the breakout structure, the probability of a continuation toward higher resistance levels increases significantly.
🎯 Bullish Targets:
🥇 Target 1 → $0.184
🥈 Target 2 → $0.207
🥉 Target 3 → $0.227
Additional confirmation will occur if price establishes a new Higher High (HH) following the breakout.
📈 The upside potential from the accumulation zone to the main targets exceeds 60–80%.
---
🔴 Bearish Scenario
The bearish scenario becomes active if the current breakout fails to hold.
⚠️ Signs of weakness:
• Price falls back below the trendline.
• A daily close below $0.135.
• Increasing selling pressure around resistance levels.
🎯 Downside Targets:
🔻 $0.128
🔻 $0.118
🔻 $0.100
If the $0.118 support level breaks, the probability of revisiting previous lows increases significantly.
---
📝 Conclusion
MET/USDT is currently at a very interesting technical point after successfully escaping a downtrend that has lasted for several months.
🔥 The breakout above the long-term descending trendline, combined with price holding above the accumulation zone, suggests that bearish momentum is beginning to weaken.
As long as the $0.118 – $0.135 support zone remains intact, the path toward $0.184 – $0.227 remains the dominant scenario.
However, traders should remain cautious of a potential fake breakout if price loses this critical support area.
📊 From a technical perspective, this chart presents early signs of a trend reversal that could potentially end the prolonged bearish phase and open the door for a new bullish trend in the coming weeks.
---
💡 Quick Summary
🟢 Short-Term Trend: Bullish
🟢 Market Structure: Early Reversal Phase
🟢 Accumulation Zone: $0.118 – $0.135
🟢 Main Targets: $0.184 → $0.207 → $0.227
🔴 Invalidation: Daily Close Below $0.118
⚡ "Anyone can spot a breakout. Holding above support is what confirms a true trend reversal."
#METUSDT #MET #Meteora #Crypto #Cryptocurrency #Altcoin #Altcoins #TradingView #TechnicalAnalysis #ChartAnalysis #CryptoTrading #BullishBreakout #TrendlineBreakout #DescendingTrendline #TrendReversal #Accumulation #PriceAction #SupportAndResistance #Fibonacci
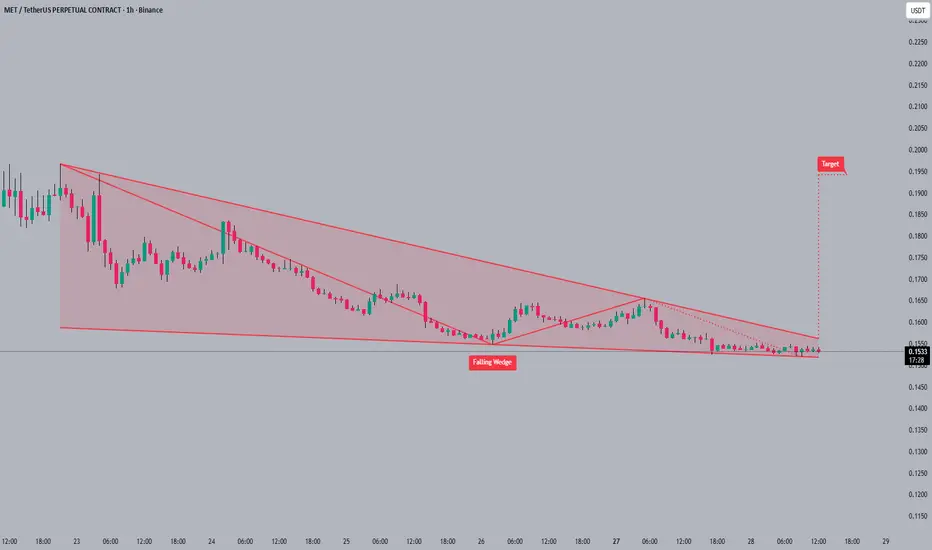
METUSDT Forming Falling WedgeMETUSDT is forming a clear falling wedge pattern, a classic bullish wave signal that often indicates an upcoming breakout. The price has been consolidating within a narrowing range, suggesting that selling pressure is weakening while buyers are beginning to regain control. With consistent volume confirming accumulation at lower levels, the setup hints at a potential bullish breakout soon. The projected move could lead to an impressive gain of around 90% to 100% once the price breaks above the wedge resistance.
This falling wedge pattern is typically seen at the end of downtrends or corrective phases, and it represents a potential shift in market sentiment from bearish to bullish. Traders closely watching METUSDT are noting the strengthening momentum as it nears a breakout zone. The strong trading volume adds confidence to this pattern, showing that market participants are positioning early in anticipation of a reversal.
Investors’ growing interest in METUSDT reflects rising confidence in the project's long-term fundamentals and current technical strength. If the breakout confirms with sustained volume, this could mark the start of a fresh bullish leg. The current market structure suggests that buyers are gradually gaining control while bearish pressure continues to weaken.
Traders might find this a valuable setup for medium-term gains, especially as the falling wedge pattern completes and buying momentum accelerates. A successful breakout could attract additional market attention and potentially drive the price toward significantly higher levels over the coming weeks.
✅ Show your support by hitting the like button!
✅ Leaving a comment below! (What is your opinion about this Coin?)
Your feedback and engagement keep me inspired to share more insightful market analysis with you!
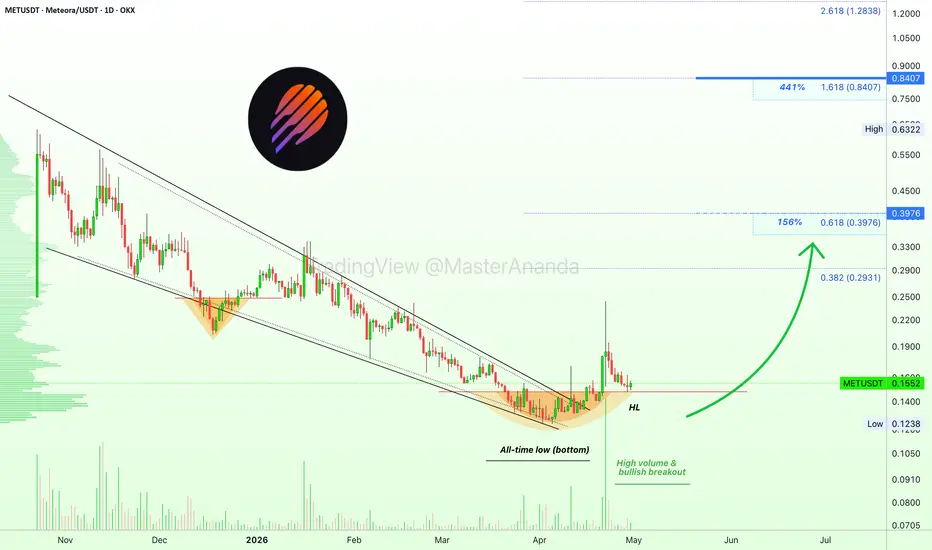
Meteora (MET): Learning technical analysis, the basicsThe initial breakout followed by a retrace—higher low. Let's look at it like this, there is always a second chance. I anticipate the breakout to get the best possible entry. If you can't get in before the breakout, know that there is always a retrace after the first move. This is the chart setup you see here.
You know additional growth is likely due to trading volume. These are the basics and I've been repeating it over and over, again and again. There is no need for complexities because this method works. Spotting the reversal has its disadvantages though, too often we tend to enter too early. Keep holding, when possible, buy more/again.
Meteora—METUSDT
The higher low (HL) is not a confirmed signal. When in doubt, look at the oscillators; MACD, RSI & STOCH. If these have bullish potential, it can support the chart signals. If these are weak, you can doubt the candle patterns and look for a different project. There are always many choices.
If doubt remains, add a few moving averages. If the action is already happening above EMA55 daily after a major low, then growth is already confirmed for at least several months. EMA89 and MA200 are very strong. These can be interpreted in different ways based on the context.
Finally, we can look at Bitcoin and the bigger projects, as well as the rest of the market. All of these can help to either validate or negate our final conclusion.
Before buying, if new, first wait. Read often, visit many projects and charts. Notice how they move. Let them move, let them go. After you get a feeling of the market and how it works, take action.
Namaste.
22-04-26 MET When the Rocket Runs Out of FuelThe "Ghost" Pump: When the Rocket Runs Out of Fuel 🚀💨
That massive green candle looked like a moon mission, right? But look closer—the silence in the volume is deafening. While everyone else is FOMO-ing in, the smart money is already packing their bags. Here is why that "pump" might actually be a trap.
Price moving up while volume is crashing is the ultimate red flag. It’s called Demand Exhaustion. In our recent chart, we saw price hit a new high, but the "fuel" (volume) wasn't there to back it up. This tells us the big players aren't buying the breakout; they’re likely using it to sell their positions to retail traders who are late to the party.
Looking at the SMC (Smart Money Concepts) lens, the evidence is stacking up:
Liquidity Sweep: That long wick at the top? That was a hunt for stop-losses. The market grabbed the liquidity it needed before shifting gears.
CHoCH (Change of Character): We’ve officially seen a break in the local structure. The buyers failed to hold the floor, and the "Order Flow" has flipped from bullish to bearish.
The FVG Magnet: We left a massive Fair Value Gap below. Markets hate imbalance, and right now, that gap is acting like a giant magnet pulling price back down for a rebalance.
Rule number one: Don't chase the move. Instead of jumping in now, wait for a retracement back to the newly formed Supply Zone or the last Order Block. Let the market confirm the distribution phase. Target the FVG areas for your take-profit, and always wait for that LTF (Lower Time Frame) confirmation before pulling the trigger.
Stay sharp, trade the structure, not the hype. 📉💎
METUSDT – Weakening Downtrend Pressure, Potential Reversal?On the 1D timeframe, MET/USDT is still in a clear downtrend, characterized by consistent lower highs and lower lows since its previous peak.
However, current price action shows:
Price is starting to form a base / consolidation at the lows.
A clear descending trendline resistance (yellow line) that has been tested multiple times.
Price is approaching a key breakout area around 0.1545.
---
📐 Pattern Analysis
🔻 Descending Triangle / Descending Structure
Lower highs forming a descending resistance line.
Relatively strong horizontal support around 0.13 – 0.14.
Typically a bearish continuation pattern, but if broken to the upside → can lead to a strong reversal.
Additionally, there is also a potential:
🔄 Base Accumulation
Sideways movement below resistance.
Indicates possible accumulation before a larger move.
---
🚀 Bullish Scenario
Bullish confirmation occurs if:
Price breaks out above the descending trendline
Successfully closes above:
0.1545 (key initial resistance)
🎯 Upside targets:
0.1710
0.1860
0.1975
0.2300 (major resistance)
📌 Additional confirmation:
Increasing volume during breakout
Successful retest of 0.1545 as new support
👉 This could signal an early trend reversal / relief rally after a prolonged downtrend.
---
🐻 Bearish Scenario
Bearish continuation remains valid if:
Price fails to break the trendline
Or faces strong rejection at resistance
📉 Downside targets:
0.1350
0.1238 (previous low)
If breakdown occurs → potential for new lower lows
⚠️ A breakdown from the base confirms continuation of the downtrend.
---
⚖️ Conclusion
The structure remains bearish, but momentum is weakening.
Current area is a key decision zone.
Breakout = strong bullish opportunity
Rejection = continuation of bearish trend
#METUSDT #CryptoAnalysis #TechnicalAnalysis #Altcoin #BreakoutSetup #DescendingTriangle #CryptoTrading #BullishScenario #BearishScenario #PriceAction #SupportResistance #Trendline #CryptoMarket
MET - METEORA Fundamental GAPDLMM is Meteora's core tech for dynamic liquidity provision.
Forming HH (Higher Highs) and has shown good reaction and volume from support.
3rd highest fee generator in DeFi last year.
$10.6M token buyback at 2.3% supply.
Powers prediction markets and cross chain liquidity on Solana.
Fundamentals:
Meteora generated $1.25b in fees last year, 3d largest Fee generator in crypto.
More than any DeFi protocol on any chain and Trades at 0.11x revenue.
Raydium does half the fees at 3x the valuation.
Uniswap similar fees at 30x the valuation.
Meteora - Marketcap $132.2M, FDV - $265.7M
Competitors
PumpFun - Marketcap $1.06B, FDV - $1.85B
Raydium - Marketcap $266.5M, FDV - $550.4M
Jupiter - Marketcap $678.5M, FDV - $1.46B
Uniswap - Marketcap $2.9B, FDV - $4.23B
MET 1D SHORT SETUPPersonal Long/Short Score: 32-34.5
Panel context:
- Phase: bearish EMA stack
- Series: 1H overstretched below EMA (pullback → continuation risk)
- Fakes: clean trend / fewer traps
- PA: Fractal High formed (LH confirmed) + LL/LH downtrend
- Levels: Res 0.2842 / 0.2999 | Sup 0.2357 / 0.2317 / 0.2183 / 0.2031
- FVG: Support 0.247–0.2495 + 0.2368–0.2377; Bear FVG overhead 0.3574–0.4271 (far)
- Liquidity: “hunt up” possible → wait for confirmation
- Unlocks: next unlock 23 Jan (extra supply risk)
Plan:
Entry: 0.2478 (confirmed rejection / failed EMA reclaim)
Stop: 0.2842
Take 1 (Point B): 0.232 → +1% to equity (sell 50%)
After Take 1: move SL to BE → rest in Price Discovery
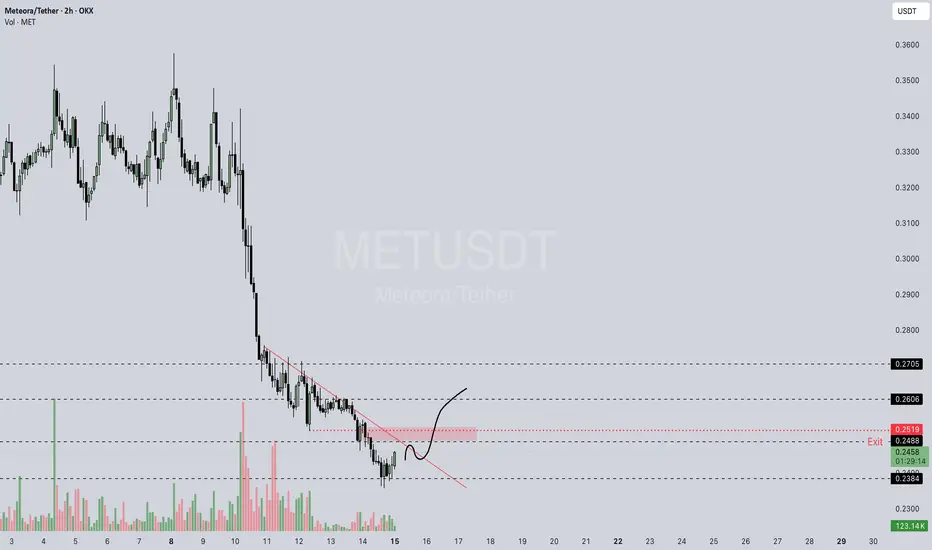
Met/UsdtOKX:METUSDT
### 🌠 MET/USDT (2h) - OKX
**🟢 Price**: 0.2461 (+1.61%)
**📈 High/Low**: 0.2467 / 0.2410
**💰 Order Book**: Sell @ 0.2459 | Buy @ 0.2467
**📊 Volume (MET)**: 1.10K (Very Low)
**🎯 Key Levels**:
* Support: ~0.2153
* Resistance: ~0.2703
**📉🔍 Summary**: Small bullish candle on very low volume. Price is between support and resistance. **Low activity suggests caution.** Watch for a move above 0.2703 (bullish) or below 0.2153 (bearish).
---
⚠️ **Disclaimer**: This is not financial advice. Always do your own research (DYOR). Trading is risky. 📉📈
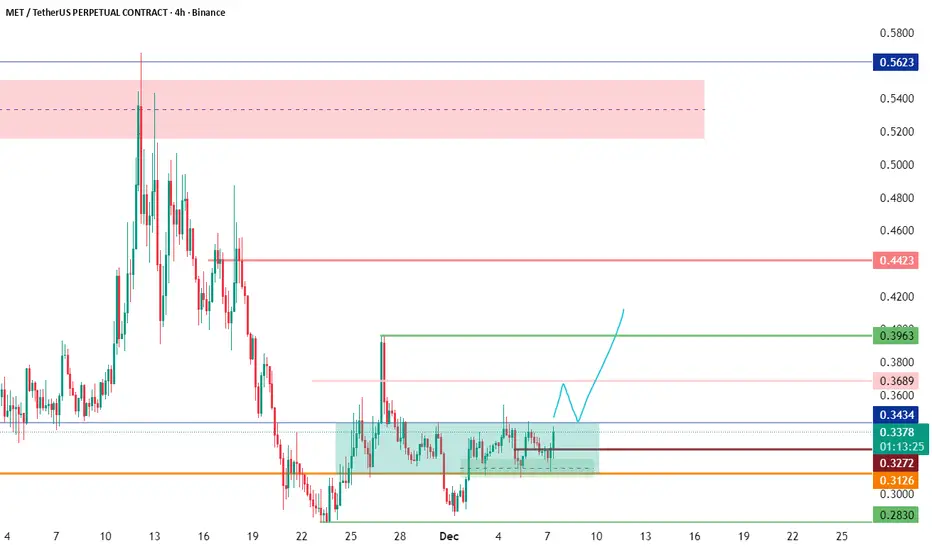
meteora $MEt ranging since November 25th, NYSE:MET Update:
Metora ranging since November 25th, still unable to reclaim 0.343, which remains the key resistance.
Above that, the next important level is 0.368, which lines up with the mean threshold of the bearish Order Block. A move into that zone would make sense once 0.343 is reclaimed.
Beyond that, the real liquidity sits higher — around 0.398, which likely becomes the magnet once those lower levels get cleared.
So the ideal flow looks like:
Reclaim 0.343 → Push into 0.368 (MT of bearish OB) → Then target liquidity above 0.398.
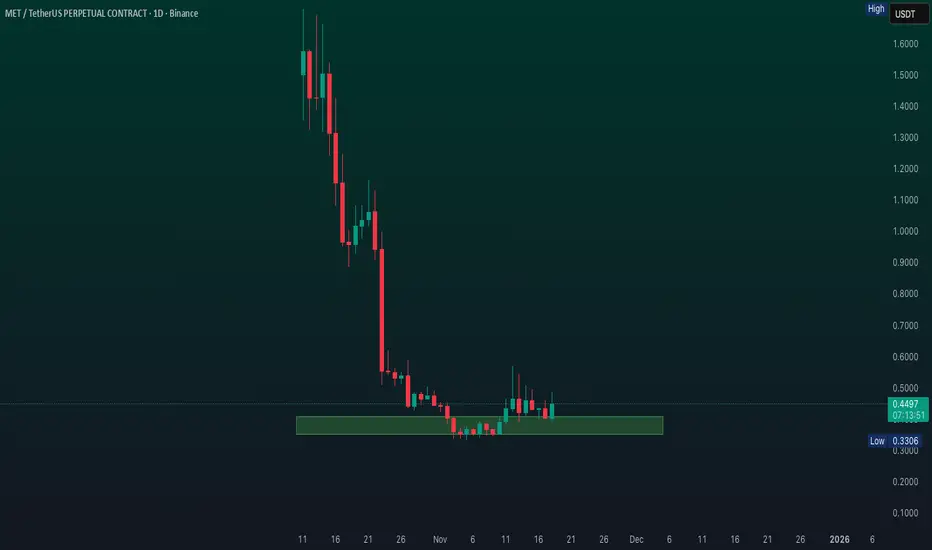
Meteora zones of interestAfter listing we need to find the lowest price Daily candle! BITGET:METUSDT
2 zones of interest its a first zones for DCA if you want to accumulate spot
Always better wait the second zone and after 100% bounce withdraw initial deposit!
Positive case for December if we hold the line in first zone of interest road will be open to POC - point of control. And new ath where more than okay fix swing trade position
Negative case if we will continue move down with downtrend structure to the second zone of interest with the same idea of fixation
Invalidation of idea if the price will drop under listing price!
✅Disclaimer: Please be aware of the risks involved in trading. This idea was made for educational purposes only not for financial Investment Purposes.
Scalp Short – MET📉 Scalp Short – MET
A strong bearish divergence has formed on the 15-minute timeframe. Selling volume is increasing and taking control. As overbought conditions often lead to sharp corrections, a pullback is highly probable.
🎯 Trade Setup:
Take Profit (TP): 0.4422
Stop Loss (SL): 0.5672
Risk/Reward Ratio (RR): 1 : 2.36
A clean short setup based on strong bearish divergence and growing sell-side momentum.