METIS USDT 2.82R Long SetupBINANCE:METISUSDT.P LONG SETUP AFTER HTF DEMAND TAP
I was waiting for METIS to Tap the HTF Demand in Discount zone of prev leg, now It has finally tapped tha demand and is showing solid setups for an intraday swing with 2.8R potential Risk-to-Reward
I can also spot a local Wyckoff accumulation formation that is + Confluence for this trade
Metis / Tether
No trades
No trades
In-depth trading ideas
METIS Breaks the Descending Trendline, Bulls Are Taking Control?📊 Technical Analysis — CRYPTOCAP:METIS
⏱️ Time Frame: 2D
💵 Current Price: around $3.519
📈 Pattern: Descending Trendline Breakout + Support/Demand Zone
🟨 Key Zone: $2.65 – $3.13
---
🔍 Chart Structure
📉 METIS had previously been in a long-term downtrend, characterized by a Descending Trendline connecting a series of lower highs since the peak around $69.
🔥 On this chart, price appears to have successfully broken above the Descending Trendline, indicating that the long-term bearish pressure m
METISUSDT Forming Bullish MomentumMETISUSDT is forming a clear bullish momentum pattern, a classic bullish reversal signal that often indicates an upcoming breakout. The price has been consolidating within a narrowing range, suggesting that selling pressure is weakening while buyers are beginning to regain control. With consistent volume confirming accumulation at lower levels, the setup hints at a potential bullish breakout soon. The projected move could lead to an impressive gain of around 30% to 40% once the price breaks abov
METIS at macro floor: base recovery toward $2.943The Macro Picture 🗺️
METIS unwound from the $4.1 highs all the way down and has flattened into a base just above the $2.309 floor, now at $2.452. The steep selling has given way to a sideways grind — exhaustion rather than continuation.
The Setup ⚙️
The Accumulation Zone 🟢
$2.309–2.452 is where the selling has dried up. Macro Support has held on retest, and this is the demand shelf a recovery would build from.
The Decision Point 🔴
$3.048 (Local High) is the structural gate. Before it, the $2.
METISUSDT UPDATECRYPTOCAP:METIS Technical Setup Pattern: Falling Wedge Breakout Current Price: $3.144 Target Price: $5.500, $6.200 Target % Gain: 102.35% METIS is breaking out of a falling wedge on the 1D timeframe with price reclaiming the resistance trendline and showing early bullish momentum, indicating a strong potential reversal if follow-through buying continues
Time Frame: 1D
METISUSDT Forming Falling WedgeMETISUSDT is forming a clear falling wedge pattern, a classic bullish reversal signal that often indicates an upcoming breakout. The price has been consolidating within a narrowing range, suggesting that selling pressure is weakening while buyers are beginning to regain control. With consistent volume confirming accumulation at lower levels, the setup hints at a potential bullish breakout soon. The projected move could lead to an impressive gain of around 90% to 100% once the price breaks above
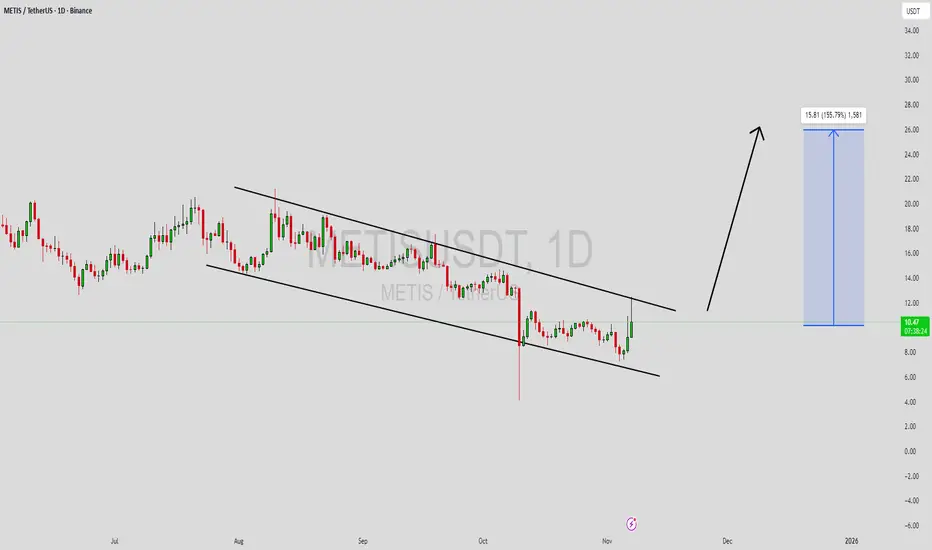
METISUSDT Forming Falling WedgeMETISUSDT is forming a clear falling wedge pattern, a classic bullish reversal signal that often indicates an upcoming breakout. The price has been consolidating within a narrowing range around $9.20 USDT, suggesting that selling pressure is weakening while buyers are beginning to regain control amid recent 24% daily surges and AI integration hype. With consistent volume confirming accumulation at lower levels around the $8.50 support, the setup hints at a potential bullish breakout soon. The pr
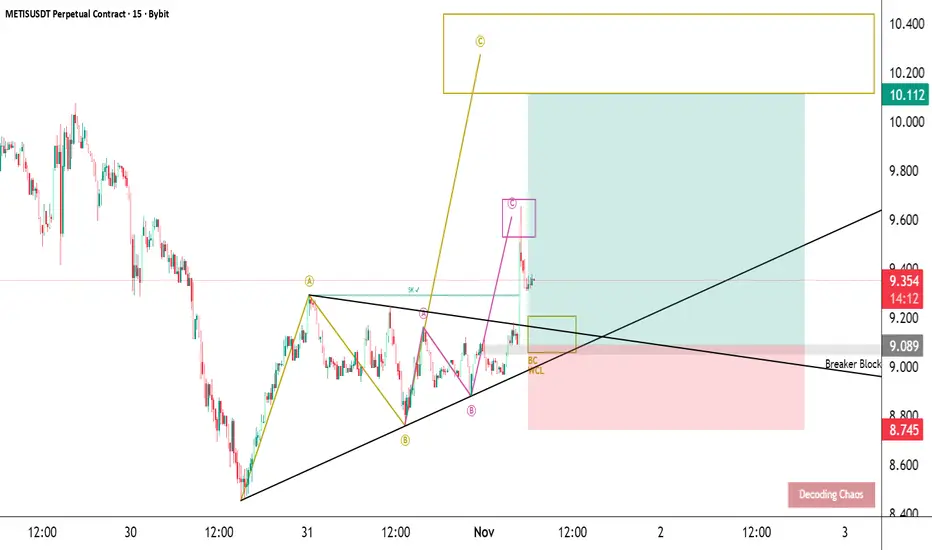
METISUSDT | Fractal BC–WCL ConfluencePrice is correcting into the 9.0–9.1 zone, where the yellow BC , pink WCL , and a clean breaker block all line up — strong confluence.
I’m expecting liquidity to sweep under the early reaction at the order block before reversing from the breaker.
Watching for confirmation inside that zone.
Stop : 8.745 (just below yellow B at 8.761 — structural invalidation)
Target : 10.10–10.40 (yellow C projection)
If price dips deeper first, it’s fine — that sweep would only strengthen the setup.
Be
METIS/USDT — Major Accumulation or Breakdown Ahead?Currently, METIS/USDT is trading inside a very crucial demand zone at $10.20 – $16.16 (highlighted in yellow). This area has acted as strong support multiple times since 2022–2025, preventing deeper sell-offs. In other words, this is the last line of defense for buyers and a potential accumulation zone before a major move.
---
🔎 Technical Structure & Pattern
Macro trend: Since the 2024 peak, METIS has been forming a series of lower highs, signaling that the medium-term downtrend is still inta
METISUSDT Forming Falling WedgeMETISUSDT is forming a well-defined falling wedge pattern, a classic bullish reversal setup indicating the downtrend may be nearing exhaustion. Price action has narrowed between descending support and resistance lines, signaling that selling pressure is fading and key levels are being defended by accumulation. When combined with solid trade volume, this setup points toward high probability upside.
Volume remains consistently strong, reflecting growing investor interest as the structure evolves.
Is $METISUSDT ready to move ??Following a breakout and retest of a resistance zone and now turning it to a support zone. BINANCE:METISUSDT seems to be ready for some bullish moves. So be on the look out as the expected targets are marked out already.
Kindly support this analysis to enable it reach to other people, and do comment your thoughts.
$METIS Breakout Complete – Retest in Progress!!SEED_DONKEYDAN_MARKET_CAP:METIS just completed a massive breakout and is now cooling off!
The downtrend is now over. The price broke through resistance and is currently re-testing important levels.
Two clear scenarios from here:
A bounce at the $21 level will initiate the next wave up.
A dip at $18–19 will provide a golden entry before a strong rally next.
Focusing on $25+ soon with increasing momentum.
The staging is tidy and the repositioning is only just starting.
DYOR, NFA
Metisusdt buying opportunityMETISUSDT is consolidating within a long-term symmetrical triangle, with price currently testing a key demand zone around $23.00, a historically reactive level aligning with trendline support. Multiple liquidity taps at this area indicate strong accumulation interest, reinforced by RSI bouncing off historical oversold conditions.
This presents a high-probability buying opportunity, as a sustained hold above this level could initiate a reversal. A breakout above the triangle’s upper boundary, c
METIS LONGS /INVERSION📊 15-Minute Chart Analysis (METISUSDT.P) 🔍
Key Zones:
Liquidity Cluster (Left Side): Potential accumulation zone before price reversal.
Fair Value Gap (FVG): Marked in blue, indicating an area of imbalance that may act as a demand zone.
Fibonacci Levels:
0.618 (15.55)
0.786 (15.67) (Potential resistance or liquidity grab area)
Market Structure:
Recent Downtrend: Price formed a lower high before continuing downward.
Potential Reversal: If price taps into the FVG (~15.10) and holds, a mov
METISUSDT UPDATEMETISUSDT is a cryptocurrency trading at $17.57. Its target price is $32.00, indicating a potential 80%+ gain. The pattern is a Bullish Falling Wedge, a reversal pattern signaling a trend change. This pattern suggests the downward trend may be ending. A breakout from the wedge could lead to a strong upward move. The Bullish Falling Wedge is a positive signal, indicating a potential price surge. Investors are optimistic about METISUSDT's future performance. The current price may be a buying oppor
METIS Rebuy Setup (2D)The METIS token, after experiencing significant drops, is approaching a strong support level.
We are looking for buy/long positions within the green zone.
A daily candle closing below the invalidation level will invalidate this analysis.
Do not enter the position without capital management and stop setting
Comment if you have any questions
thank you