ME at macro floor: base recovery toward $0.07511The Macro Picture 🗺️
ME unwound from the $0.12670 macro ceiling all the way down and has flattened into a base just above the $0.05534 floor, now at $0.06027. The steep selling has given way to a sideways grind — exhaustion rather than continuation.
The Setup ⚙️
The Accumulation Zone 🟢
$0.05534–0.
Compare with MEU/SDT
HOW A SIMPLE TOKEN CAN SHOW A GOLDEN RBEAKOUT.. ME:USDT📊 ME/USDT – Update
ME is currently holding a key support area while starting to show signs of early momentum recovery. The current structure suggests a potential expansion move could develop if buyers continue defending the accumulation zone. This token has show the All time low, and can make a new
ME BOTTOMED OUT ON WEEKLY CHART🔥 Fortune AI Radar — BMV:ME
Fresh activity detected on BMV:ME today.
Data suggests increasing market interest & buyers stepping in.
Technicals currently lean bullish, with momentum trending upward.
Whales showing hints of accumulation and hype rising among traders.
This coin is flashing strong
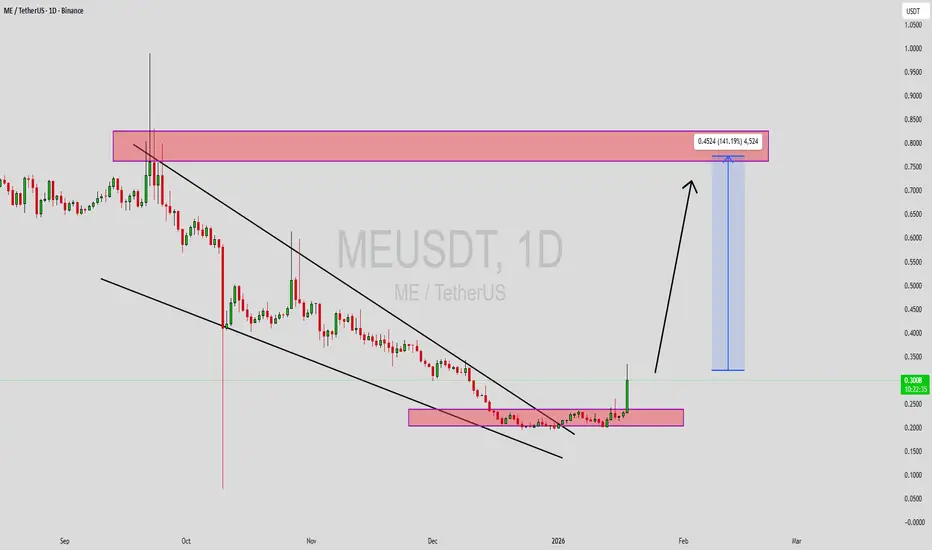
MEUSDT Forming Falling WedgeMEUSDT is forming a clear falling wedge pattern, a classic bullish reversal signal that often indicates an upcoming breakout. The price has been consolidating within a narrowing range, suggesting that selling pressure is weakening while buyers are beginning to regain control. With consistent volume
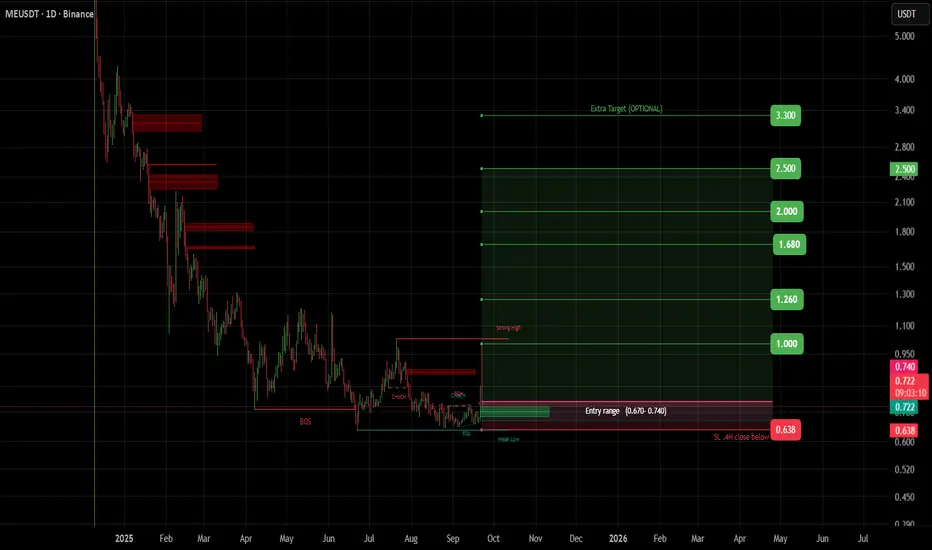
ME (SPOT)BINANCE:MEUSDT
Entry range (0.670- 0.740)
SL 4H close below 0.638
T1 1.000
T2 1.260
T3 1.680
T4 2.000
T5 2.500
Extra Target is optional 3.300
_______________________________________________________
Golden Advices.
********************
* collect the coin slowly in the entry range.
* Please c
MEUSDT at Fib 0.5_0.392 support MEUSDT has reached the Fibonacci 0.5 and 0.382 levels. From here, the bullish trend may resume toward the 0.81–0.85 range. Recently, it broke out of the bullish wedge, and the price moved as predicted. As part of the correction, the price has now bounced from this area.
ME/USDT (2D) — Last Stand at the Support Zone!ME/USDT is now at a make-or-break moment. After a prolonged downtrend since the start of the year, price action has formed a Descending Triangle — a combination of a falling trendline pressing down from above and a strong horizontal support between 0.65 – 0.85 USDT.
📌 Why this zone matters:
This y
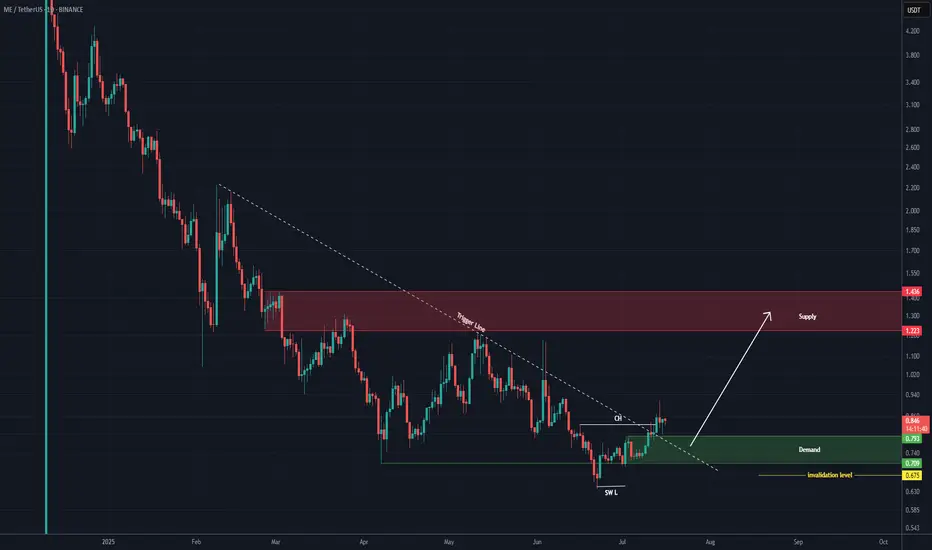
ME Analysis (1D)After holding above the support zone, we have a bullish Change of Character (CH) on the chart, which is a bullish sign. Additionally, the trigger line has been broken.
After a slight pullback, the price may move toward the targets.
The targets are marked on the chart.
A daily candle closing below
See all ideas
Summarizing what the indicators are suggesting.
Oscillators
Neutral
SellBuy
Strong sellStrong buy
Strong sellSellNeutralBuyStrong buy
Oscillators
Neutral
SellBuy
Strong sellStrong buy
Strong sellSellNeutralBuyStrong buy
Summary
Neutral
SellBuy
Strong sellStrong buy
Strong sellSellNeutralBuyStrong buy
Summary
Neutral
SellBuy
Strong sellStrong buy
Strong sellSellNeutralBuyStrong buy
Summary
Neutral
SellBuy
Strong sellStrong buy
Strong sellSellNeutralBuyStrong buy
Moving Averages
Neutral
SellBuy
Strong sellStrong buy
Strong sellSellNeutralBuyStrong buy
Moving Averages
Neutral
SellBuy
Strong sellStrong buy
Strong sellSellNeutralBuyStrong buy
Displays a symbol's price movements over previous years to identify recurring trends.
Frequently asked questions
The current price of MEUSDT SPOT (ME) is 0.06296 USDT — it has risen 4.57% in the past 24 hours. Try placing this info into the context by checking out what coins are also gaining and losing at the moment and seeing ME price chart.
MEUSDT SPOT price has risen by 7.07% over the last week, its month performance shows a 1.71% increase, and as for the last year, MEUSDT SPOT has decreased by −91.82%. See more dynamics on ME price chart.
Keep track of coins' changes with our Crypto Coins Heatmap.
MEUSDT SPOT (ME) reached its highest price on Dec 10, 2024 — it amounted to 14.59790 USDT. Find more insights on the ME price chart.
See the list of crypto gainers and choose what best fits your strategy.
MEUSDT SPOT (ME) reached the lowest price of 0.05544 USDT on Jun 30, 2026. View more MEUSDT SPOT dynamics on the price chart.
See the list of crypto losers to find unexpected opportunities.
The safest choice when buying ME is to go to a well-known crypto exchange. Some of the popular names are Binance, Coinbase, Kraken. But you'll have to find a reliable broker and create an account first. You can trade ME right from TradingView charts — just choose a broker and connect to your account.
Crypto markets are famous for their volatility, so one should study all the available stats before adding crypto assets to their portfolio. Very often it's technical analysis that comes in handy. We prepared technical ratings for MEUSDT SPOT (ME): today its technical analysis shows the buy signal, and according to the 1 week rating ME shows the sell signal. And you'd better dig deeper and study 1 month rating too — it's neutral. Find inspiration in MEUSDT SPOT trading ideas and keep track of what's moving crypto markets with our crypto news feed.
MEUSDT SPOT (ME) is just as reliable as any other crypto asset — this corner of the world market is highly volatile. Today, for instance, MEUSDT SPOT is estimated as 1.41% volatile. The only thing it means is that you must prepare and examine all available information before making a decision.
You can discuss MEUSDT SPOT (ME) with other users in our public chats, Minds or in the comments to Ideas.