MEW enters accumulation phase before a breakout (3D)From the point marked with the red arrow on the chart, the MEW meme coin has entered a corrective phase, which appears to be an ABC correction that is now nearing completion.
After the completion of such ABC structures, the price can often reverse strongly in the opposite direction.
The range where the price is currently fluctuating seems to be forming an accumulation phase.
In the green zone, you can join us on spot using DCA (Dollar-Cost Averaging) towards the defined targets.
At the first target, take some partial profits, and then move your position to breakeven.
If you have a coin or altcoin you want analyzed, first hit the like button and then comment its name so I can review it for you.
Do you also think MEW is bullish?
In-depth trading ideas
MEW Reacting at Macro Channel FloorMEW is trading on the Daily timeframe inside a large descending channel that has controlled price action for months. The overall structure is clearly bearish, with consistent lower highs and lower lows. Recently, price accelerated downward inside a sharper internal descending channel, showing strong selling pressure.
Now price is approaching the lower boundary of both the smaller blue channel and the broader macro channel. This area is acting as a potential exhaustion zone. The recent reaction suggests selling momentum is slowing as price taps into lower channel support.
The key level to watch is around 0.0005510. Holding above this level increases the probability of a corrective bounce toward 0.0007224 and 0.0007820. If momentum builds, price could attempt a larger move toward 0.0011680, which aligns with upper channel resistance and previous structure.
However, if 0.0005510 fails with strong continuation selling, the structure remains fully bearish and price could extend toward 0.0005510 and even retest the macro channel low.
Right now this is a reaction zone. A strong reclaim of the internal descending channel would be the first signal that a meaningful relief rally is beginning.
MEW Main Trend. Memcoin. 2025 07 02Logarithm. Time frame 3 days.
Cat in a dogs world (MEW)
X -133 thousand subscribers (this is not enough).
Reduction from the maximum -87%. For such assets, this is not enough.
I imposed a descending channel on the chart (current descending trend of the main trend), and a horizontal one, if by some miracle this local Ross hook is broken upwards (not forming a local head and shoulders), not only to the resistance of the secondary trend (red line), but to break through it. Percentages to key zones of support/resistance levels are shown for clarity.
After the downward trend is broken, such "psychological-fundamental" assets are usually pumped up by +800-1000% from the minimums or more. Low liquidity, and the contingent of people who subscribe to these projects, allows this to be done easily at the right time: "the hamster is not scared". After pumping — a slow death, with pumps an order of magnitude smaller. Therefore, do not forget to sell in the alt season.
When working with such cryptocurrencies by liquidity, observe money management, use partial entry or on a breakout. Do not use margin leverage, as there may be snot in any direction for a large percentage, which will lead to liquidation "out of the blue".
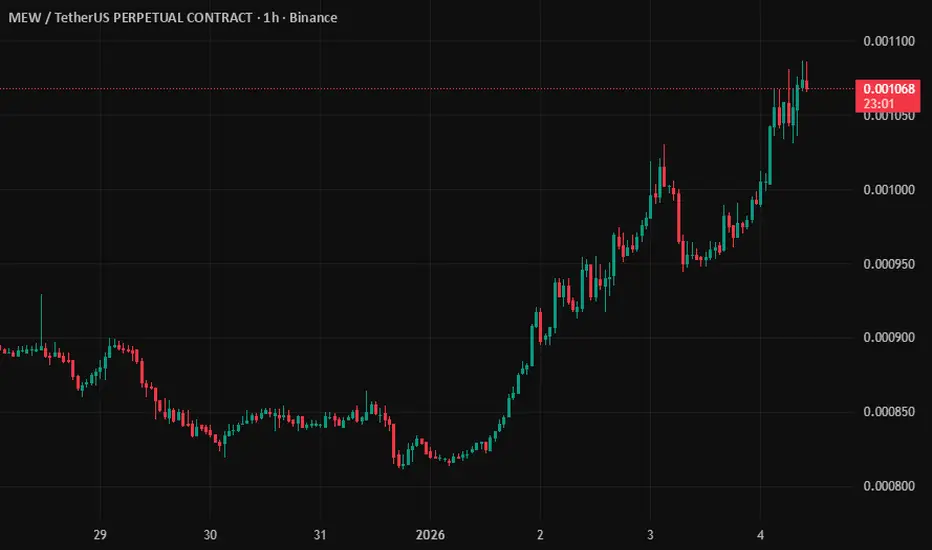
MEWUSDT LONG SIGNAL📢 Trade Setup – MEW/USDT
📈 Position: LONG
💰 Entry Zone:
0.00101 – 0.00106
(Price is reacting inside the marked demand zone after trendline breakout)
🛑 Stop-Loss:
0.00094
(Below the demand zone and structure invalidation)
🎯 Take-Profit Targets:
• TP1: 0.00115
• TP2: 0.00126
• TP3: 0.00137
• TP4: 0.00152
📊 Timeframe: 1H
⚖️ Risk / Reward: Favorable
⚙️ Leverage: Spot or low leverage (max 3×)
🧠 Technical Analysis:
Price has broken the descending trendline and is holding above the key demand area.
Market structure is shifting from bearish to bullish, and the current consolidation suggests continuation toward higher resistance and liquidity levels.
📌 Trade Management:
✔️ Take partial profits at each TP
✔️ Move SL to Break-Even after TP1
✔️ Trail SL below higher lows
✔️ Risk max 1–2% per trade
MEW Buy/Long Signals (4H)After the bullish CH on the chart, the price has moved strongly to the upside with powerful momentum. The current market structure and price momentum clearly support long buy positions.
We have two entry zones, and positions should be entered using a DCA (Dollar-Cost Averaging) approach to manage risk effectively.
All target levels have been marked directly on the chart for clarity and better trade planning.
If you want it more technical, simpler, or more promotional, I can adjust the style.
If you would like us to analyze a coin or altcoin for you, first like this post, then comment the name of your altcoin below.
MEW / USDT : Bullish setup , Watching retest for next leg upMEW / USDT Breakout confirmed from the descending trendline. Price is retesting the demand zone, and as long as this support holds, we can expect bullish continuation towards higher levels. Breakdown below the zone will invalidate the setup.
MEWUSDT 1D#MEW is moving within a symmetrical triangle on the daily chart and is currently sitting on the daily SMA200. In case of a bounce, we can expect it to move toward the triangle resistance and potentially break above it. If that happens, the targets are:
🎯 $0.003647
🎯 $0.004104
🎯 $0.004797
Mid-term targets:
🎯 $0.005779
🎯 $0.006761
🎯 $0.008160
🎯 $0.009942
If the triangle breaks to the downside, it could retest the support levels at $0.002391 and $0.001685.
⚠️ Always remember to use a tight stop-loss and follow proper risk management.
MEWU/USDT — Symmetrical Triangle: A Major Breakout is Coming?📝 Summary
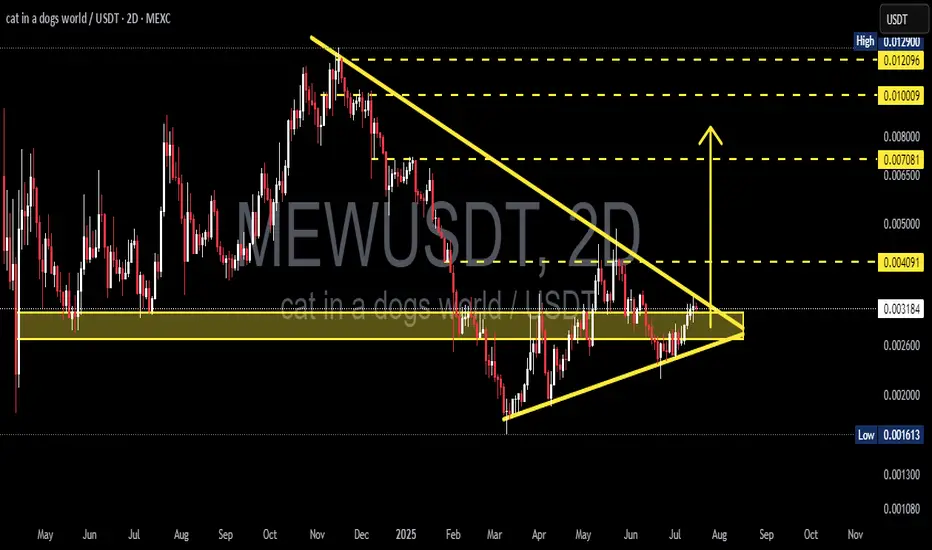
The MEWU/USDT pair is currently consolidating after a strong downtrend since early 2025. Price has been compressing into a symmetrical triangle pattern, trapped between a horizontal support zone at 0.0027–0.0033 and a descending resistance trendline.
The structure is now very close to its apex → meaning a major breakout (up or down) is imminent. The next move will likely set the medium- to long-term direction of this token.
---
🔎 Pattern & Market Structure
Main pattern: Symmetrical Triangle — formed by higher lows and lower highs.
Market context: Appears after a steep downtrend. Symmetrical triangles are technically neutral, but the initial bias leans slightly bearish until proven otherwise.
Accumulation zone: 0.0027–0.0033 has acted as a key battleground between buyers and sellers.
Key levels:
Supports: 0.0027 → 0.0021 → 0.00175 → 0.001613 (major low)
Resistances: 0.003402 → 0.004091 → 0.005712 → 0.007081 → 0.010009 → 0.012096
---
🚀 Bullish Scenario (If Breakout Upward)
1. Confirmation: A 2D close above 0.0034–0.0035 with strong volume.
2. Healthy retest: Price retests 0.0034–0.0030 as new support. If it holds → bullish confirmation.
3. Targets:
🎯 TP1: 0.00409 (+35%)
🎯 TP2: 0.00571 (+89%)
🎯 TP3: 0.00708
🎯 Extended target: 0.0100 – 0.0120 (if momentum/FOMO enters).
4. Risk management: Stop loss below 0.0027; aim for R:R ≥ 1:2.
> An upside breakout would signal a major trend reversal after months of consolidation. The move could be explosive.
---
🐻 Bearish Scenario (If Breakdown Downward)
1. Confirmation: A 2D close below 0.0027 with heavy selling volume.
2. Failed retest: Price retests 0.0027–0.0029 from below and gets rejected → bearish continuation.
3. Targets:
🎯 TP1: 0.0025
🎯 TP2: 0.0021
🎯 TP3: 0.00175
🎯 TP4: 0.00161 (major historical support).
4. Risk management: Stop loss above 0.0034 if shorting.
> A downside break would confirm trend continuation, exposing MEWU to another 30–50% decline.
---
📌 Key Notes
The longer the triangle compresses, the stronger the breakout tends to be.
Volume is the key indicator → no volume = high risk of false breakout.
On the 2D timeframe, any breakout can drive a trend lasting weeks to months.
Expect high volatility due to relatively low liquidity in smaller tokens.
---
📢 Conclusion
MEWU/USDT is at a critical crossroads. The symmetrical triangle formed since March is nearing its apex, and a directional breakout is imminent.
Breakout upward → potential rally of +100% toward 0.0057–0.0070.
Breakdown downward → risk of a 30–50% drop toward 0.0016.
📌 Best approach: wait for confirmation (close + volume + retest) before entering. Patience here can prevent being trapped in a false move.
---
#MEWU #MEWUUSDT #CryptoAnalysis #Breakout #TrianglePattern #Altcoin #TechnicalAnalysis #BullishScenario #BearishScenario
MEW/USDT Retesting Key Zone, Ready for the Next Move?📊 Technical Analysis:
MEW/USDT on the 2D timeframe shows a compelling structure with a Symmetrical Triangle pattern breakout that occurred in late July 2025. This breakout indicates a potential trend reversal from bearish to bullish.
Currently, the price is performing a retest of the breakout level while sitting within a strong support zone between 0.00280 – 0.00310 USDT (highlighted in yellow). This area previously acted as accumulation and now serves as a key support.
---
📈 Bullish Scenario:
Price holds and bounces from the 0.00280 – 0.00310 zone, forming a new higher low.
Potential upside targets include:
0.004091 (minor resistance)
0.007081
0.010009
And extended targets at 0.012096 – 0.012900 if bullish momentum continues.
Bullish confirmation strengthens if price reclaims above 0.004091 with strong volume.
---
📉 Bearish Scenario:
If the price fails to hold the 0.00280 support and breaks below the ascending trendline (rising yellow line), then:
It may revisit the next support zone at 0.002300
Possibly retest the historical low at 0.001613
Bearish case invalidated if price pushes back above 0.0040 with a strong bullish candle.
---
📐 Pattern & Structure:
Symmetrical Triangle Breakout: Signals a consolidation phase that resolved to the upside.
Breakout Retest: Price is now retesting the breakout level — a crucial phase to validate trend continuation.
Support-Resistance Flip: The yellow zone is key in determining whether bulls maintain control.
---
🧠 Summary:
MEW/USDT is currently in a critical retest phase after a bullish breakout from a symmetrical triangle pattern. If support holds, this could be a solid swing opportunity toward higher resistance levels. However, a breakdown below the key support would invalidate the bullish setup and open room for further downside.
#MEWUSDT #CryptoAnalysis #BreakoutRetest #SymmetricalTriangle #AltcoinSetup #BullishScenario #BearishScenario #TechnicalAnalysis #SwingTrade
mew usdt looking good1. on the daily we are consolidating in a cup and handle we are right at the 200ma if we break above it we should get a move
2 on the weekly time frame its making higher lows with bullish divergence
3 most of the time frames have had time to cool down over sold, i would enter close to the point of control.
4 the first target would be around 85 %
5 btc dom. is falling which is very bullish for our alt coins god bless
MEW : A meme coin that hasn't grown yetHello friends🙌
Given the decline we had, you can see that buyers entered the specified support area and entered the price into the ascending channel. That is why we can buy with risk and capital management and stay with it until the specified targets.
🔥Follow us for more signals🔥
*Trade safely with us*
MEWUSDT Breakout! Rounded Bottom Reversal and Key Retest Zone!MEWUSDT has officially broken out of a long-term descending trendline that has capped price action since December 2024. The formation of a Rounded Bottom (Cup) suggests a strong accumulation phase and potential for trend reversal. The current retest of the breakout zone will be crucial in determining the next big move!
---
🔍 Technical Analysis Details:
1. Chart Pattern: A clear Rounded Bottom (Cup) pattern has formed, often signaling a bullish reversal. Price has broken through the descending trendline, and is now retesting the breakout zone (highlighted in yellow), which previously acted as resistance and is now turning into key support.
2. Resistance Levels (Upside Targets):
⚡ 0.004105 – First breakout point
🟡 0.006491 – Mid-level resistance
🟡 0.007725 – Previous local high
🟡 0.009970 – Strong resistance zone
🔵 0.012214 – Psychological resistance
🔵 0.012936 – Major swing high
3. Key Support Levels:
🟡 0.003200 – Current demand zone (yellow box)
🔵 0.001614 – Historical bottom
---
✅ Bullish Scenario:
If MEWUSDT holds above the 0.0032–0.0041 support zone and confirms it as a new base:
🎯 Target 1: 0.00649
🎯 Target 2: 0.0077
🎯 Higher targets: 0.0099 up to 0.0129 This breakout may be the start of a strong bullish rally, especially if accompanied by increasing volume.
---
⚠️ Bearish Scenario:
If price fails to hold the breakout zone and falls back below the trendline:
Price may revisit 0.0026 – 0.0020 support
Further weakness could push it back to the 0.001614 historical low
---
🧠 Conclusion:
MEWUSDT is showing early signs of a bullish reversal after breaking out of a long-term descending trendline and forming a rounded bottom pattern. The current retest zone is critical — holding this level could confirm the start of a bullish trend with multiple upside targets.
#MEWUSDT #CryptoBreakout #TechnicalAnalysis #Altcoins #MemeCoin #CryptoTrading #BullishSetup #RoundedBottom #TrendReversal #SupportAndResistance
Buy Trade Strategy for MEW: Tapping Into the Meme Economy SurgeDescription:
This trading idea focuses on MEW, a rising star in the meme coin category that’s capturing community attention through strong online engagement and viral appeal. Unlike traditional cryptocurrencies, MEW leverages the power of internet culture and social media dynamics to drive visibility and adoption. With a growing holder base and active community, MEW stands as a speculative yet potentially rewarding asset for those looking to benefit from the explosive trends in the meme economy. Its branding, humor-driven outreach, and increasing listings on exchanges contribute to its early growth momentum.
Still, it’s important to remember that meme tokens are among the most volatile and unpredictable assets in the crypto market. Price swings can be rapid and sentiment-driven, making it essential to approach this asset class with a clear risk strategy and realistic expectations.
Disclaimer:
This trading idea is for educational purposes only and does not represent financial advice. Trading cryptocurrencies such as MEW involves substantial risk, including the possible loss of your entire investment. Always perform your own due diligence, evaluate your financial capacity, and consult a licensed financial advisor before investing. Past performance is not indicative of future outcomes.
MEW/USDT Ready to Explode? Major Breakout from Symmetrical!After weeks of tight consolidation, MEW/USDT is showing signs of a major breakout from a well-formed Symmetrical Triangle pattern on the 2D time frame. This could mark the beginning of a powerful expansion phase if confirmed by volume and price action.
🔍 Pattern Analysis & Technical Structure
Main pattern: Symmetrical Triangle – a classic formation characterized by lower highs and higher lows, indicating a battle between buyers and sellers before a major move.
MEW has now broken through the triangle’s descending resistance line, signaling that buyers may be taking control.
The breakout occurred near the apex of the triangle, which often leads to explosive moves.
🟢 Bullish Scenario: Multi-Stage Upside Potential
If the breakout holds and gains confirmation (via volume or a successful retest), the next potential price targets are:
1. Initial Target: 0.0049 – nearest horizontal resistance and previous reaction level.
2. Mid Target: 0.0070 – measured move based on the height of the triangle from base to breakout.
3. Major Target Zone: 0.0090 – 0.0130 – previous distribution zone and high-confluence resistance.
📈 Upside potential exceeds +300% from current price if all bullish targets are hit!
🧠 Note: Symmetrical triangle breakouts are known to result in strong momentum-driven rallies, especially if supported by a rise in volume and broader market sentiment.
🔴 Bearish Scenario: Watch for Fakeout Risk
Despite the breakout, there’s always a risk of a false move:
If MEW fails to hold above the 0.0032 breakout zone and falls back inside the triangle, it may signal a bull trap.
A breakdown below the ascending support line could open the door for deeper downside:
Support Level 1: 0.0025 – recent accumulation base.
Support Level 2: 0.0016 – major low and strong demand zone.
Losing these levels would invalidate the current bullish setup.
⚙️ Key Confirmation Signals:
Volume: A breakout with strong volume = high conviction. Low volume = higher fakeout risk.
Successful Retest: A bounce from the breakout zone confirms strength and may provide a solid long entry.
Macro Sentiment: Watch Bitcoin dominance and market mood to confirm sustainability.
📊 Quick Technical Summary:
Pattern: Symmetrical Triangle
Breakout Level: 0.0032
Short-Term Trend: Bullish
Mid-Term Outlook: Neutral → Turning Bullish (if confirmed)
Key Resistance Levels: 0.0049 – 0.0070 – 0.0090 – 0.0129
Key Support Levels: 0.0025 – 0.0016
💬 Final Thoughts:
MEW/USDT is at a make-or-break moment. A validated breakout from this triangle could kick off a massive uptrend. But as always, stay alert to false breakouts — proper risk management is essential.
📌 Don’t just chase the breakout — watch the retest, volume, and broader context.
#MEWUSDT #MEWBreakout #SymmetricalTriangle #CryptoBreakout #AltcoinSetup #TechnicalAnalysis #TradingView #CryptoChart #BullishPattern #BreakoutAlert
MEW Looks Bliish (4H)An important trendline has been broken, and the price has pulled back to it. Within the internal structure of the pullback, a bullish iCH has also formed.
During minor pullbacks, it’s possible to look for buy/long positions on the MEW pair.
A daily candle closing below the invalidation level would invalidate this analysis.
For risk management, please don't forget stop loss and capital management
When we reach the first target, save some profit and then change the stop to entry
Comment if you have any questions
Thank You
MEW Sell/Short Setup (4H)We have a supply zone from which a strong drop has previously formed. This zone has been tested once already, but with only minimal penetration. Given this shallow penetration and the price’s inability to make a lower low, we are once again expecting a potential short position from this zone.
We’re looking for a short position because the larger market structure is bearish.
If the price reaches the supply area, we’ll be looking to enter a position. We expect the liquidity pool below the chart to be swept, leading price to hit our targets.
However, if a daily candle closes above the invalidation level, this outlook will no longer be valid.
Do not enter the position without capital management and stop setting
Comment if you have any questions
thank you
#MEWUSDT - Recovered after the sell-off, is the drop coming? Hey folks! 🚀
Today, we’re diving into the analysis of a highly volatile coin. Our special guest for the day: #MEWUSDT.P! 🔥
Looking at the #MEWUSDT chart, we saw a sharp pullback from $0.00300 after facing strong selling pressure, dropping all the way down to $0.0026. Right now, it's making a correction before what looks like another potential drop. 📉⚡
I'm eyeing an entry around $0.0028, but knowing how the market loves to hunt stops, I've also placed sell orders at $0.0030 and $0.0031—just in case. Gotta stay one step ahead, right? 🎯🔥 (Let’s not even get into the stop hunting madness! 😅)
Kept the chart clean and simple, with clear targets marked. Let’s hope this trade turns out nice and green! 💰🚀
P.S: Friends, just a quick reminder; please don’t focus too much on the stop loss value in my analysis. It’s just there to show that I entered a short position. 😊 Those who know, know, but let’s remind those who are seeing it for the first time!
Drop your thoughts in the comments, let’s discuss! 🔍⚡
Manage your risk, stay in the game! 🎯🔥
#AlyAnaliz #TradeSmart #CryptoVision #Binanciega #MEWUSDT
cat in a dogs world #MEW price analysis🍿 Despite all the "trash" that has been happening on the crypto market lately and will continue at least today, someone decided to try their luck or has a clearly calculated plan!?)
1️⃣ Trading volumes of OKX:MEWUSDT are growing smoothly but steadily and now the price is at a critical point, so buying is dangerous.
2️⃣ But it is most likely worthwhile to “take a pencil” and monitor the future behavior of the $MEW price.
3️⃣ If the #MEW price manages to stay above $0.0030-0.0031 in the next few days, you can try buying with a growth prospect of x2 to 0.0056-0.0058.
_____________________
Did you like our analysis? Leave a comment, like, and follow to get more
MEW Looks Bullish (4H)From the point where we marked start on the chart, MEW appears to be forming a bullish QM.
As long as the green zone holds, it can move toward the targets.
A 4-hour candle closing below the invalidation level will invalidate this pattern.
For risk management, please don't forget stop loss and capital management
When we reach the first target, save some profit and then change the stop to entry
Comment if you have any questions
Thank You
MEWUSDT Approaching a Breakout!MEWUSDT Technical analysis update
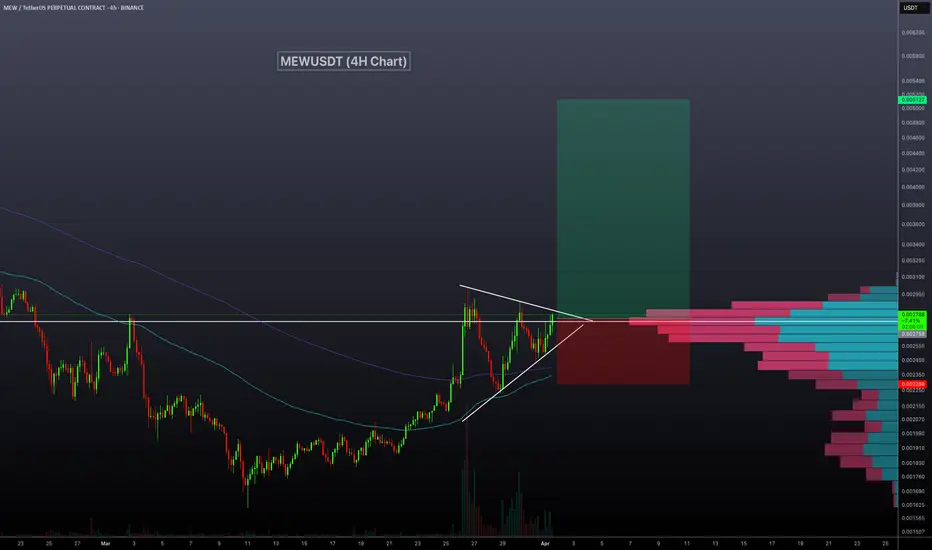
-MEWUSDT is trading within a pennant pattern on the daily chart.
-The price is currently above the 100 and 200 EMA.
-A bullish crossover between the 100 and 200 EMA could occur soon.
-There has been a notable increase in trading volume in recent days.
-The price is approaching a key resistance level on the volume profile and may break out soon.