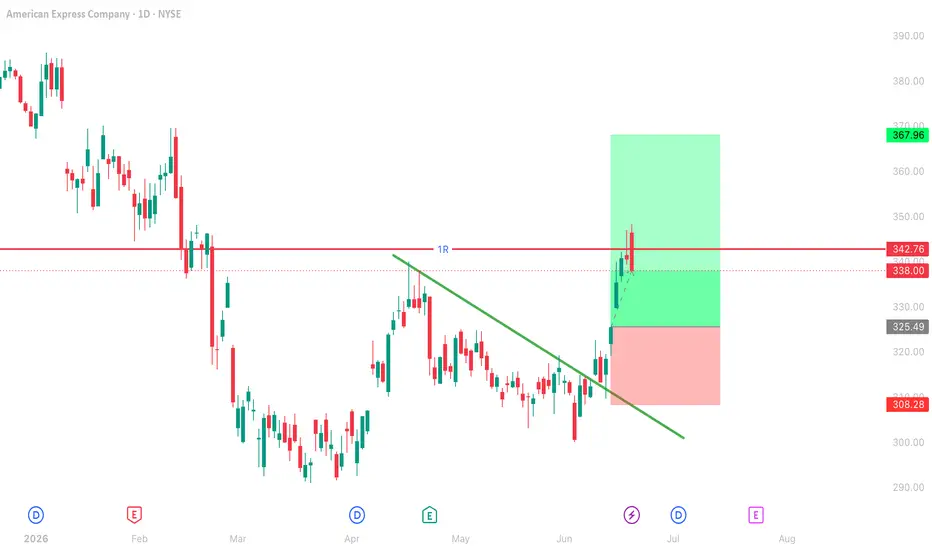
AMERICAN EXPRESS (AXP) — Sellers Take Control | $305 DownsideAmerican Express is currently showing noticeable weakness, with price action favoring sellers and the stock struggling to regain its previous strength.
The recent decline suggests that bearish pressure remains active, and unless buyers manage to reclaim key resistance levels, the downside structure can continue to develop.
From a fundamental perspective, American Express remains a high-quality financial company with a strong premium customer base, diversified revenue streams, card-spending exposure and a well-established global brand.
However, even fundamentally strong companies can experience significant corrections when market expectations, valuation, consumer sentiment and broader economic conditions come under pressure.
The current environment remains important for financial and consumer-focused companies. Interest-rate expectations, inflation, consumer spending, credit conditions and overall economic growth can all influence investor sentiment toward AXP. If the market continues pricing in weaker growth or increased pressure on consumer finances, the stock can remain vulnerable to further downside.
Technically, the current price structure is also supporting the bearish thesis. Sellers have been able to maintain control as the stock moves lower, indicating that buying interest has not yet been strong enough to produce a meaningful recovery. This creates the possibility of another leg lower if the current bearish structure remains intact.
The key level on the downside is $305, which is the primary target for this bearish setup. A sustained move toward this area would represent a significant decline from the current levels and could provide the next major zone where buyers may attempt to step back into the market.
However, the setup should be approached with discipline. A falling market should not automatically be chased at every level. The stronger approach is to monitor price behavior around resistance and look for confirmation that sellers are maintaining control. If price unexpectedly reclaims major resistance and establishes strength above it, the bearish scenario would need to be reassessed.
🎯 Trade Outlook
Bias: Bearish 📉
Direction: SELL
Target: $305
Market Structure: Weak / Seller-Dominated
Key Focus: Further downside while bearish momentum remains intact
Overall, AXP remains under pressure, and the current structure favors a move toward the $305 downside target. The fundamentals may continue supporting the company over the long term, but short-to-medium-term price action currently gives sellers the advantage.
Let the market confirm the move — $305 remains the key downside objective. 📉🎯
American Express Company
No trades
No trades
In-depth trading ideas
AXP Short — AXP is stalling right under resistance and losing VWAXP is rejecting near resistance with price below VWAP, offering a strong reversal-short profile and attractive reward relative to risk. Fresh post-earnings analyst cuts and weakness following Q2 results support the downside read, while older bullish long-term commentary is less relevant to this swing setup.
📍 Entry: 334.01
🛑 Stop: 336.59
🎯 Target: 325.32
⚖️ R:R: 3.37
AXP — Earnings today after a 2%+ drop; watching the reaction...AXP — Earnings today after a 2%+ drop; watching the reaction at recent support
**AXP — American Express Company — July 24, 2026**
American Express reports Q2 results before the open with the call at 8:30 a.m. ET. The stock closed yesterday at $340.84 after selling off 2.3%, putting it near the lower end of its multi-week range just as the fundamental catalyst hits.
**Technical Structure:**
Price is holding above the $338–340 zone that marked the July 23 low. RSI (14) has moved into the low-30s area on the daily, consistent with short-term oversold conditions after the recent decline. Volume on the sell-off was elevated relative to the 20-day average, confirming the move rather than a low-conviction drift.
**Key Levels:**
Support: $338–340 — yesterday’s low and recent swing support
Resistance: $350–355 — prior consolidation area and premarket reference
Invalidation: $330 — breaks the recent base and opens further downside
**The Fundamental Context:**
Q1 delivered 11% revenue growth and an 18% EPS increase with solid billed business. Consensus for Q2 is ~$4.40 EPS. The stock trades at roughly 22x trailing earnings — a discount to pure networks but with meaningful credit exposure. Credit costs and spending commentary will decide the reaction more than the headline EPS number.
**Catalyst to Watch:**
Today’s results and call. Bull case is a clean beat plus stable or improving credit metrics and constructive guidance. Bear case is any material rise in provisions or soft spending language.
**The Risk:**
Even an in-line print can produce a negative reaction if the bar for credit quality or guidance is not cleared; the multiple leaves limited cushion.
#AXP #Financials #Earnings #Credit #Consumer
$AXP – Credit Demand Could Stay Strong if Liquidity Remains TighAs the economy continues to move forward and inflation remains persistent, the Federal Reserve may have less room to cut interest rates than many investors expect.
If borrowing conditions stay tight, businesses may continue relying on established credit providers like American Express to help finance day-to-day operations, manage cash flow, and bridge short-term liquidity needs. Even with relatively high interest rates, access to credit can remain essential for companies that need working capital.
From a market perspective, this could support continued demand for commercial credit products, although higher interest rates can also increase borrowing costs and credit risk.
$AXP - 50 SMA Breakout and Bowl Pattern💡 Swing setup idea
Bowl pattern completion
🔎 Analysis summary:
This is a great setup for the watchlist. The stock broke above the 50 SMA and is currently closing a bowl pattern.
👀 Levels to watch:
Entry trigger: Break above $352.09
Target: $413.36
Stop: Under the breakout level
💬 What do you think of this setup? Let me know in the comments! 👇
Good luck!
⚠️ Note: This is for educational purposes only and is not financial advice.
AXP Reclaims Uptrend After Successful Retest of Breakout LevelAXP is attracting buying interest after successfully retesting the $337.04 breakout level, which previously acted as resistance and has now turned into support. The stock has resumed its uptrend, making higher high and higher low while trading above its well-aligned 20-day and 50-day moving averages.
American Express Company is a $240.15 billion market-cap company engaged in card issuing, merchant acquiring, and payment network services. Its offerings include consumer and business credit cards, corporate payment programs, gift cards, savings products, certificates of deposit, and the American Express mobile app.
The company operates through five segments: United States Consumer Services (USCS), Commercial Services (CS), International Card Services (ICS), Global Merchant and Network Services (GMNS), and Corporate and Other. It also maintains a broad international footprint across the United States, EMEA, APAC, Latin America, Canada, and the Caribbean.
AXP is a wide-moat company that has delivered consistent revenue growth over the last three quarters. The company maintains solid profitability, with operating and net margins of 21% and 14%, respectively. It also generates strong returns, with ROE of 34% and ROA of 13%. Its debt-to-equity ratio stands at 1.8x, which remains manageable given the nature of its financial services business and its strong earnings power.
Week 23 of 52 — AXP: A Quality Stock Needs a Quality EntryThis is not a turnaround story like some other names in the market. NYSE:AXP is a quality financial company with a strong brand, a premium customer base, and a long history of consistent execution.
But that is exactly why the chart is interesting.
The main lesson here is simple:
A great company is not always a great investment at any price. A quality stock still needs a quality entry.
NYSE:AXP had a strong multi-year run before correcting sharply from its highs. The stock found support around the $290–295 area and has been trying to build a recovery base. Now price is trading around the $306–316 zone, which could become an important area for long-term investors to watch.
From an investment perspective, I see the chart in layers:
Base / Starter Position Area: $306–316
Major Support / Better Accumulation Zone: $290–295
First Resistance: $330–335
Intermediate Resistance: $352–358
Long-Term Resistance: $380–386
Investors do not need to buy a full position at once. A stock like AXP can be approached in stages. A starter position near the current base may make sense for investors who want exposure, but the better risk/reward would likely come either from a stronger pullback toward $290–295 or from a confirmed recovery above the $330–335 resistance zone.
The $330–335 area is the first important test. If AXP can recover that zone and hold it, the market may start pricing the stock as a recovery continuation toward the next resistance levels. If price fails near that area, the stock may remain range-bound for longer.
The $290–295 zone is more important from a long-term perspective. That is where buyers previously defended the stock. If AXP revisits that level while the fundamentals remain strong, it could become a more attractive accumulation area.
My view: AXP remains a quality name, but after a large run and a sharp correction, patience matters. This chart is not about chasing price. It is about building a plan before emotions take control.
For investors, the goal is not to predict every candle. The goal is to understand where the market has defended the stock before, where resistance may appear, and where the risk/reward becomes more attractive.
Plan the investment before the emotions.
(High-Quality Structural Breakout)(High-Quality Structural Breakout)
Why it works structurally:
Trend Transition: Price has established higher swing lows after a deep downtrend, shifting from a bearish environment to a consolidation breakout.
Keltner Channel Expansion: The entry bar is a strong momentum expansion bar that penetrated the Upper Keltner Channel, supported by a distinct bullish climax background zone.
The Momentum Setup: Looking at the EOD Momentum Gauge, the fast line (orange) has hooked firmly back above the signal line (cyan) from a shallow pullback, demonstrating structural acceleration just as price broke the green trendline.
AXP — Projected Harmonic Cluster at VWAP SupportAXP — Projected Harmonic Cluster at VWAP Support
American Express is currently developing a technically interesting corrective structure on the daily chart.
The key element of this analysis is the projected harmonic cluster, where a potential Gartley + Cypher completion zone aligns with the projected VWAP support. This creates an important confluence area around 193 USD.
From a harmonic perspective, the current price action suggests that AXP may continue to correct lower and gradually move toward this projected cluster. As long as price remains below the major Fibonacci retracement levels above, the preferred scenario is a continuation of the corrective leg into the green PRZ and VWAP support area.
Main target: 193 USD
The area around 193 USD is especially relevant because several technical factors come together at this level:
Projected VWAP support
Gartley completion zone
Cypher completion zone
Deep corrective target after the previous major advance
If price reaches this zone, I would expect a technical reaction or pullback from that area. The likely upside reaction targets would be the marked Fibonacci retracement levels above, especially the 38.2%, 61.8% and 78.6% retracement zones, depending on the strength of the reversal.
Expected path
The preferred scenario is a continuation lower into the harmonic cluster around 193 USD. Once this projected VWAP-supported zone is reached, a bullish pullback toward the Fibonacci retracement levels above becomes the more attractive technical scenario.
From a timing perspective, if the structure continues to unfold harmonically, the current downward movement could be completed around September 2026. This would fit well with the projected geometry of the pattern and the expected completion of the harmonic correction.
Conclusion
AXP remains in a projected corrective phase. The main target is the harmonic Gartley + Cypher cluster around 193 USD, where the projected VWAP may act as strong dynamic support. If price reaches this area by September 2026, a pullback toward the Fibonacci retracement levels above would be the preferred technical scenario.
May 10, 2026 AXP. Continued stock growth.- Exchange: Bitget TradFi
- Instrument: AXPon
- Timeframe: Weekly
- Trade type: Buy stop order
- Price: 324.78
- Take Profit: Open
- Stop Loss: 313.61 (-3.50 %)
Idea: Long on a breakout above last week's high — bullish momentum continuation.
Entry: Buy stop above last week’s high.
Stop-loss: Below the low of the same candle. A pullback below this level invalidates the trade.
Take Profit: Trailing stop following the lows of new weekly candles.
This is not an individual investment recommendation.
A list of over 250 Bitget TradFi (stock tokens)
American Express (AXP): A Premium Franchise Without a Clear MargExecutive Summary:
Margin of safety verdict: At roughly $316 per share, the available evidence does not demonstrate a 20 percent discount to conservative intrinsic value estimates, so this appears to be a high quality business trading around fair value rather than a clear value opportunity.
American Express is one of the few financial institutions that successfully combines a global payment network with consumer lending. That structure has historically produced strong returns on capital. The company benefits from an affluent customer base and a brand strong enough to charge both annual card fees and merchant discount fees. Over time, network effects, loyalty programs, and deep transaction data have reinforced the franchise.
Still, several uncertainties temper conviction from a strict value investing perspective. First, the evidence set includes limited verified data on long‑term ROIC trends, capital intensity, and normalized free cash flow. Second, the hybrid structure introduces real cyclicality. During downturns the company faces pressure on both sides of the business: transaction volumes can soften while credit losses increase. Third, competition in premium cards has intensified, triggering a rewards arms race that could gradually reduce incremental returns on capital.
Taken together, American Express remains a high quality franchise with a durable brand. But the current valuation already reflects much of that strength. Without a clearly demonstrated discount to intrinsic value, the situation is intellectually interesting but does not meet the traditional value investing requirement of buying a dollar for sixty or seventy cents.
One Stock, Dozens of Voices:
This is not one analyst's opinion. CrowdWisdom aggregated 5 independent sources for AXP (1 live market intelligence feeds; 3 prior CrowdWisdom analysis snapshots (internal archive); 1 verified financial data checks (Yahoo Finance)) and synthesized the shared thesis: what do dozens of traders, investors, and researchers broadly agree on, where do they disagree, and what might the market be missing?
The evidence was then stress-tested by placing opposing views side by side: a bull case, a bear case challenging the consensus, and a review of what expectations already appear embedded in the price. All financial metrics were cross-validated against live market data.
What follows highlights where opinions converge, where they diverge, and whether the stock offers any genuine margin of safety at today’s price.
Business Quality and Moat Durability:
American Express operates a structure that is unusual within global payments. Unlike Visa and Mastercard, which largely act as transaction networks, American Express controls several layers of the payment ecosystem. It issues cards, runs the network, manages merchant relationships, and in many cases carries the credit exposure itself.
That closed loop structure creates several advantages.
For one, it produces richer transaction data because both sides of each payment move through the same network. That data feeds risk modeling, marketing analytics, and merchant insights.
The brand has also historically targeted affluent consumers and corporate travelers. Those customers tend to spend more per card than the mass market average and generally show lower default risk.
Another advantage comes from the loyalty ecosystem. Rewards points, travel perks, airport lounge access, and co-branded partnerships create meaningful switching costs that encourage cardmembers to concentrate spending on the platform.
Merchants often tolerate higher discount fees as well, partly because American Express cardholders historically spend more per visit than users of other card networks.
These advantages have held up for decades. Payment networks are difficult to replicate because they require regulatory approvals, fraud prevention infrastructure, merchant acceptance, and consumer trust.
That said, the moat today appears stable rather than clearly expanding.
There are several structural pressures. Merchants periodically push back against higher acceptance fees. Digital wallets such as Apple Pay have shifted the consumer interface layer of payments away from card issuers. And competition in premium cards from large banks has intensified the rewards race.
None of these trends are likely to eliminate American Express. But they could gradually narrow the economic gap between American Express and competing issuers.
Return on Invested Capital (ROIC):
Historically, American Express has produced strong returns on capital thanks to the combined economics of payments processing and lending.
The network side of the business is relatively capital light. Once the infrastructure is in place, incremental transactions generate high margins. At the same time, interest income from revolving balances provides a second earnings stream.
However, the current evidence set includes limited verified ROIC data. That matters because incremental returns on capital often determine long-term compounding potential.
Several structural shifts could influence future ROIC.
Customer acquisition increasingly relies on expensive rewards and marketing incentives. These costs behave economically like reinvestment even though they appear as operating expenses.
Technology spending and fraud prevention systems are also rising across the payments industry.
Co-branded partnerships with airlines and travel companies frequently involve revenue sharing arrangements.
If these costs grow faster than transaction volumes, incremental ROIC could gradually decline even if reported earnings remain strong.
In other words, the historical capital-light narrative may not fully describe the economics of the next decade.
Quality of Earnings:
American Express generates substantial accounting earnings, but free cash flow appears somewhat less stable than the income statement alone might suggest.
Recent data indicates that free cash flow declined meaningfully between 2022 and 2024 before recovering again in 2025. That volatility may reflect working capital movements, credit cycle dynamics, or investment spending.
For lenders, free cash flow is inherently more complex than for businesses like software companies. Changes in loan balances, charge offs, and funding structures can materially affect reported cash generation.
For investors, the key question is whether current earnings represent normalized profitability or peak-cycle conditions. If consumer credit losses rise during a recession, the income statement could look quite different.
Capital Allocation Scorecard:
American Express has historically returned substantial capital to shareholders through dividends and share repurchases.
The dividend yield currently sits near 1.2 percent. While modest, the payout has grown over time and signals management confidence in the durability of earnings.
Buybacks have historically been the larger component of capital returns. When executed below intrinsic value, repurchases can meaningfully increase per-share earnings power.
However, buybacks only create value when shares are repurchased at attractive prices. If the company buys back stock during periods of premium valuation, the benefit to long-term owners becomes less clear.
Because the dataset does not provide precise intrinsic value estimates for those periods, it is difficult to determine whether recent buybacks occurred at particularly compelling prices.
Customer and Revenue Concentration:
American Express does not rely on a small number of corporate clients for revenue. Instead, concentration shows up in the spending patterns of specific demographic groups.
A large share of transaction volume comes from affluent consumers and small businesses in developed markets. These segments typically generate higher spending levels and lower default rates than mass market borrowers.
That concentration also creates certain macro vulnerabilities.
If asset markets decline sharply or luxury travel spending weakens, American Express could experience a sharper drop in billed business than mass market card issuers.
Travel and entertainment spending has historically played an outsized role in American Express usage, and that category tends to be cyclical.
Management Alignment:
Public disclosures indicate that executive compensation includes a mix of salary, bonuses, and equity incentives tied to performance metrics.
Equity-based compensation can align management with shareholders when it encourages long-term value creation rather than short-term earnings targets.
However, detailed insider ownership statistics were not present in the available dataset, which limits a more precise assessment of alignment.
10-Year Durability Test:
For long-term investors, the central question is whether the business will still look recognizable a decade from now.
In the case of American Express, the core payments ecosystem has proven remarkably durable. Trust networks, regulatory approvals, and fraud infrastructure create formidable barriers to entry.
Digital wallets are often framed as disruptive threats, but in practice most operate on top of existing card networks. In those cases the wallet changes the user interface rather than the underlying economics.
The larger uncertainty involves competition within premium cards. Banks and fintech firms have become increasingly aggressive with rewards programs and sign-up bonuses.
If that rewards arms race continues to escalate, the economics of acquiring and retaining high-spending customers could weaken.
Even so, the probability that American Express disappears from the payments landscape over the next decade appears low. The more relevant issue is whether its economic advantage expands or gradually erodes.
Multi-Year Thesis (3 to 7 years):
Base Scenario (Probability 50 percent)
Assumptions: mid single digit annual revenue growth, moderate expansion in billed business, stable credit losses near historical averages, operating margins near current levels.
Under these conditions earnings growth likely tracks high single digits annually. Applying a valuation multiple around 16 to 18 times earnings suggests an intrinsic value range roughly between $300 and $360 per share.
Bull Scenario (Probability 25 percent)
Assumptions: strong growth in affluent global consumers, expanding merchant acceptance internationally, stable credit environment, and effective pricing power in premium cards.
In this scenario earnings could grow at a low double digit rate for several years. If the market assigns a premium multiple closer to high quality payment networks, intrinsic value could reach roughly $400 to $450 per share.
Bear Scenario (Probability 25 percent)
Assumptions: recession triggers higher charge offs, travel spending declines, and rewards competition compresses margins.
Under those conditions earnings could fall materially for several years while the market assigns a lower valuation multiple closer to traditional financial institutions. Intrinsic value could decline toward $200 to $240 per share.
Probability weighted across these scenarios, the estimated intrinsic value clusters around the low to mid $300 range.
Margin of Safety Verdict:
The current share price near $316 sits squarely within the estimated base case valuation range.
That suggests the market is already pricing American Express as a high quality but cyclical financial franchise with steady growth. Investors are not being offered a substantial discount to conservative intrinsic value estimates.
From a traditional value investing standpoint, that absence of a discount is the central issue. Even outstanding businesses can deliver mediocre investment results when purchased at full price.
For that reason, the discussion that follows should be viewed primarily as analytical context rather than a strong call to action.
Peak Margin Stress Test:
Current profitability reflects strong consumer spending and relatively benign credit conditions.
A stress scenario could involve three pressures hitting at once.
First, billed business growth slows as discretionary spending weakens.
Second, charge offs rise as consumer credit conditions deteriorate.
Third, rewards spending increases as issuers compete more aggressively for premium customers.
If operating margins were to compress meaningfully under those conditions, earnings could decline by 20 to 35 percent during a downturn. Combined with valuation multiple compression, the share price could plausibly fall 30 to 45 percent from peak-cycle levels.
Valuation Framing:
The market typically values American Express somewhere between traditional banks and pure payment networks.
Banks often trade at lower earnings multiples because they carry credit risk and are more exposed to economic cycles. Pure payment networks command higher multiples because they avoid lending exposure.
American Express sits between those two models. The current trailing price to earnings ratio near 19.7 and forward multiple around 15.7 reflect that hybrid identity.
For meaningful upside, several factors would likely need to align: sustained growth in affluent consumer spending, stable credit conditions, and evidence that rising rewards costs do not erode long-term margins.
Perception vs Reality:
The market often describes American Express as a premium payments network.
In reality, it is a hybrid business that combines a card network with a consumer lending operation. That distinction matters because lending introduces cyclical risk that pure networks largely avoid.
Why This May Be Misunderstood:
Investors frequently focus on the brand strength and affluent customer base of American Express. Those advantages are real, but they do not eliminate exposure to credit cycles.
The ongoing cost of maintaining premium rewards programs is also easy to underestimate when projecting long-term profitability.
Three Measurable Things to Watch Next Quarter:
Credit quality metrics including charge off rates and delinquency trends.
Growth in billed business relative to broader payment network peers.
Rewards and marketing expenses as a percentage of revenue.
Historical Conviction Drift:
Internal archive analysis shows that recent discussions around American Express have increasingly centered on macro conditions affecting financial stocks rather than company-specific fundamentals.
Technical commentary has sometimes pointed to sector rotation away from financials, while macro analysis has focused on inflation trends, energy prices, and geopolitical risks influencing consumer spending.
This shift toward macro discussion may simply reflect the reality that American Express performance is closely tied to economic cycles.
Disconfirming Evidence:
The strongest argument against owning American Express today is fairly simple.
Even if the business remains high quality, the current valuation assumes that profitability stays relatively stable and that affluent spending continues to grow. If either assumption proves too optimistic, the downside could be meaningful.
Put differently, the company may be excellent, but the investment case still leans heavily on favorable macro conditions.
Risks:
Consumer credit deterioration leading to higher loan losses.
Escalating rewards competition compressing incremental returns on capital.
Merchant pushback against higher discount fees.
Regulatory action targeting interchange or merchant fee economics.
Technological shifts that allow alternative payment rails to bypass traditional card networks.
Summary:
American Express remains one of the most recognizable franchises in global payments. Its closed loop network, premium brand, and affluent customer base provide a durable competitive position.
But durability alone is not enough for disciplined value investors. Price still matters.
At roughly $316 per share, the stock appears to trade near reasonable estimates of intrinsic value rather than at a meaningful discount. That means the eventual investment outcome will likely depend more on future business performance than on valuation expansion.
For investors who already own the shares, the thesis remains intact as long as credit quality and spending trends remain healthy.
For new investors seeking a large margin of safety, patience may be warranted.
Data Snapshot:
Current Price: about $315.95
Metric: Value
Current Price (AXP): $315.95
Market Capitalization: $215.58 billion
Shares Outstanding: 682,326,443
Trailing P/E: 19.72x
Forward P/E: 15.71x
Enterprise Value (EV): $222.17 billion
EV/EBITDA: N/A
Revenue (TTM): $68.81 billion
Gross Margin: 62.76%
Operating Margin: 21.25%
Free Cash Flow (FCF): N/A
FCF Yield: N/A
52-Week Range: $273.89 to $387.49
Sector: Financial Services
Industry: Credit Services
References:
This analysis reviewed approximately 58 article sources and 2 video transcripts.
1. AlphaSpread. American Express Summary. www.alphaspread.com
2. AlphaSpread. American Express NYSE Summary. www.alphaspread.com
3. Wall Street Prep. Value Investing 101. www.wallstreetprep.com
4. Macroaxis. American Express Valuation. www.macroaxis.com
5. Acquirer's Multiple. American Express Intrinsic Value Calculation. acquirersmultiple.com
6. GuruFocus. AXP Intrinsic Value Projected FCF. www.gurufocus.com
7. AlphaSpread. American Express Balance Sheet. www.alphaspread.com
8. Acquirer's Multiple. American Express Intrinsic Value Calculation Update. acquirersmultiple.com
9. Validea. AXP Factor Report. www.validea.com
10. Simply Wall St. American Express Narrative Update. simplywall.st
11. The Investors Podcast. American Express Intrinsic Value Assessment. www.theinvestorspodcast.com
12. Yahoo Finance. The Art of Valuation Discovering American Express. finance.yahoo.com
13. Yahoo Finance. AXP Key Statistics. finance.yahoo.com
14. Simply Wall St. American Express Valuation After Strong Quarter. simplywall.st
15. StockInvest. AXP Financials. stockinvest.us
16. Simply Wall St. American Express Overview. simplywall.st
17. Medium. How to Calculate Intrinsic Value Using P E Ratio. medium.com
18. Seeking Alpha. AXP Coverage. seekingalpha.com
19. Morningstar. American Express Quote. www.morningstar.com
20. FinanceCharts. AXP DCF Calculator. www.financecharts.com
21. Ecomoat. AXP Moat Analysis. ecomoat.ai
22. 247WallSt. American Express Earnings Trends. 247wallst.com
23. TradingView. AXP Ideas. www.tradingview.com
24. Kavout Market Lens. American Express Dividend Increase Analysis. www.kavout.com
25. StockStory. American Express Stock Analysis. stockstory.org
26. GuruFocus. American Express Earnings Analysis. www.gurufocus.com
27. Yahoo Finance. American Express Earnings Surprise Coverage. finance.yahoo.com
28. OptionSlam. AXP Earnings Data. www.optionslam.com
29. Yahoo Finance. American Express Outlook Coverage. finance.yahoo.com
30. ChartMill. AXP Earnings Page. www.chartmill.com
31. Macrotrends. American Express Long Term Investments. www.macrotrends.net
32. Trefis. American Express Data Overview. www.trefis.com
33. Trefis. American Express Company Data. www.trefis.com
34. Simply Wall St. American Express Historical Performance. simplywall.st
35. AInvest. American Express Earnings Discussion. www.ainvest.com
36. Macrotrends. American Express Revenue History. www.macrotrends.net
37. Yahoo Finance. AXP Analysis Page. finance.yahoo.com
38. Market Chameleon. AXP Earnings Price Moves. marketchameleon.com
39. Zacks. Top Research Reports American Express. www.zacks.com
40. American Express Investor Relations. ir.americanexpress.com
41. Benzinga. AXP Analyst Ratings. www.benzinga.com
42. MarketWatch. AXP Analyst Estimates. www.marketwatch.com
43. Wall Street Journal. AXP Research Ratings. www.wsj.com
44. ChartMill. AXP Analyst Ratings. www.chartmill.com
45. Zacks. AXP Price Target Forecast. www.zacks.com
46. Investing.com. American Express Consensus Estimates. www.investing.com
47. MLQ AI. AXP Stock Forecast. mlq.ai
48. TradingView. AXP Forecast Page. www.tradingview.com
49. MarketBeat. American Express Stock Data. www.marketbeat.com
50. QuiverQuant. American Express Stock News. www.quiverquant.com(AXP
51. Stockchase. AXP Analysis. stockchase.com
52. MarketScreener. American Express Consensus Estimates. www.marketscreener.com
53. Yahoo Finance. AXP Quote Page. finance.yahoo.com
54. TipRanks. AXP Forecast. www.tipranks.com
55. CNN Business. American Express Stock Overview. www.cnn.com
56. Barchart. AXP Analyst Ratings. www.barchart.com
57. Yahoo Finance. AXP Stock Forecast Research. finance.yahoo.com
58. Tavily Search API Endpoint. api.tavily.com
59. Dig Perspectives YouTube Channel Video. www.youtube.com
60. Eurodollar University YouTube Channel Video. www.youtube.com
Disclaimer:
This article is for informational purposes only and should not be considered investment advice. Investors should conduct their own research and consider their financial circumstances before making investment decisions.
AXP (American Express) — Q1 Earnings Beat: Premium Card**💡 AXP (American Express) — Q1 Earnings Beat: Premium Card Spending Hits 3-Year High **
**SECTION 1 — Executive Summary** 💼
American Express delivered a strong Q1 2026 earnings beat with revenue of $18.9 billion (up 11 percent YoY) and adjusted EPS of $4.28 (up 18 percent YoY, beating estimates by $0.22), driven by accelerated card-member spending growth of 10 percent — the highest quarterly pace in three years — plus robust premium card momentum and international expansion. This results-oriented payments leader signals resilient consumer trends and premium segment strength in a normalizing economy. Overall rating: Buy. 12-month price target: $380 (blended DCF and comps methodology incorporating sustained mid-teens EPS growth and premium mix expansion). The single biggest reason to own this stock right now is American Express’s unmatched premium card franchise and value-added services engine that deliver high-margin, recurring revenue with network effects few rivals can replicate. The single biggest risk is a sharper-than-expected slowdown in affluent consumer spending or regulatory pressure on interchange fees.
**SECTION 2 — Business Overview** 🏢
American Express operates as a global payments and financial services company providing charge and credit cards, merchant services, and travel-related offerings to consumers, small businesses, and corporations. Revenue breakdown (most recent FY 2025): Card member services and fees ~50 percent, discount revenue ~30 percent, net interest income ~15 percent, and other ~5 percent with premium products (Platinum, Centurion) driving disproportionate profitability (source: company Q1 2026 earnings release April 23 2026). Business model generates revenue through interchange and discount fees on spending, annual card fees (especially premium), interest on revolving balances, and high-margin value-added services such as travel, insurance, and loyalty programs that create sticky repeat usage. Competitive moat stems from its closed-loop network, exclusive premium card perks, deep data analytics on affluent spenders, and brand prestige that command higher pricing power versus open-loop competitors like Visa and Mastercard.
**SECTION 3 — Financial Deep Dive** 📈
Key metrics (Q1 2026 reported April 23 2026; FY 2025 from prior releases):
Revenue: $18.9 billion (Q1 2026, +11 percent YoY, +10 percent FX-adjusted).
Net income: $2.46 billion.
EPS (adjusted): $4.28 (beat by $0.22).
Gross margin / operating margin: Expanding on premium mix and services growth.
Free cash flow: Strong conversion supporting share repurchases and dividends.
YoY growth rates: Revenue +11 percent; adjusted EPS +18 percent.
Balance sheet health: Solid capital ratios with low leverage; strong liquidity.
Cash flow quality: High-quality with operating cash flow exceeding net income.
Capital allocation: Continued heavy investment in premium card marketing and technology, ongoing share repurchases, and dividend growth (source: company Q1 2026 earnings materials April 23 2026).
**SECTION 4 — Growth Analysis** 🚀
Total addressable market (TAM): Global payments volume projected to exceed $200 trillion annually by 2030 with premium and digital segments growing fastest (industry estimates via company and analyst reports as of 2026). Current market share: Dominant in U.S. premium cards with ~85 percent affluent cardholder share and rapid millennial/Gen Z penetration (44 percent of cardholders). Key growth drivers next 3–5 years: Premium card acquisition (Platinum YoY growth 22 percent), international expansion (20th consecutive quarter of double-digit growth), and value-added services scaling. Management reaffirmed full-year 2026 guidance (9–10 percent revenue growth, EPS $17.30–$17.90), more bullish than tempered consensus on spending trends. Growth is primarily organic through premium mix shift and network expansion rather than acquisition-dependent.
**SECTION 5 — Valuation** 📊
DCF analysis: Base case assumes 9–11 percent revenue CAGR, expanding operating margins to mid-20s percent on services leverage, WACC 9.5 percent, terminal growth 3.5 percent . Implied value supports $380 target. Comparable company analysis (peers as of April 2026): V/Mastercard at 25–30x forward P/E; other financials 12–18x; AXP trades at premium justified by growth. Historical valuation range (5-year): Forward P/E 18–28x. Bull target $430 (accelerated premium spend and services); Base $380; Bear $300 (macro spending pullback). Current price ~$333 offers ~14 percent upside to base target.
**SECTION 6 — Risk Analysis** ⚠️
1. Affluent consumer spending slowdown (medium-high probability/impact): Triggered by recession or wealth effect reversal; watch monthly spend data.
2. Regulatory scrutiny on fees/interchange (medium): Potential caps or antitrust actions; monitor U.S./EU policy.
3. Competition in premium segment (medium): Chase, Citi gaining share; track market share metrics.
4. FX and interest rate sensitivity (medium): Higher rates boost net interest but pressure volumes; watch Fed path.
5. Cybersecurity or fraud spikes (low-medium): Impact on trust; monitor incident reports.
Short interest low; insider activity typical with no red flags. No accounting quality concerns.
**SECTION 7 — Catalyst Calendar** 📅
Next earnings date: Q2 2026 late July. Upcoming events: Continued premium card launches and travel recovery updates throughout 2026. Macro events: Consumer confidence data, Fed rate decisions affecting spending. 12-month timeline: Quarterly spend trend reports, potential international market expansions, and annual guidance updates.
**SECTION 8 — Technical Analysis** 📈
Primary Chart: Daily timeframe, 1-year view shows AXP in a steady uptrend, recently consolidating near $330–$340 after strong 2025 gains. Price action holds above the 50-day and 200-day moving averages with bullish higher lows. RSI (14) neutral around 55 indicating room to run; MACD positive with supportive volume. Major support zone $310–$320, resistance $350–$360. Visible setup: Continuation within ascending channel. Technical implication: Bullish bias reinforced by today’s earnings beat with potential for breakout on sustained volume.
**SECTION 9 — The Verdict** 🏆
Bull case ($430 target, 35 percent probability): Premium spending and services accelerate beyond guidance.
Base case ($380 target, 50 percent probability): Steady execution on reaffirmed outlook with resilient consumer trends.
Bear case ($300 target, 15 percent probability): Macro slowdown pressures volumes.
Expected value calculation: Probability-weighted price target = $387. Final recommendation: Buy with High conviction. The 30-second elevator pitch: American Express just proved premium consumers are still spending strongly — with today’s Q1 beat, 10 percent spending growth, and reaffirmed guidance, the stock offers attractive upside as the premier high-margin payments franchise in a digital-first world.
**Sources**
American Express Q1 2026 earnings release and presentation April 23 2026; Yahoo Finance/StockStory charts and data April 23 2026; company investor materials and analyst consensus.
What are your thoughts on AXP? Drop them below 👇
#AXP #AmericanExpress #Q1Earnings #EarningsBeat #PremiumCards #ConsumerSpending #PaymentsStocks #StockMarket #Financials #BuyTheBeat
AXP 3rd Touch on Trendline + RSI 38 + Record Low TTM SqueezeAmerican Express ( NYSE:AXP ) is showing a very strong 3rd touch on a major weekly trendline dating back to October 2023.
Price has now tested this upward-sloping support line for the third time (previous touches in 2024 and mid-2025).
Each prior touch was respected with strong bounces.
Currently consolidating right on the trendline near the $300 area.
Additional strong confluence:
Weekly RSI sitting at 38 (approaching oversold territory, showing bullish divergence with higher lows).
TTM Squeeze is at its lowest level ever recorded on the weekly chart — extreme compression, signaling a potential explosive move once it fires.
This multi-touch trendline support combined with deeply compressed TTM Squeeze and oversold RSI often leads to powerful reversals or continuation moves higher, especially in a high-quality name like ( NYSE:AXP ) with strong fundamentals (premium spending resilience and network effects).
If support holds and we get a weekly close above recent highs (~$310–$315), measured targets are $340–$360+, with extension potential to $380+ on strong momentum.
Watch for increasing volume and a decisive bounce candle off the trendline. This is a high-conviction, low-risk entry zone if the trendline holds.
Defensive rotation + quality financials are in favor right now.
#AXP #TrendlineTouch #WeeklyChart #TTMSqueeze #BullishSetup #AmericanExpress
NYSE – S&P 500 | AXP | 21 Mar 2026Part of the ongoing S&P 500 Structural Census study.
American Express reflects a sustained impulsive structure, with a long-term secular uptrend defined by consistent higher highs and higher lows.
Corrective phases have remained contained within the broader structure, with no confirmed structural breakdown.
Current behaviour reflects continuation following corrective phases.
No prediction. Structure observation only.
This analysis is for educational purposes and reflects structural market behaviour.
Structure → Level → Trigger → Probability
#SP500Census #MarketStructure #StructuralAnalysis #AXP #EwavesJournal
AXPTeam,
We are not buying now.
Price is still trading below major descending resistance (R).
As long as we are below R, the structure remains under pressure.
✅ What We Are Waiting For
We only buy if:
Price breaks above the descending resistance (R)
A candle closes clearly above it
We see strength (no immediate rejection wick)
Ideally: a small pullback that holds above R
No breakout = no trade.
🟢 Entry Plan (After Confirmation)
Once price:
Breaks above R
Retests and holds
AMD and AXP + One Checklist Rule I Always UseIn this video I’m walking through a line from my trading checklist: scanning for levels price can still be drawn to before a move continues.
Using AMD as the example, I show what got me into a small end of day position, and what I’m staying aware of on the weekly if downside pressure continues.
In the video:
the checklist item I use before entering, scanning for “where it can still go”
AMD entry context, the little shelf and tiny base that supported a small position in it
the weekly downside areas I’m watching, pivot zone, gap origin, 50 SMA
how I think about “if this doesn’t go,” without forcing a counter trade
why awareness of surroundings matter (AXP example)
Enjoy and let me know if you have questions. It's like speaking into the void out here LOL!
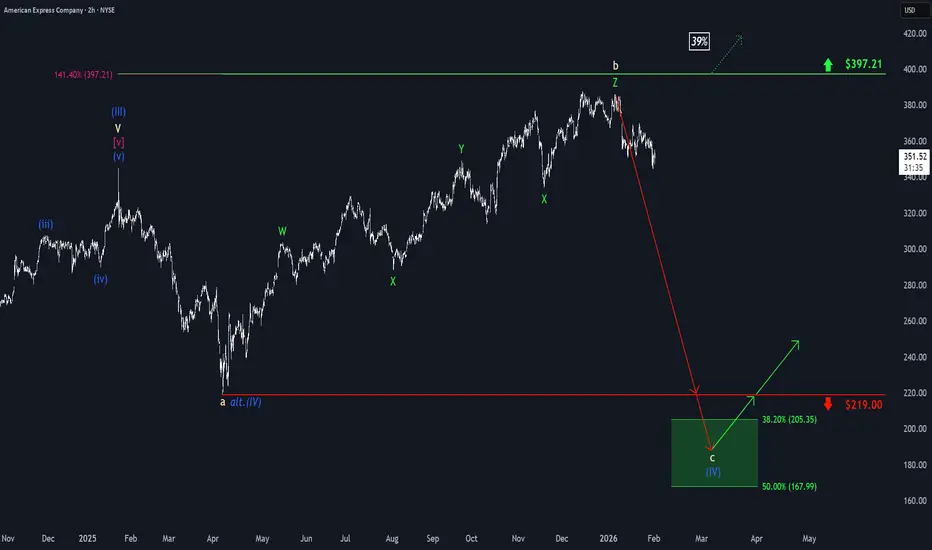
American Express: Wave c in ProgressShares of American Express have continued to sell off recently. According to our primary scenario, the beige wave c is progressing and likely to complete below our support at $219, in our green Long Target Zone between $205.35 and $167.99. Within this range, we anticipate the the low of the blue wave (IV), which should conclude the current corrective cycle. If American Express were to break directly above the resistance at $397.21 without retreating into our zone, the blue wave alt.(IV) would have already ended at $219 (probability: 39%).
American Express Gears Up For Q4 Earnings Report American Express Company (NYSE:AXP) will release earnings for the fourth quarter before the opening bell on Friday, Jan. 30.
Analysts expect the New York-based company to report fourth-quarter earnings of $3.54 per share. That's up from $3.04 per share in the year-ago period. The consensus estimate for American Express' quarterly revenue is $18.88 billion (it reported $17.18 billion last year),
The company has beaten analyst estimates for revenue in three straight quarters and in five of the past 10 quarters overall.
Financial Performance
In 2024, American Express's revenue was $60.76 billion, an increase of 9.30% compared to the previous year's $55.59 billion. Earnings were $10.00 billion, an increase of 21.12%
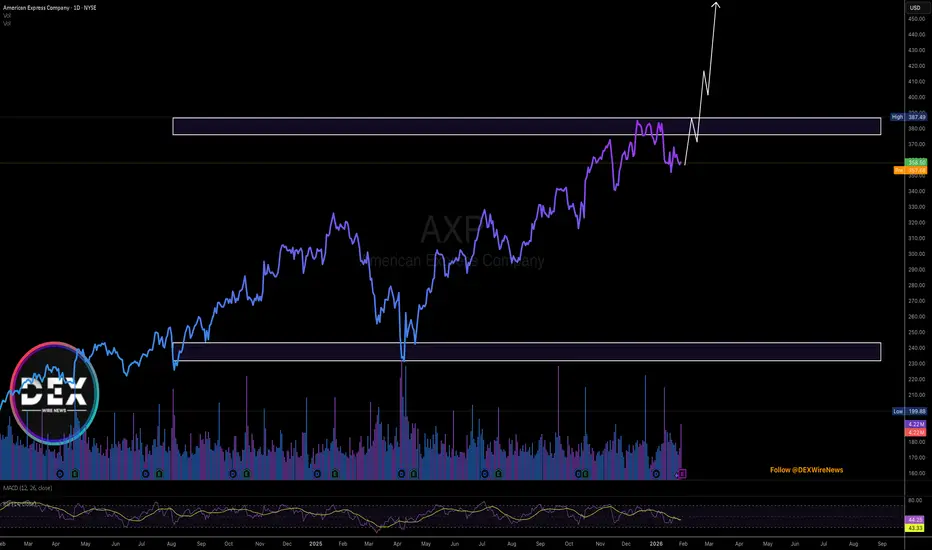
Technically, NYSE:AXP might be gearing for a major breakout should the stock break above the $380 resistance. With RSI at 44, it further solidify our bullish thesis.
$AXP - Big Move Incoming?Hello Traders!
NYSE:AXP is looking very similar to $C
Love that down trendline and I've been loving these wedge setups recently, super tight consolidation into that wedge
Resistance up above at around $386 which is my price target for this setup
I think price will go up to that resistance and reject off for a 3rd time
Also has great support underneath with that 200SMA, I love setups like these because they are reliable and show up a lot in the market
Thank you all for reading have a great day and if you don't mind please LIKE, FOLLOW, and COMMENT!
Thank you!
American Express (AXP) High-Risk Zone AnalysisThe stock is currently in a high-risk area for buying.
Chart A (Weekly): Price is near the upper boundary of its 5-year channel, accompanied by a clear RSI divergence.
Chart B (Daily): Price is at the top of its 5-month channel, while both MACD and RSI show strong divergences.
Based on these signals, this stock appears to be in a very risky buying zone, with a potential corrective move down to around $355.
This analysis will be updated as the situation develops.
Follow me on TradingView for more analyses and live stock trades.
NYSE:AXP
AXP Eyes $400 as Buying Pressure Builds This Week:Current Price: 375.61
Direction: LONG
Confidence level: 64%(Based on repeated bullish language in trader discussions, multiple upside price references around $385–$400, and supportive short-term price action, balanced by limited YouTube coverage)
Targets
Target 1: 385.00
Target 2: 400.00
Stop Levels
Stop 1: 373.00
Stop 2: 367.00
Wisdom of Professional Traders:
This analysis pulls together the collective intelligence of professional traders who are actively tracking Small Caps ETF price action. When I stack all the trader commentary together, the short-term picture stands out clearly: several traders are warning that IWM is showing early weakness near the $250–$251 zone, with repeated failures to push cleanly higher. The wisdom of crowds matters here. Even though longer-term charts remain constructive, the near-term trader consensus is cautious to bearish, which carries more weight for a one-week trade.
Key Insights:
Here’s what’s driving this trade. Several traders are calling out a bullish continuation setup, with $385 repeatedly mentioned as the key level that opens the door to a push toward $400. That number isn’t random—it lines up with recent highs and round-number psychology, which tends to attract momentum buyers if broken.
Another thing that stands out is how traders are framing pullbacks. Instead of warning about breakdown risk, the discussion keeps circling back to buying dips near the $373–$367 zone. That tells me sellers haven’t taken control, and buyers are still defending key levels aggressively.
Recent Performance:
You can see this mindset reflected in the price action. AXP has climbed roughly 15% over the past three months and continues to hold higher lows. In recent sessions, the stock dipped toward support and quickly rebounded, keeping it near the top of its short-term range. That kind of behavior usually favors upside follow-through rather than a sharp reversal.
Expert Analysis:
Traders I’m tracking are focused on the structure more than the headlines. Several professional traders highlighted a daily flag-like formation, noting that price compression just below resistance often resolves higher when volume expands. The repeated focus on $385 and $400 across different discussions adds weight to those targets for this week.
Risk management is also clear in the crowd’s thinking. The $373 and $367 levels come up again and again as must-hold areas. That gives this setup a clean risk framework, which is especially important in a large-cap financial name where moves are usually measured, not explosive.
News Impact:
Recent news hasn’t derailed the trend. Dividend confirmation and steady earnings expectations support the broader story, while concerns around potential credit-card rate caps are being discussed as manageable rather than immediate threats. What matters most is how the stock reacts, and so far the market is absorbing the news without heavy selling pressure.
Trading Recommendation:
Putting it all together, I’m staying LONG on AXP for the week ahead. I like entries near current levels or on shallow pullbacks, targeting $385 first and $400 if momentum accelerates. I’d manage risk tightly with a stop below $373 and a deeper protection level near $367 if volatility picks up. Confidence isn’t extreme due to limited trader volume, but the balance of crowd wisdom, technical structure, and price behavior favors upside continuation.
AXP Holds Bullish Structure as Pullback Sets Up OpportunityAmerican Express (AXP) is signaling a confirmed bullish setup following a pullback, supported by a constructive bullish candlestick formation. Although the day’s volume came in below the daily average, demand is still expected to emerge around this zone as participation improves. Overall price action suggests the pullback is corrective rather than distributive.
From a technical perspective, AXP remains in strong bullish momentum, evidenced by higher highs and higher lows, with price trading above key moving averages. The orderly alignment of the EMAs further strengthens the bullish conviction and supports the case for trend continuation.
Fundamentally, American Express is a wide economic moat business with consistent growth in both revenue and EPS over the past five quarters. Profitability remains solid, with ROE sustained above 30% and ROIC above 12% over the same period, while net margins have averaged around 14% over the past three quarters, underscoring durable earnings power and operational discipline.