MINA/USDT Compressing Inside a Symmetrical TriangleMINA/USDT is forming a symmetrical triangle on the 4H chart, with price approaching the apex in roughly nine candles. The setup shows moderate trend strength, but weak compression and declining open interest suggest that confirmation is still needed.
A breakout above the upper trendline could trigg
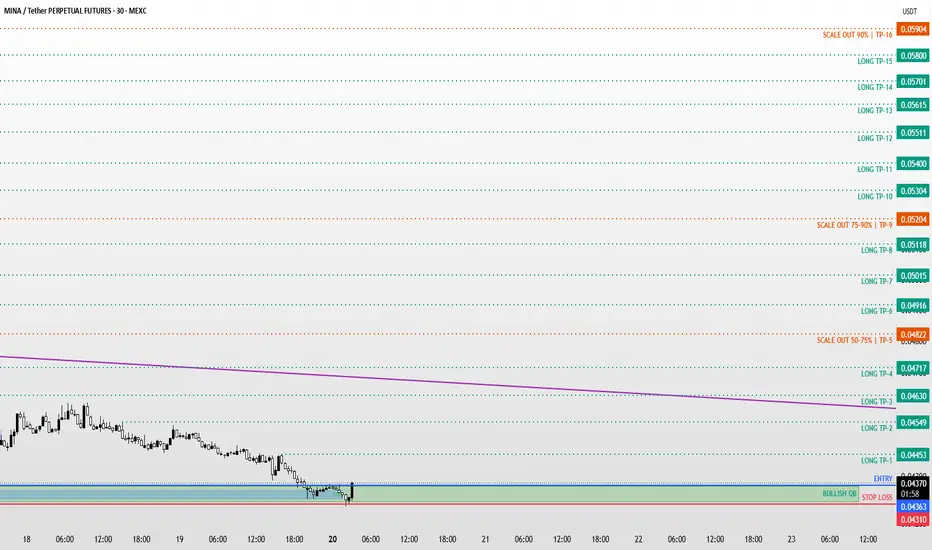
MINA / MINAUSDT Bullish Setup | Futures Trade IdeaMARKET ANALYSIS
MINA is currently reacting from a key technical area highlighted on the chart.
As long as the protected support zone remains intact, the bullish market structure remains valid and higher liquidity targets may continue to attract price action.
A breakdown below the invalidation
MINA / MINAUSDT Bullish Setup | Futures Trade IdeaMARKET ANALYSIS
MINA is currently reacting from a key technical area highlighted on the chart.
As long as the protected support zone remains intact, the bullish market structure remains valid and higher liquidity targets may continue to attract price action.
A breakdown below the invalidation
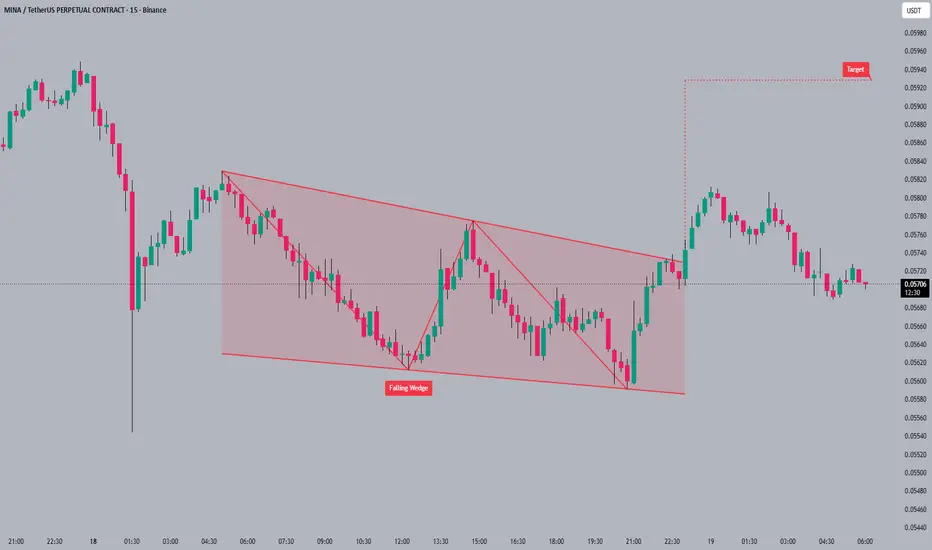
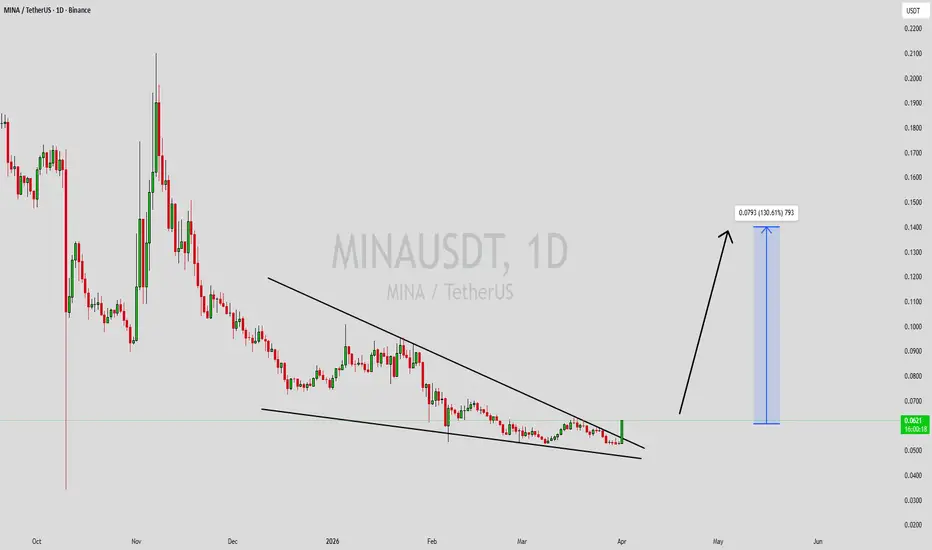
MINAUSDT Forming Falling WedgeMINAUSDT is forming a clear falling wedge pattern, a classic bullish reversal signal that often indicates an upcoming breakout. The price has been consolidating within a narrowing range, suggesting that selling pressure is weakening while buyers are beginning to regain control. With consistent volum
MINAUSDT - Cup and handle is a bullish pattern
MINAUSDT- My TP is 0.059 , 0.065 & 0.070
The cup and handle is a bullish continuation pattern signalling a buying opportunity,
where a "U"-shaped price correction (cup) is followed by a slight downward drift (handle) before breaking out to new highs.
It typically lasts 7 weeks to 1 year, with the
MINA Spot Analysis: 3 Ways to Trade the Upcoming BreakoutWelcome to another Mubite market update. Today we are looking at MINA (MINA/USDT) on the 4H timeframe.
The market structure is compressing within a large Symmetric Triangle pattern. Volatility is tightening, which usually precedes a massive expansion move.
Here is the technical breakdown and three
MINAUSDT.PAfter breaking out of the falling channel, a move
was observed that swept order block (OB)
liquidity. The N-shaped rising wave formed below the channel’s
upper support, with a high
probability of continuation to the upside,
supported by factors such as Tether dominance
(USDT.D) adjustment.
MINA/USDT — Market StructureMINA remains in a persistent downtrend.
A large amount of supply has been distributed from $0.20 and above.
Until price breaks and holds above this range, medium-term long positions are not justified.
🎯 A bounce can only be taken after a clear reversal setup forms — and there is none yet.
Also wort
See all ideas
Summarizing what the indicators are suggesting.
Oscillators
Neutral
SellBuy
Strong sellStrong buy
Strong sellSellNeutralBuyStrong buy
Oscillators
Neutral
SellBuy
Strong sellStrong buy
Strong sellSellNeutralBuyStrong buy
Summary
Neutral
SellBuy
Strong sellStrong buy
Strong sellSellNeutralBuyStrong buy
Summary
Neutral
SellBuy
Strong sellStrong buy
Strong sellSellNeutralBuyStrong buy
Summary
Neutral
SellBuy
Strong sellStrong buy
Strong sellSellNeutralBuyStrong buy
Moving Averages
Neutral
SellBuy
Strong sellStrong buy
Strong sellSellNeutralBuyStrong buy
Moving Averages
Neutral
SellBuy
Strong sellStrong buy
Strong sellSellNeutralBuyStrong buy
Displays a symbol's price movements over previous years to identify recurring trends.