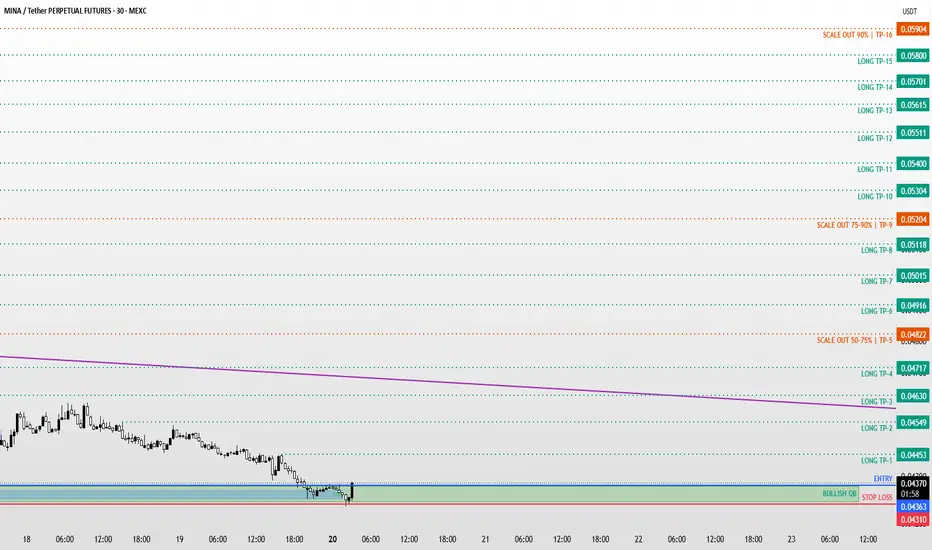
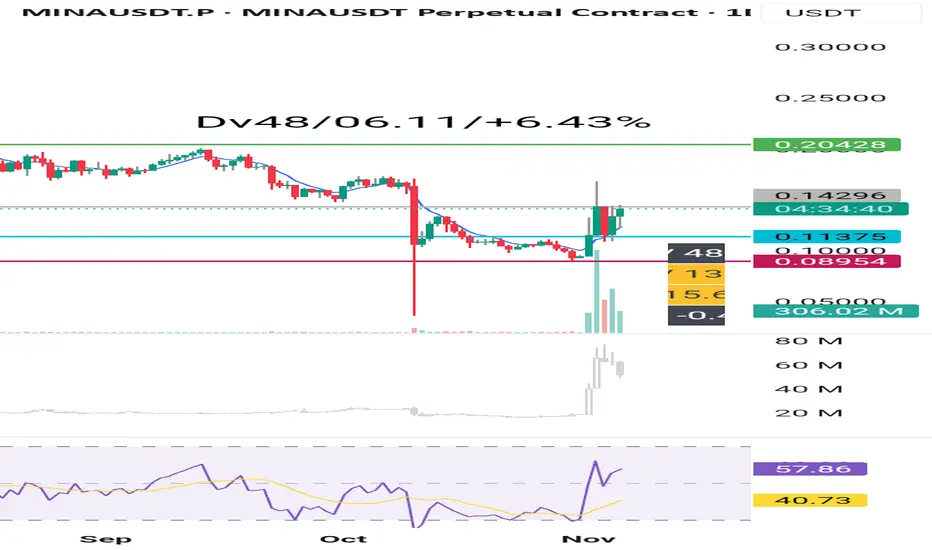
MINA / MINAUSDT Bullish Setup | Futures Trade IdeaMARKET ANALYSIS
MINA is currently reacting from a key technical area highlighted on the chart.
As long as the protected support zone remains intact, the bullish market structure remains valid and higher liquidity targets may continue to attract price action.
A breakdown below the invalidation level would weaken the current bullish scenario and require a reassessment of market conditions.
📍 Entry, Stop Loss and Take Profit levels are marked directly on the chart.
━━━━━━━━━━━━━━
⚠️ DISCLAIMER
This publication is provided solely for educational and market observation purposes.
Nothing contained in this analysis should be considered financial advice, investment advice, or a recommendation to buy or sell any financial instrument.
All trading and investment decisions remain solely the responsibility of the individual trader.
Always conduct your own research and apply proper risk management before entering any position.
━━━━━━━━━━━━━━
🎯 PARALOG
▪️Crypto Market Analysis
▪️BTC Futures Signals
▪️Bitcoin & Altcoin Market Analysis
Precision • Momentum • Timing
━━━━━━━━━━━━━━
Exchange: #MEXC Futures
#bitcoin #btc #crypto #futures #technicalanalysis
In-depth trading ideas
MINA/USDT Compressing Inside a Symmetrical TriangleMINA/USDT is forming a symmetrical triangle on the 4H chart, with price approaching the apex in roughly nine candles. The setup shows moderate trend strength, but weak compression and declining open interest suggest that confirmation is still needed.
A breakout above the upper trendline could trigger bullish continuation, while a break below support would favor a bearish move. Watch for increased volume to confirm direction.
MINA / MINAUSDT Bullish Setup | Futures Trade IdeaMARKET ANALYSIS
MINA is currently reacting from a key technical area highlighted on the chart.
As long as the protected support zone remains intact, the bullish market structure remains valid and higher liquidity targets may continue to attract price action.
A breakdown below the invalidation level would weaken the current bullish scenario and require a reassessment of market conditions.
📍 Entry, Stop Loss and Take Profit levels are marked directly on the chart.
━━━━━━━━━━━━━━
⚠️ DISCLAIMER
This publication is provided solely for educational and market observation purposes.
Nothing contained in this analysis should be considered financial advice, investment advice, or a recommendation to buy or sell any financial instrument.
All trading and investment decisions remain solely the responsibility of the individual trader.
Always conduct your own research and apply proper risk management before entering any position.
━━━━━━━━━━━━━━
🎯 PARALOG
▪️Crypto Market Analysis
▪️BTC Futures Signals
▪️Bitcoin & Altcoin Market Analysis
Precision • Momentum • Timing
━━━━━━━━━━━━━━
Exchange: #MEXC Futures
#bitcoin #btc #crypto #futures #technicalanalysis
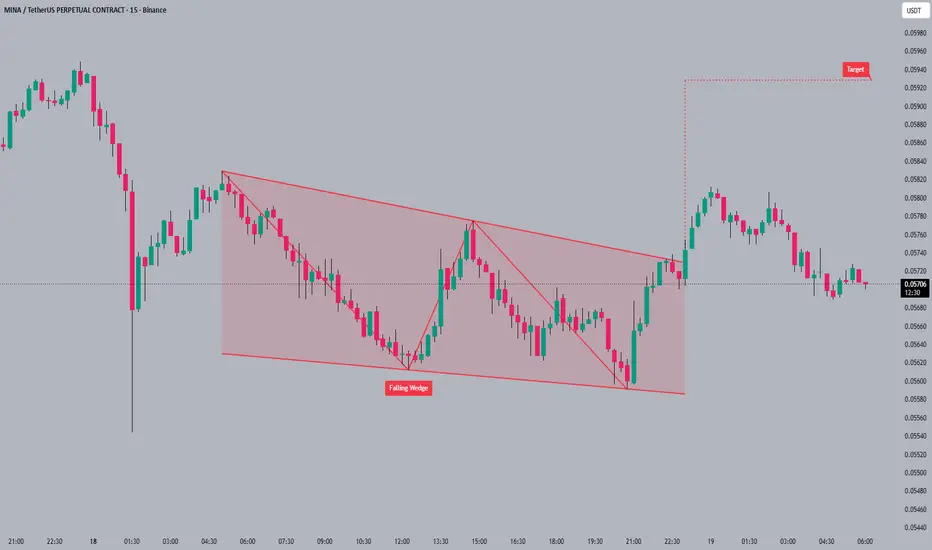
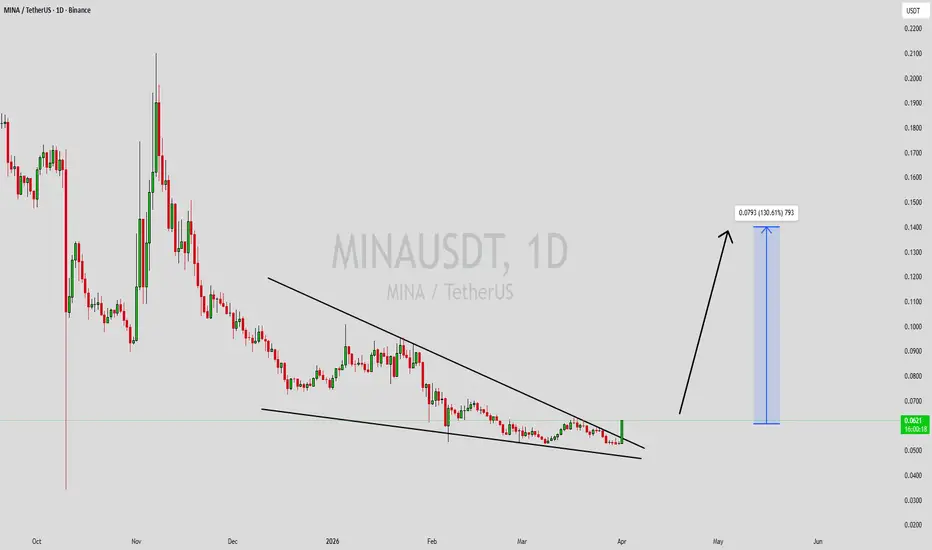
MINAUSDT Forming Falling WedgeMINAUSDT is forming a clear falling wedge pattern, a classic bullish reversal signal that often indicates an upcoming breakout. The price has been consolidating within a narrowing range, suggesting that selling pressure is weakening while buyers are beginning to regain control. With consistent volume confirming accumulation at lower levels, the setup hints at a potential bullish breakout soon. The projected move could lead to an impressive gain of around 90% to 100% once the price breaks above the wedge resistance.
This falling wedge pattern is typically seen at the end of downtrends or corrective phases, and it represents a potential shift in market sentiment from bearish to bullish. Traders closely watching MINAUSDT are noting the strengthening momentum as it nears a breakout zone. The good trading volume adds confidence to this pattern, showing that market participants are positioning early in anticipation of a reversal.
Investors’ growing interest in MINAUSDT reflects rising confidence in the project’s long-term fundamentals and current technical strength. If the breakout confirms with sustained volume, this could mark the start of a fresh bullish leg. Traders might find this a valuable setup for medium-term gains, especially as the wedge pattern completes and buying momentum accelerates.
✅ Show your support by hitting the like button and
✅ Leaving a comment below! (What is your opinion about this Coin?)
Your feedback and engagement keep me inspired to share more insightful market analysis with you!
MINAUSDT - Cup and handle is a bullish pattern
MINAUSDT- My TP is 0.059 , 0.065 & 0.070
The cup and handle is a bullish continuation pattern signalling a buying opportunity,
where a "U"-shaped price correction (cup) is followed by a slight downward drift (handle) before breaking out to new highs.
It typically lasts 7 weeks to 1 year, with the handle retracing 30%–50% of the cup's rise
MINA Spot Analysis: 3 Ways to Trade the Upcoming BreakoutWelcome to another Mubite market update. Today we are looking at MINA (MINA/USDT) on the 4H timeframe.
The market structure is compressing within a large Symmetric Triangle pattern. Volatility is tightening, which usually precedes a massive expansion move.
Here is the technical breakdown and three distinct "Models" to trade this setup depending on your risk style.
The Technical Structure
The Triangle Squeeze Price has been respecting both the ascending support trendline and the descending resistance trendline. We are approaching the apex, meaning a decision is imminent.
Key Zones
Red Zone (Resistance / Bearish OB): The immediate hurdle around 0.0895 - 0.0910. Price is currently testing this supply area.
Yellow Zone (Support / Bullish OB): The strong demand zone around 0.0780 - 0.0800. This aligns with the lower trendline support.
The Game Plan: 3 Trading Models
We have designed three specific entry models based on risk tolerance. Choose the one that fits your style.
Model 1: The "Hybrid" Approach (Aggressive)
Strategy: Buy a starter position at Current Market Price (CMP) and DCA lower.
Logic: You don't want to miss the move if it breaks out immediately, but you also want to be safe.
Execution: Enter 30-40% of your size here at CMP (~0.0895). If price drops, add the remaining 60-70% at the Yellow Zone (Bullish OB).
Goal: Secure an entry now while lowering average cost if a dip occurs.
Model 2: The "Breakout" Approach (Conservative Momentum)
Strategy: Wait for confirmation.
Logic: The Red Zone is currently acting as resistance. Buying right into resistance is risky if it rejects.
Execution: Wait for a solid 4H candle close ABOVE the Red Zone (above 0.0915).
Goal: You sacrifice a deeper entry price for a higher probability of success. Momentum is confirmed once this level breaks.
Model 3: The "Sniper" Approach (Best Risk-to-Reward)
Strategy: Limit orders at Support.
Logic: Buying at support gives the tightest stop loss and biggest potential gain (High R:R).
Execution: Set buy orders strictly at the Yellow Zone (~0.0790). If price doesn't dip that low, you miss the trade, but you also take zero risk.
Goal: Maximizing profit margins by catching the absolute bottom of the structure.
Summary
Trend: Neutral-Bullish (Consolidation). Action: Choose your Model (CMP, Breakout, or Dip). Invalidation: A daily close below the white support trendline invalidates the bullish structure.
Disclaimer: This analysis by Mubite is for educational purposes only and does not constitute financial advice. Always manage your risk.
Which Model are you choosing? 1, 2, or 3? Let us know in the comments!
MINAUSDT.PAfter breaking out of the falling channel, a move
was observed that swept order block (OB)
liquidity. The N-shaped rising wave formed below the channel’s
upper support, with a high
probability of continuation to the upside,
supported by factors such as Tether dominance
(USDT.D) adjustment.
MINA/USDT — Market StructureMINA remains in a persistent downtrend.
A large amount of supply has been distributed from $0.20 and above.
Until price breaks and holds above this range, medium-term long positions are not justified.
🎯 A bounce can only be taken after a clear reversal setup forms — and there is none yet.
Also worth noting: weekly RSI is approaching oversold levels.
The 31–33 zone has historically produced bounces.
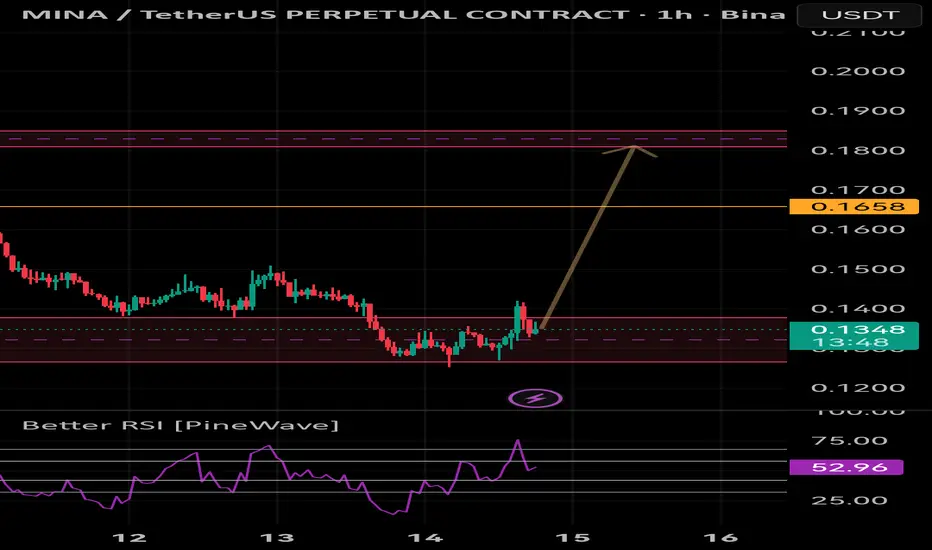
MINAUSDT 1D#MINA is trading above the daily SMA50 and continues to defend the key support zone. As long as MINA stays positioned over this level, the market structure leans bullish and the chart keeps room for a steady upward push toward the next resistance levels:
🎯 $0.1675
🎯 $0.1813
🎯 $0.1951
🎯 $0.2148
🎯 $0.2399
🎯 $0.2718
🎯 $0.2884
❌ Invalidation: If two consecutive daily candles close below the support zone, the setup loses strength.
⚠️ Maintain strict risk management and always use a protective stop-loss.
MINAUSDT Forming Bullish MomentumMINA/USDT is showing clear signs of bullish momentum, and the fundamentals strongly support a longer-term uptrend. The protocol is unique: it’s one of the lightest blockchains in the industry thanks to its use of recursive zk-SNARKs, meaning every node only needs to store a very small proof to verify the entire network. This architecture gives Mina a real scalability and decentralization edge — full participation without huge hardware demands.
Recently, Mina completed a major upgrade that unlocked full zk-app programmability. This means developers can now build and deploy zero-knowledge smart contracts (zkApps) on Mina’s mainnet, using off-chain execution while only submitting proofs on-chain. That’s a powerful paradigm shift: smart contracts become more scalable, private, and efficient. The roadmap for 2025 is also very aggressive, with o1Labs pushing hard on developer tooling like o1js, and the protocol targeting interoperability, new proof types, and a significantly deeper zk ecosystem.
On the institutional side, Mina is gaining traction: it recently secured support for institutional custody and staking via Cupper, which could unlock greater capital inflow. ( ) Meanwhile, on-chain activity appears to be ramping up, and more developers are building zkApps across voting, digital identity, gaming, and other verticals. ( )
Technical Analysis – Based on Daily Candle Closes MINA/USTD - D1After forming a bottom at 0.0898, MINA started a corrective upward structure.
Most important recent signal:
👉 Daily candles continue to close ABOVE the ascending trendline.
This keeps the bullish structure intact.
🔹 Fibonacci Levels (Based on Chart):
0.786 Fib → 0.1235 (support)
0.618 Fib → 0.1500 (resistance)
0.5 Fib → 0.1686
0.382 → 0.1872
0.236 → 0.2102
No daily close below 0.1235 = support remains valid.
🟢 BULLISH SCENARIO – Daily Close Required
Long Entries:
0.1290 – trendline reaction
Daily close above 0.1370 → first bullish signal
Daily close above 0.1500 → strong continuation
TP Targets:
TP1 → 0.1500
TP2 → 0.1686
TP3 → 0.1872
TP4 → 0.2102
STOP-LOSS:
👉 Daily close below 0.1235 = Long invalid
🔴 BEARISH SCENARIO – Daily Close Required
Short Entry:
Daily close below 0.1235
TP Targets:
TP1 → 0.1140 – 0.1180
TP2 → 0.1000
TP3 → 0.0898
STOP-LOSS:
👉 Daily close above 0.1290
📌 CONCLUSION:
MINA is at a critical decision zone.
Holding above 0.1235 keeps the bullish structure intact, but confirmation requires daily closes above 0.1370 and 0.1500.
Bearish confirmation requires a daily close below 0.1235.
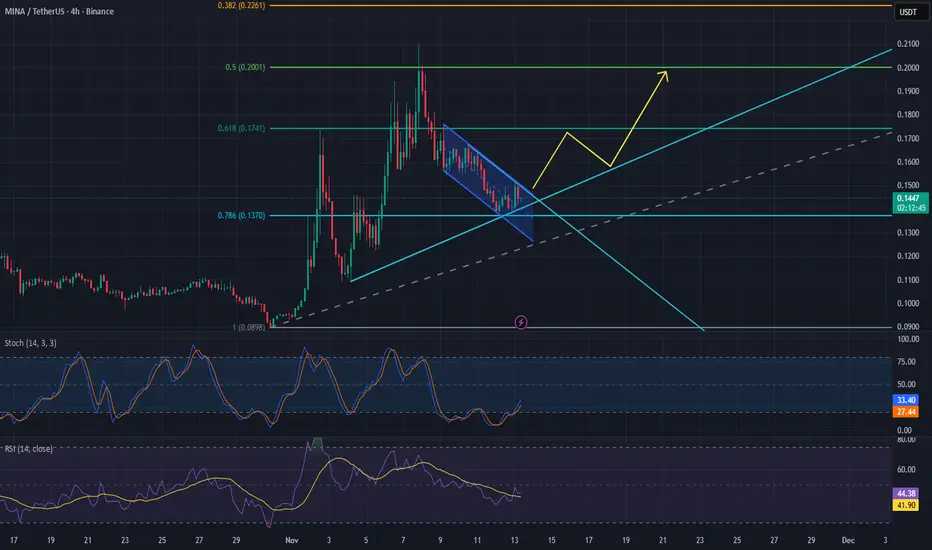
MINA/USDT – Bullish Breakout Setup (4H Chart)MINA is currently trading around the 0.144–0.145 USDT area, showing signs of a potential breakout from a descending channel after a healthy correction from the recent high.
Key highlights:
Fibonacci retracement from 0.0898 → 0.2098 shows price holding above the 0.786 (0.1370) support level.
Price is attempting to break above the descending channel, aligning with a possible trendline retest.
RSI and Stochastic RSI are both recovering from oversold zones, suggesting building bullish momentum.
A confirmed breakout could push MINA towards 0.165 (Fib 0.618) and then 0.20 (Fib 0.5) as the next resistance levels.
📈 Bullish scenario: Breakout and retest of the channel could trigger an upward continuation toward 0.165 → 0.200.
📉 Bearish scenario: Failure to hold above 0.137 could invalidate this setup and send price back to 0.120–0.118 support zone.
Idea: Watching for breakout confirmation above the channel for a potential long setup.
Timeframe: 4H
Trend bias: Neutral → Bullish
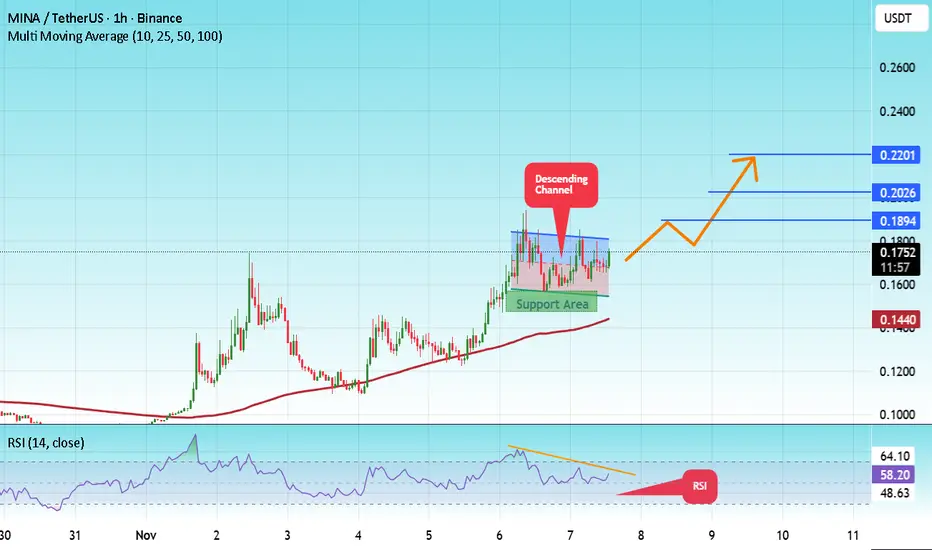
#MINA/USDT Bullish Impulse, New All-Time High Late 2025#MINA
The price is moving in a descending channel on the 1-hour timeframe and is expected to break out and continue upwards.
We have a trend to stabilize above the 100-period moving average again.
We have a downtrend on the RSI indicator, which supports an upward move if it breaks above it.
We have a key support zone in green that pushed the price higher at 0.1500.
Entry price: 0.1735
First target: 0.1894
Second target: 0.2026
Third target: 0.2115
For risk management, don't forget your stop-loss and money management.
The stop-loss is below the support zone in green.
Upon reaching the first target, take some profit and then change your stop-loss order to an entry order.
For any questions, please comment.
Thank you.
MINAUSDT Forming Falling WedgeMINAUSDT is forming a clear falling wedge pattern, a classic bullish reversal signal that often indicates an upcoming breakout. The price has been consolidating within a narrowing range around $0.163 USDT, suggesting that selling pressure is weakening while buyers are beginning to regain control. With consistent volume confirming accumulation at lower levels, the setup hints at a potential bullish breakout soon. The projected move could lead to an impressive gain of 140% to 150%+ once the price breaks above the wedge resistance, attracting searches for MINAUSDT price prediction.
This falling wedge pattern is typically seen at the end of downtrends or corrective phases, and it represents a potential shift in market sentiment from bearish to bullish. Traders closely watching MINAUSDT are noting the strengthening momentum as it nears a breakout zone near $0.17. The good trading volume adds confidence to this pattern, showing that market participants are positioning early in anticipation of a reversal in this zk-proof blockchain token.
Investors’ growing interest in MINAUSDT reflects rising confidence in the project’s long-term fundamentals and current technical strength, particularly with lightweight verification features for scalable dApps. If the breakout confirms with sustained volume, this could mark the start of a fresh bullish leg. Traders might find this a valuable setup for medium-term gains, especially as the wedge pattern completes and buying momentum accelerates in falling wedge breakout crypto plays.
✅ Show your support by hitting the like button and ✅ Leaving a comment below! (What is You opinion about this Coin) Your feedback and engagement keep me inspired to share more insightful market analysis with you!
MINAUSDT UPDATE#MINA
UPDATE
MINA Technical Setup
Pattern: Falling Wedge Pattern
Current Price: $0.563
Target Price: $1.13
Target % Gain: 100.93%
Technical Analysis: MINA is breaking out of a falling wedge pattern on the 1D chart, signaling a strong bullish reversal. The breakout is supported by growing volume and bullish momentum, confirming strength as price moves above key resistance.
Time Frame: 1D
Risk Management Tip: Always use proper risk management.
MINAUSDT Forming Bullish WaveMINAUSDT is currently showing strong bullish signs as it forms a bullish wavelling wedge pattern, which typically indicates a potential trend reversal and continuation of upward momentum. This pattern reflects consolidation within a narrowing range, suggesting that buyers are preparing for a breakout. The current structure hints that MINA may soon experience a surge in buying pressure as the wedge approaches its breakout zone. With volume remaining solid, the technical setup signals that traders and investors are positioning themselves for a significant move upward.
A confirmed breakout above the wedge resistance could trigger a powerful rally, aligning with the expected gain of 140% to 150%. The combination of steady volume, a strong technical pattern, and increasing interest from market participants provides a favorable environment for potential bullish momentum. Traders observing key resistance levels will likely look for confirmation before entering long positions, as MINA’s structure shows the potential to sustain upward movement once momentum builds.
The investor sentiment surrounding MINAUSDT continues to grow as this project gains more visibility in the market. The recent pattern formation combined with healthy accumulation points to confidence among both retail and institutional participants. If the bullish wave continues, this setup could mark the beginning of a major uptrend phase for MINA, making it an attractive pair to watch closely in the coming sessions.
✅ Show your support by hitting the like button and
✅ Leaving a comment below! (What is You opinion about this Coin)
Your feedback and engagement keep me inspired to share more insightful market analysis with you!
MINAUSDT 1D#MINA is moving inside a descending channel on the daily chart and has bounced off the midline of the channel. The short-term targets are:
🎯 $0.1192
🎯 $0.1335
In case of a breakout above the channel resistance and the daily SMA50, the potential targets are:
🎯 $0.1634
🎯 $0.2041
🎯 $0.2371
🎯 $0.2700
🎯 $0.3168
🎯 $0.3765
⚠️ Always remember to use a tight stop-loss and maintain proper risk management.