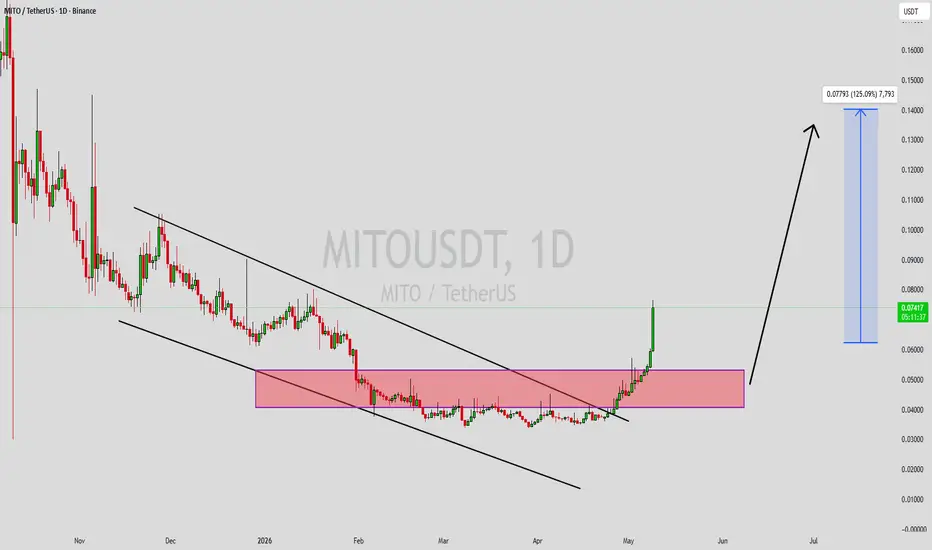
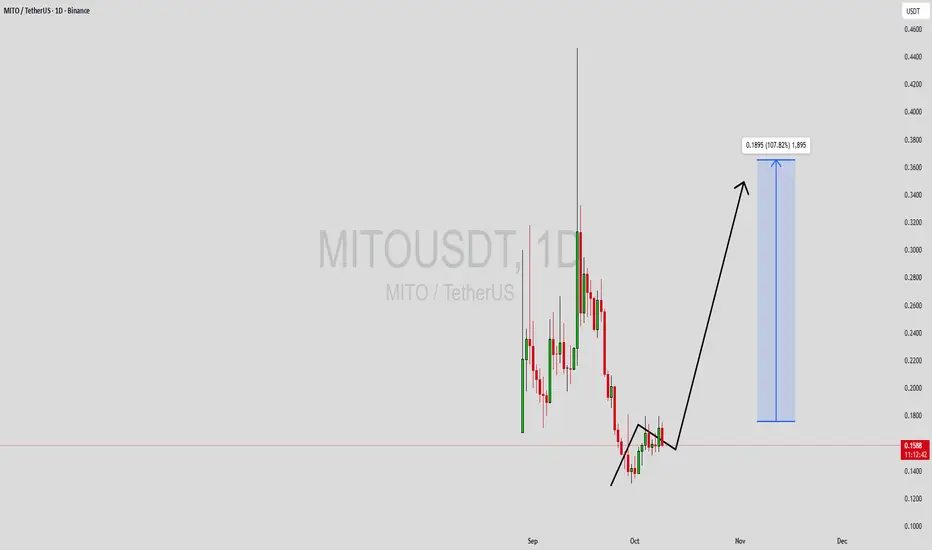
MITOUSDT Forming Falling WedgeMITOUSDT is forming a clear falling wedge pattern, a classic bullish wave signal that often indicates an upcoming breakout. The price has been consolidating within a narrowing range, suggesting that selling pressure is gradually weakening while buyers are beginning to regain control. With consistent trading volume confirming accumulation at lower levels, the current setup hints at a potential bullish breakout in the near future. The projected move could lead to an impressive gain of around 90% to 100% once the price breaks above the key wedge resistance.
This falling wedge pattern is typically seen at the end of downtrends or corrective phases, representing a potential shift in market sentiment from bearish to bullish. Traders closely watching MITOUSDT are noticing strengthening momentum as the price approaches a critical breakout zone. Strong trading volume adds confidence to this setup, showing that market participants are positioning early in anticipation of a sustained upward move.
Growing investor interest in MITOUSDT reflects increasing confidence in the project's long-term fundamentals and its improving technical outlook. If the breakout is confirmed with sustained buying volume, it could mark the beginning of a fresh bullish leg. The ongoing consolidation phase suggests steady accumulation, creating favorable conditions for a strong continuation rally once the resistance level is cleared.
Traders may find this an attractive medium-term opportunity, especially as the falling wedge pattern nears completion and buying pressure continues to build. A confirmed breakout could attract additional market participation and accelerate the move toward the projected upside target.
✅ Show your support by hitting the like button.
✅ Leaving a comment below! (What is You opinion about this Coin)
Your feedback and engagement keep me inspired to share more insightful market analysis with you!
In-depth trading ideas
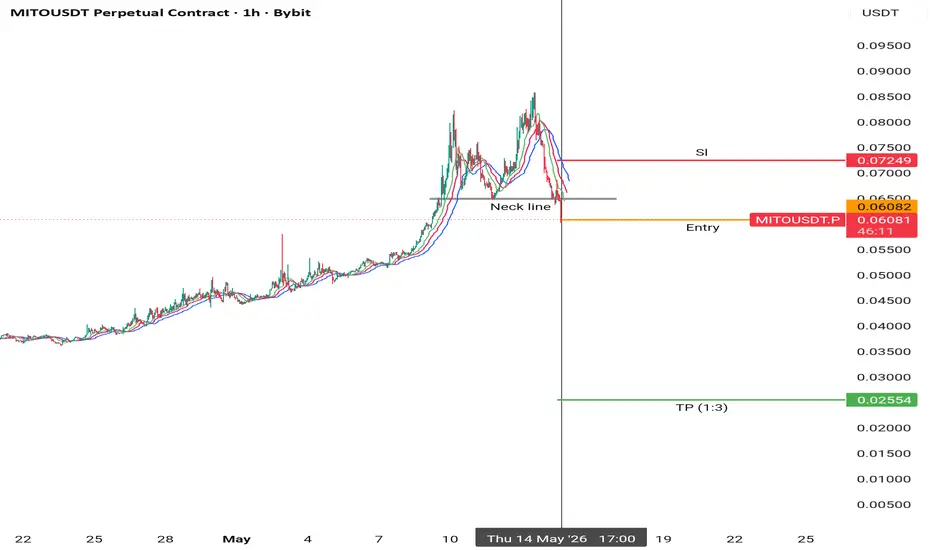
MITOUSDT: Bearish Breakdown Signals Further Downside RiskMITOUSDT has lost bullish momentum after a sharp rejection from recent highs, with sellers driving price back below a key support area. The formation of lower highs and continued selling pressure suggests bears remain in control, favoring a continuation of the current downtrend.
As long as 0.02385 holds as resistance, the bearish outlook remains intact. A rejection from the current zone could extend the decline toward 0.02224, while a decisive break above resistance would invalidate the setup and shift momentum back in favor of buyers.
Trade Setup
Entry: 0.02333
Target: 0.02224
Stop Loss: 0.02385
I'll be watching for continued weakness below resistance before expecting the next leg lower. If sellers maintain control, the bearish continuation scenario remains valid, while a sustained breakout above 0.02385 would invalidate the setup.
Mitosis breaks bullish —basic trading tips (PP: 350% - 600%)The first move is in. A very strong bullish breakout and the highest volume ever by far on this project on a single session.
It can happen that after this initial move we get a small pause before we see additional growth, just as it happened with MEGAUSDT. You see, the market never moves straight down but neither straight up.
What the current chart says though without a shadow of doubt is that the correction is over and from now on we should expect rising prices.
MITOUSDT is showing a very strong bullish cross on the MACD. The MACD is very slow to move so the signals here are very good. See the chart: A falling wedge pattern is present on the chart.
The RSI just turned bullish.
The stochastic entered bullish territory and so on. On this chart we see 350% - 600% profits potential in the coming months.
Patience is key to win with these things.
This is not financial advice, the market can always turn. Do your own research and if you have doubts, don't trade.
Only go in with full force when you feel certain. Reaching a state of certainty depends on how much information you have in relation to the market and how well prepared you are with your strategy.
Let's say you open a position and feel doubt right afterward, it means you didn't do your homework.
Let's say you open a position and produce a loss in a matter of days but you remain unmoved, it means you were prepared for all scenarios and aware of the risk.
There is never any hurry, there is no need to rush. Opportunities are endless in this and all markets; take your time before taking action. If you plan your trades, you are sure to do great.
I truly appreciated your continued support.
Thank you for reading.
Namaste.
MITOUSDT Forming Bullish MomentumMITOUSDT is forming a clear bullish momentum pattern, a classic bullish wave signal that often indicates an upcoming breakout. The price has been consolidating within a narrowing range, suggesting that selling pressure is weakening while buyers are beginning to regain control. With consistent volume confirming accumulation at lower levels, the setup hints at a potential bullish breakout soon. The projected move could lead to an impressive gain of around 90% to 100% once the price breaks above the wedge resistance.
This bullish momentum pattern is typically seen at the end of downtrends or corrective phases, and it represents a potential shift in market sentiment from bearish to bullish. Traders closely watching MITOUSDT are noting the strengthening momentum as it nears a breakout zone. The strong trading volume adds confidence to this pattern, showing that market participants may already be positioning early in anticipation of a reversal.
Investors’ growing interest in MITOUSDT reflects rising confidence in the project’s long-term fundamentals and current technical strength. If the breakout confirms with sustained volume, this could mark the start of a fresh bullish leg. Traders might find this a valuable setup for medium-term gains, especially as the momentum pattern completes and buying pressure accelerates.
✅ Show your support by hitting the like button and
✅ Leaving a comment below! (What is your opinion about this coin?)
Your feedback and engagement keep me inspired to share more insightful market analysis with you!
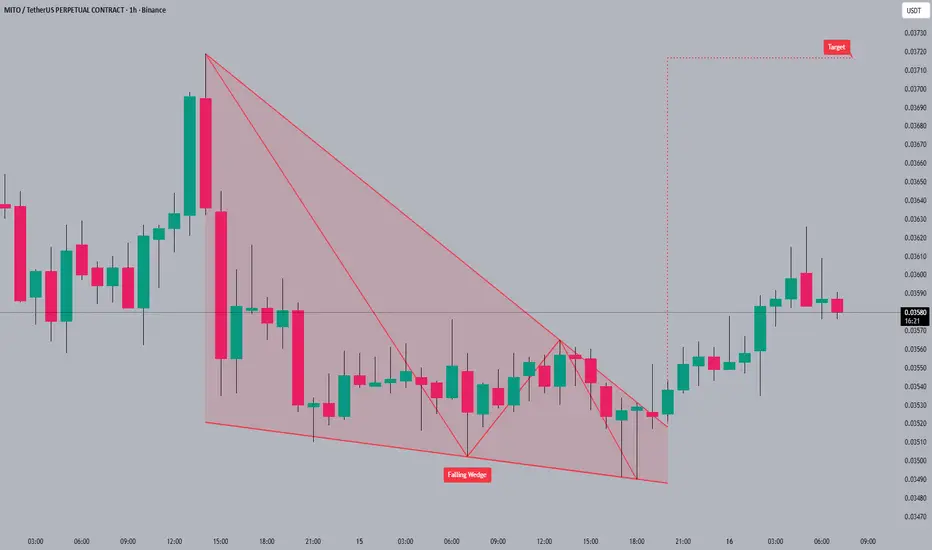
#MITO #MITO is currently consolidating near the 0.03585 level 🤔 after breaking out from a falling wedge pattern. The falling wedge suggests a potential bullish reversal 🚀, and the price action is now testing previous resistance. The next target for #MITO is around 0.03720, which aligns with the pattern's projected breakout target 🎯.
Market psychology can shift quickly after a breakout; be prepared for volatility 🎢.
#MITO #crypto #trading #altcoin
Mitosis, Bitcoin, Altcoins & Long-term Growth (PP: 1,672%)It can easily take five months for a bottom to form, for the process to be completed. Say, a major low is hit and only after five months the market settles and chooses a new trend.
Here we are looking at MITOUSDT (Mitosis) and the bottom process has been active for more than five months. MITOUSDT trading at the bottom has been active for two months but when it comes to the process it started in October 2025, six months ago.
The same range where MITO can be seen going sideways and accumulating is the same low from October 2025.
Everything is looking great and improving daily. Quiet is great. Boring is great. Sideways is great. It all starts from a neutral period like the one we are witnessing today.
Bitcoin stopped growing around July 2025, then it went sideways for months near resistance, challenging resistance before a major crash. The first drop wasn't the end of the bearish move but only the start. About 3 months near resistance before the correction got started.
There is a big difference between a correction and a full blown bearish cycle. In late 2025 and early 2026, we are most likely looking at just a correction when it comes to Bitcoin.
The bottom was hit February 2026 and we have two months sideways so far, no new lows. While it can take much longer for a new market cycle to fully unfold, a first jump wouldn't be the end, just the start.
Since we are looking at a correction, rather than a classic bearish cycle as we've seen in the past, bullish action can start at anytime. It is similar to 2023.
Why are the altcoins growing while Bitcoin is trading at support?
This is the confirmation that Bitcoin is now in the accumulation phase. The moment the market realized this, accumulation addresses became active and Bitcoin continues sideways. At the same time, many altcoins start to break up.
Shy bullish action, rising volume; all happening at the bottom but not bearish—MITOUSDT.
While bullish action is weak, or early, it is not bearish.
While we are not seeing here a wave with 300% up within a single day, we are seeing slow and steady growth, a recovery after the accumulation phase.
Any long wave would take months to develop, look at VVV for example, or TRX. Look at FETUSDT or DOGE, Cardano or Dusk. TAO.
While Gold continues to go down, oil goes up, Bitcoin and the altcoins are likely to grow. It is amazing how everything can change in a matter of days.
Change calls for bullish action, the market has been bearish for months, we are predicting the next market phase. Whatever is happening now, already reached its end. It can last a few more weeks, a few more days, but the next move is up—focus on the long-term.
Namaste.
#MITO has broken out of a falling wedge pattern #MITO has broken out of a falling wedge pattern and is consolidating above the breakout level. The falling wedge pattern suggests a potential trend reversal and bullish momentum . The next target for #MITO is around 0.04450 where we could see some resistance .
Trading patterns offer clues, but always confirm with volume and other indicators.
#MITO #crypto #trading #altcoin
MITOUSDT Forming Falling WedgeMITOUSDT is forming a clear falling wedge pattern, a classic bullish reversal signal that often indicates an upcoming breakout. The price has been consolidating within a narrowing range, suggesting that selling pressure is weakening while buyers are beginning to regain control. With consistent volume confirming accumulation at lower levels, the setup hints at a potential bullish breakout soon. The projected move could lead to an impressive gain of around 90% to 100% once the price breaks above the wedge resistance.
This falling wedge pattern is typically seen at the end of downtrends or corrective phases, and it represents a potential shift in market sentiment from bearish to bullish. Traders closely watching MITOUSDT are noting the strengthening momentum as it nears a breakout zone. The good trading volume adds confidence to this pattern, showing that market participants are positioning early in anticipation of a reversal.
Investors’ growing interest in MITOUSDT reflects rising confidence in the project’s long-term fundamentals and current technical strength. If the breakout confirms with sustained volume, this could mark the start of a fresh bullish leg. Traders might find this a valuable setup for medium-term gains, especially as the wedge pattern completes and buying momentum accelerates.
✅ Show your support by hitting the like button and
✅ Leaving a comment below! (What is your opinion about this Coin?)
Your feedback and engagement keep me inspired to share more insightful market analysis with you!
MITO Buy/Long Setup (3H)Be sure to manage your risk carefully; this coin is new and has high volatility.
Good cleanups are visible on the chart, and the price is currently moving within a range between the swing highs and swing lows.
If the price reaches the green zone, we can look for buy/long positions. Note that this setup is intended for buy/long positions, not for sell/short trades.
The targets are marked on the chart.
A 3-hour candle close below the invalidation level will invalidate this analysis.
For risk management, please don't forget stop loss and capital management
When we reach the first target, save some profit and then change the stop to entry
Comment if you have any questions
Thank You
MITO New Update (1H)This analysis is an update of the analysis you see in the "Related publications" section
Be sure to manage your risk carefully; this coin is new and has high volatility
We have changed our view on this coin; it hasn’t reached our analysis entry zone yet!
Since it didn’t touch our zone and moved upward, forming and breaking out of a trendline, we’ve updated our perspective.
If there’s a pullback to the red zone, a sell/short position can be considered.
For risk management, please don't forget stop loss and capital management
When we reach the first target, save some profit and then change the stop to entry
Comment if you have any questions
Thank You
MITO is ready to repeat the achievements of STOStarting this weekend, the probability of new waves of growth in alcoins is growing, and I want to consider the situation with the coins that I keep in mind for work.
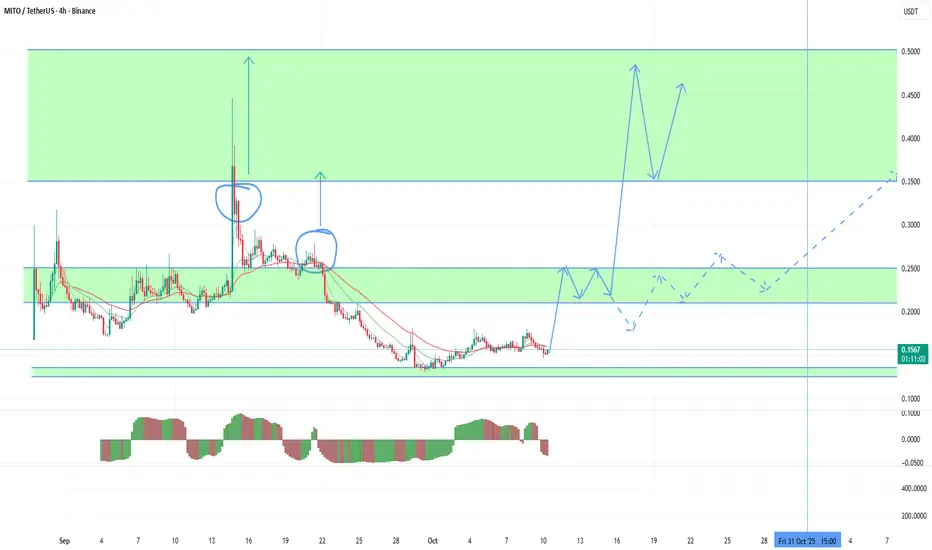
First of all, I will consider more reliable options for working in the mid-range, where you can hold a position from current levels and top up in case of a test of lower support in a falling market, such as the MITO VIC HOOK BMT. In this review, I will pay attention to MITO, which can repeat the STO picture this month. With the current issue, the main support is the range of 0.125-35, below which a fall is possible only if ETH falls to 3500-3750, which will create a good opportunity for additional confident earnings. This week, the 4750 level was re-broken for ETH, which is a signal for a second attempt to break 5000. It is more likely that this attempt will be made as early as next month. However, reducing the threat of a further drop in ether is already giving rise to purchases on MITO. And so purchases can be kept from the current levels, as there has been a rebound from the main support. In an optimistic scenario, a sharp increase may begin as early as this weekend with the closing of the weekly bullish candle and the continuation of the trend in the new week. The immediate goal is to return to the resistance in the range of 0.21-25, after the rebidding, which will open the possibility for a test of 0.35-50. This range is the main target for current emissions. With the negative dynamics of ETH, there is a possibility of a decrease in growth rates. In this case, we can see a significant pullback from 0.25 with the continuation of the trend after the opening of a new monthly candle above 0.21.
Among the weak coins, PIVX proved to be the main option for working with the greatest growth potential. There was an open zone until the 0.35-50 test, however, the breakdown occurred against a rather negative opening of the quarter, which is highly likely to lead to sharp disruptions in growth. Also, this token is essentially a dummy and carries only speculative interest, being a potential contender for adding the monitoring and delisting tag. I will consider it back to work only after returning to the range 0.100-125. However, this weekend the trend may still hold against the background of the absence of further decline in ETH.
Among similar coins with weak dynamics, the probability of assigning the monitoring tag, but high undeveloped targets are chess with a probability of growth up to 100%+ from current levels and ADX FIO with a potential for growth up to 50%+ from current levels, but also an additional drawdown before rising to 20-25%.
ATM ACM CITY JUV fantokens have a similar growth potential to PIVX. However, it is worth bearing in mind the extremely low liquidity and long accumulation of these instruments when choosing a position size.
MITOUSDT Forming Bullish WaveMITOUSDT is showing a powerful Bullish Wave Pattern that reflects growing momentum and renewed confidence among traders. The recent price movements indicate a strong accumulation phase followed by a clear breakout, suggesting that buyers are in firm control of the market structure. This kind of setup often leads to explosive upward moves as momentum builds and liquidity increases around critical resistance levels.
The volume looks solid, confirming that this uptrend is supported by active market participation rather than short-term volatility. Technical indicators suggest that if the current bullish momentum continues, MITOUSDT could potentially deliver a **gain of 90% to 100%+** in the coming sessions. The coin’s chart structure is forming higher highs and higher lows, which is a classic confirmation of sustained bullish momentum in play.
Investor interest in this project has been steadily increasing, as many traders are identifying MITOUSDT as a potential outperformer in the current altcoin cycle. With the market showing signs of recovery and optimism returning to crypto, MITOUSDT could be one of the standout performers to watch closely in the near term.
✅ Show your support by hitting the like button and
✅ Leaving a comment below! (What is You opinion about this Coin)
Your feedback and engagement keep me inspired to share more insightful market analysis with you!
$MITO breakout confirmed!SEED_ALEXDRAYM_SHORTINTEREST2:MITO breakout confirmed!
Price has broken out of the falling channel on the 1H chart and is now retesting the breakout zone around $0.158–$0.160.
If this zone holds, a move toward $0.19 looks likely.
A drop below $0.155 would invalidate this setup.
DYOR, NFA
#Altseason2025
MITOUSDT Forming Bullish WaveMITOUSDT is currently forming a bullish wave pattern that suggests strong upward momentum in the coming days. The recent structure highlights a series of higher lows, indicating buyers are gradually stepping in with confidence. With volume remaining healthy, the setup points toward a potential breakout that could drive the price significantly higher.
The projected gain of 70% to 80%+ is well within reach if momentum continues to build around key resistance levels. Technical traders are closely monitoring this zone, as a decisive breakout could trigger a wave of fresh buying pressure. The bullish wave pattern often reflects sustained accumulation, signaling that the uptrend may extend further once confirmed.
Investor interest in MITOUSDT has been steadily increasing, which adds strength to the overall bullish case. As more traders recognize the developing pattern and the potential upside, liquidity inflows may accelerate the move. Keeping an eye on volume surges and breakout confirmations will be key for those looking to capitalize on this setup.
✅ Show your support by hitting the like button and
✅ Leaving a comment below! (What is You opinion about this Coin)
Your feedback and engagement keep me inspired to share more insightful market analysis with you!