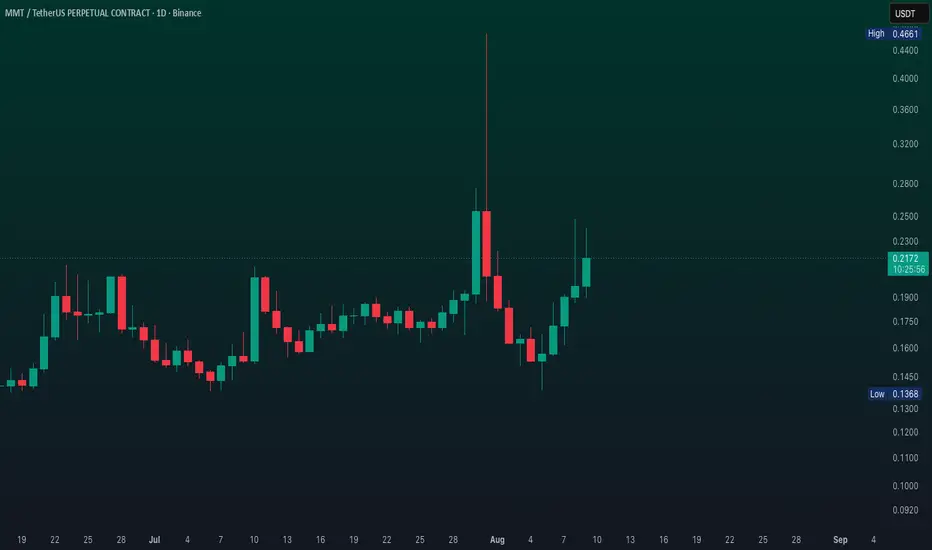
MMT Goes Live on BNB Smart ChainMomentum announced the deployment of its NYSE:MMT token on BNB Smart Chain, completed with full Binance exchange integration for deposits and withdrawals. This multi-chain move provides an additional operating environment alongside its original Sui foundation, simplifying user access and potentially broadening its market reach. This is a bullish development for MMT's utility and accessibility because it reduces friction for holders on the world's largest exchange and taps into the vast BNB Chain ecosystem. However, the project itself notes that increased availability does not guarantee adoption, making actual user engagement a key metric to watch. MMT's price jumped 24 hours, with trading volume spiking. The rally was directly triggered by a Binance spot trading tournament launched on August 6, offering a prize pool of 2,000,000 MMT in vouchers, which drove intense short-term speculative activity. This event is a clear example of exchange incentives creating volatile, high-volume price action. While it demonstrates liquidity and trader interest, the sustainability of gains is questionable as tournament-driven volume often fades, highlighting the risk of a sharp pullback once the promotional activity concludes. MMT's recent narrative is defined by strategic expansion onto BNB Chain and a volatile, exchange-fueled price spike. The key question now is whether the project can convert this short-term attention into sustained ecosystem growth and usage beyond promotional events.
In-depth trading ideas
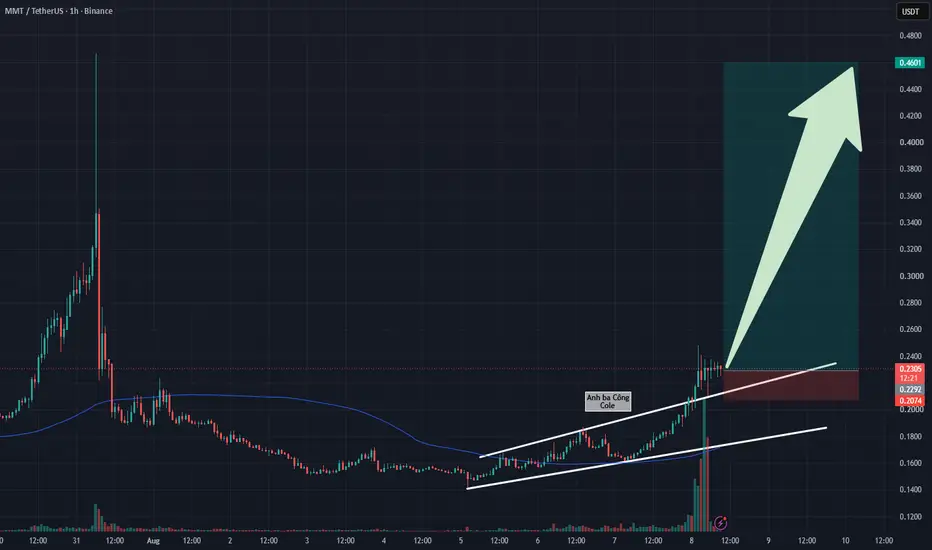
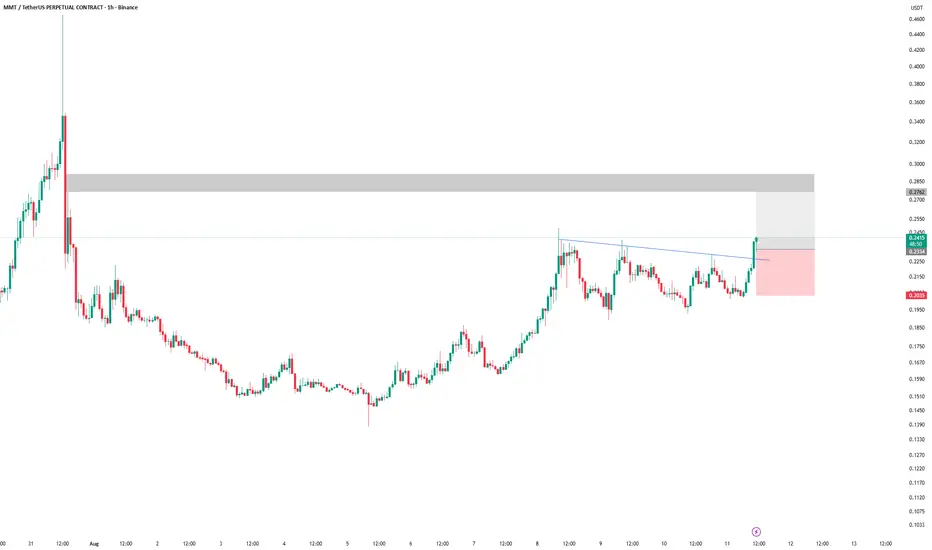
MMT: Successful Breakout Above Ascending ChannelMMT: Successful Breakout Above Ascending Channel – Long Wick Retest Confirms Bullish Expansion Toward $0.460 Peak
MMT has flashed a decisive bullish trend confirmation signal, officially shattering the upper boundary of its ascending parallel accumulation channel to unlock higher price targets. The 1-hour market structure is firmly established by a sequential series of higher highs and higher lows, with the price action maintaining a healthy distance above the dynamic MA100 trendline resistance.
Based on the visual data from the 1-hour chart , a major technical turning point materialized as price candles broke out decisively and executed a swift retest. The formation of a candle with an elongated lower wick directly testing the newly broken upper channel boundary demonstrates that buy-side liquidity immediately stepped in to absorb short-term profit-taking supply. This sharp lower-wick rejection confirms that former resistance has successfully flipped into a solid support launchpad.
This technical environment delivers a textbook trend-following Long execution opportunity. The optimal strategy is to initiate Long positions, establishing a tight stop-loss parameter directly beneath the broken upper channel line to ensure strict risk management. The primary take-profit objective for this expansion setup aims directly at the historic peak around the $0.460 handle.
Disclaimer: This is not financial advice, DYOR.
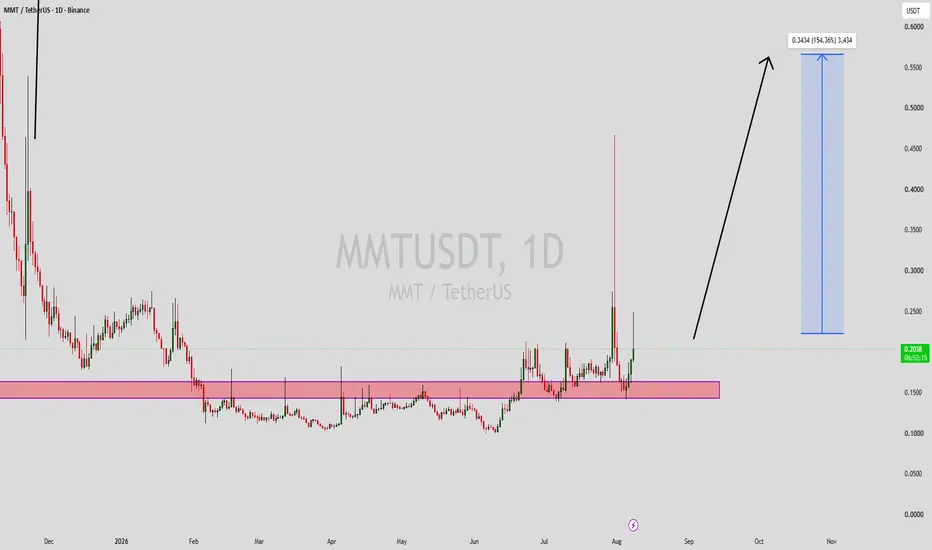
MMTUSDT Forming Bullish MomentumMMTUSDT is forming a clear bullish momentum pattern, a classic bullish wave signal that often indicates an upcoming breakout. The price has been consolidating within a narrowing range, suggesting that selling pressure is weakening while buyers are beginning to regain control. With consistent volume confirming accumulation at lower levels, the setup hints at a potential bullish breakout soon. The projected move could lead to an impressive gain of around 140% to 150% once the price breaks above the wedge resistance.
This bullish momentum pattern is typically seen at the end of downtrends or corrective phases, and it represents a potential shift in market sentiment from bearish to bullish. Traders closely watching MMTUSDT are noting the strengthening momentum as it nears a breakout zone. The healthy trading volume adds confidence to this pattern, showing that market participants are positioning early in anticipation of a reversal.
Investors’ growing interest in MMTUSDT reflects rising confidence in the project's long-term fundamentals and current technical strength. If the breakout confirms with sustained buying volume, this could mark the start of a fresh bullish leg. Traders might find this a valuable setup for medium-term gains, especially as the momentum pattern completes and buying pressure continues to accelerate.
✅ Show your support by hitting the like button and
✅ Leaving a comment below! (What is You opinion about this Coin)
Your feedback and engagement keep me inspired to share more insightful market analysis with you!
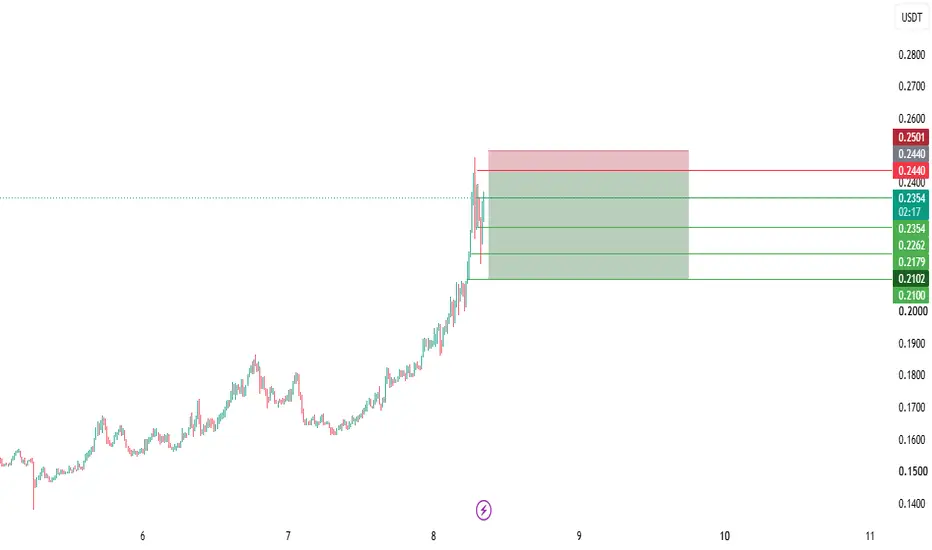
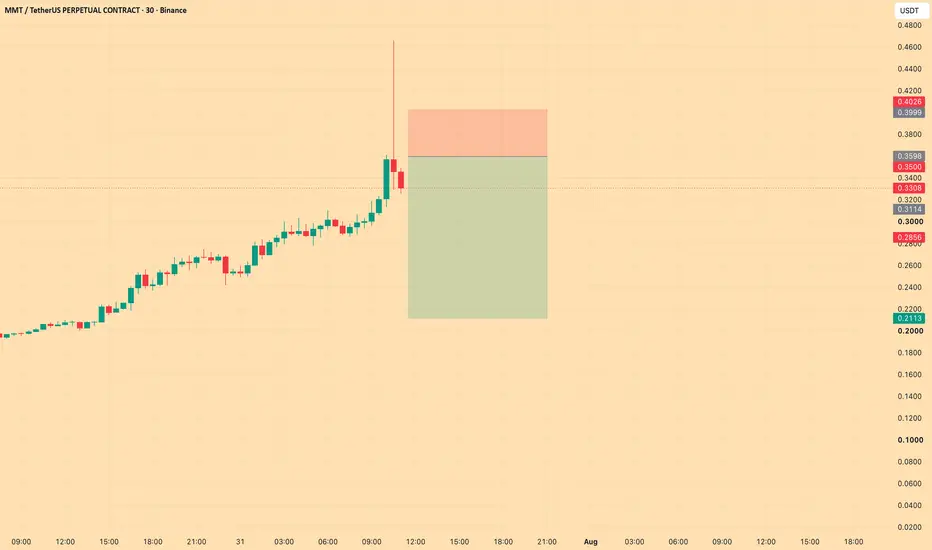
MMT USDT SHORT SIGNAL#26.MMT/USDT – Trade Setup (SHORT)
📈 Position Type: SHORT
🕒 Timeframe: 1H
📊 Market: Futures
💰 Entry Zone:
0.2395
0.2440
🛑 Stop-Loss:
0.2530
🎯 Take-Profit Targets:
• TP1: 0.2354
• TP2: 0.2262
• TP3: 0.2179
• TP4. 0.21
Tp5.
⚙️ Leverage:
5*10
▫️ After TP1, move SL to Entry + 0.2%.
▪️ Exit Plan:
• 40% at TP1
• 20% at TP2
• 20% at TP3
20% at TP4
📌 Risk Management:
Risk only 1–2% of your capital per trade.
⚠️ Always check and confirm the setup on your chart before entering the trade.
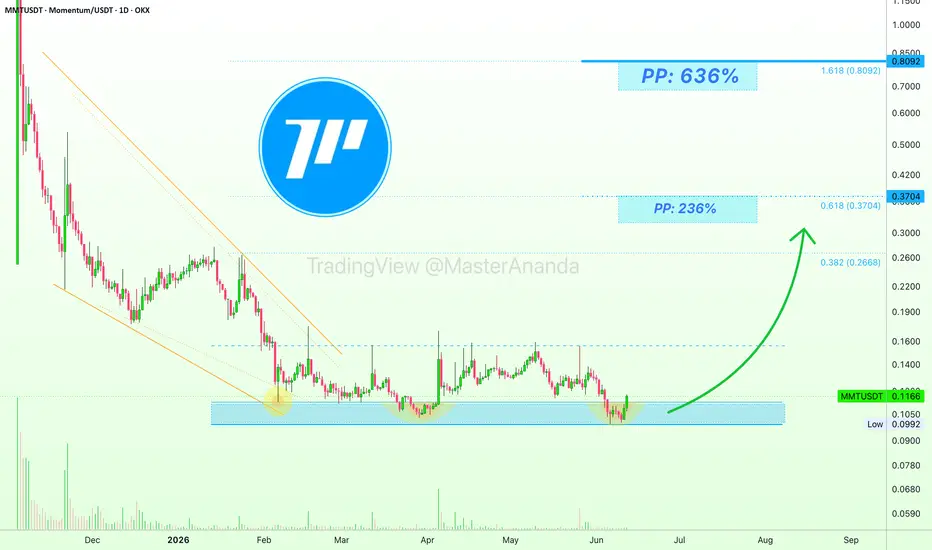
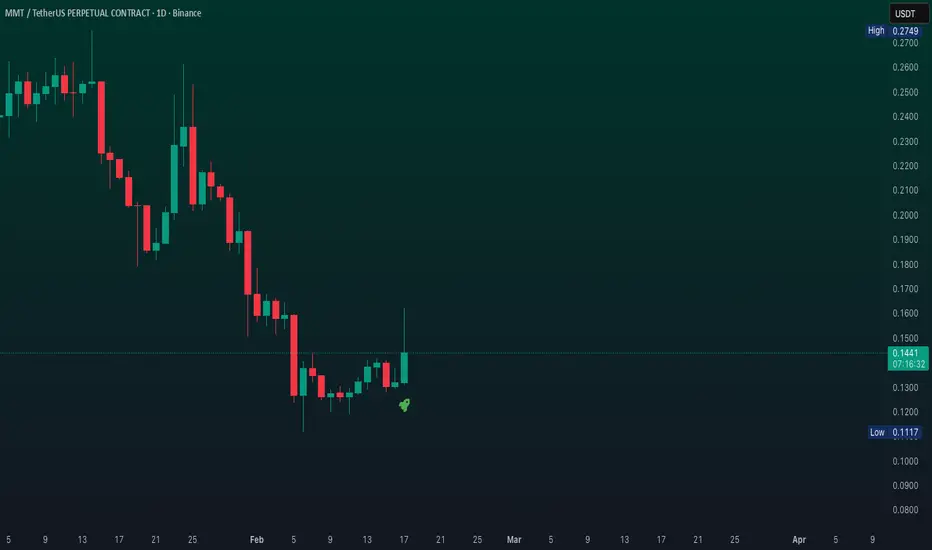
Momentum (MMT): Triple Support Challenge turns Bullish—PP: 636%Here we have a triple challenge of support in four months, February, March & June. MMTUSDT (Momentum) is now moving back within the bullish zone where bullish potential becomes maximized. Low risk vs a high potential for reward.
Here a bullish wave is not a hard development. It is easy and can follow next. Clearly 100% sideways with no breakdown. Clearly 100% sideways with a bullish breakout leading to the establishment of an uptrend, because support continues to hold. The absence of sellers confirms a bullish setup. When buyers show up it will produce instant growth. Fast growth on the first jump, we've seen it before.
The RSI and STOCH on the daily timeframe support bullish action, together with the chart pattern, structure and candles. In this sense, everything points up. This is the chart setup with huge potential for growth. The targets can be hit short- to mid-term.
Thank you for reading.
Namaste.
MMTUSDT Breaking Key Resistance | Breakout or Bull Trap?📊 Technical Analysis
💵🪙 Coin: NYSE:MMT #MMT
⏳🕒 Time Frame: 2D
📉📐 Pattern: Horizontal Resistance Breakout / Rounded Bottom Accumulation
🎯📈 Market Structure: Bullish Reversal Attempt
━━━━━━━━━━━━━━━━━━━━
🔍📖 Pattern Explanation
🟢🌙 Rounded Bottom Formation
📌 The chart shows that MMT experienced a prolonged downtrend, followed by several months of sideways consolidation before beginning to form Higher Lows, indicating that selling pressure is gradually weakening.
💪 Buyers are slowly taking control of the market and building fresh bullish momentum.
📈 This structure is commonly known as a Rounded Bottom or Accumulation Phase, a classic reversal pattern that often marks the transition from a bearish trend to a bullish trend.
🚀 At the moment, the price is testing and slightly breaking above the major resistance around $0.26, which has rejected price multiple times in the past.
✅ If this breakout is successfully confirmed, the probability of a strong continuation rally will increase significantly.
━━━━━━━━━━━━━━━━━━━━
🟢🚀 Bullish Scenario (Probability: ~70%)
✅ 📈 Price successfully closes above the $0.26 resistance on the 2D timeframe.
✅ 🔄 The previous resistance flips into new support (Successful Retest).
✅ 📊 Trading volume increases during the breakout.
✅ 📈 Buyers maintain momentum, allowing the market to form a new Higher High.
🔥 If all of these conditions are met, MMT could continue its rally toward the next major resistance levels.
🎯 Potential Targets
🎯 🚀 $0.35
🎯 🚀 $0.45
🎯 🚀 $0.65
🎯 🚀 $0.90
🌕 If Bitcoin and the overall altcoin market remain strong, MMT could extend its rally even further.
━━━━━━━━━━━━━━━━━━━━
🔴⚠️ Bearish Scenario (Probability: ~30%)
❌ Price fails to hold above the resistance.
📉 The candle closes back below the breakout level.
🕯️ A strong rejection appears with a Long Upper Wick.
📊 Breakout volume remains relatively low, reducing the breakout's reliability.
⚠️ If these conditions occur, the breakout may turn into a Bull Trap (Fake Breakout).
🛡️ Key Support Levels to Watch
🛡️ $0.22
🛡️ $0.18
🛡️ $0.15
📌 As long as these support levels remain intact, the medium-term bullish structure is still considered valid.
━━━━━━━━━━━━━━━━━━━━
📌📝 Conclusion
🔥 MMT is currently at one of its most important technical moments after completing a lengthy accumulation phase.
🚀 A confirmed breakout above the major resistance could mark the beginning of a new bullish trend.
📊 Volume confirmation and candle close will be the key factors in determining whether this breakout is genuine or simply a Bull Trap.
👀 The most critical level to monitor is $0.26.
If this level successfully holds as new support, the probability of a sustained bullish continuation will increase significantly.
━━━━━━━━━━━━━━━━━━━━
📢📋 Trading Plan
🟢 📈 Bias: Bullish as long as the price remains above the breakout level.
✅ 📊 Main Confirmation: A 2D candle close above resistance accompanied by increasing trading volume.
👀 🎯 Most Important Level to Watch: $0.26
━━━━━━━━━━━━━━━━━━━━
#MMT #MMTUSDT #Crypto 🚀 #Cryptocurrency 💰 #Altcoins 🌕 #TradingView 📊 #TechnicalAnalysis 📈 #CryptoTrading 💹 #PriceAction 📉 #Breakout 🔥 #RoundedBottom 🟢 #Accumulation 📦 #Bullish 🐂 #BullTrap ⚠️ #Support 🛡️ #Resistance 🚧 #TradingSignals 📢 #AltcoinSeason 🌕
Technical Breakdown – MMTUSDTHey there how you doing guys?
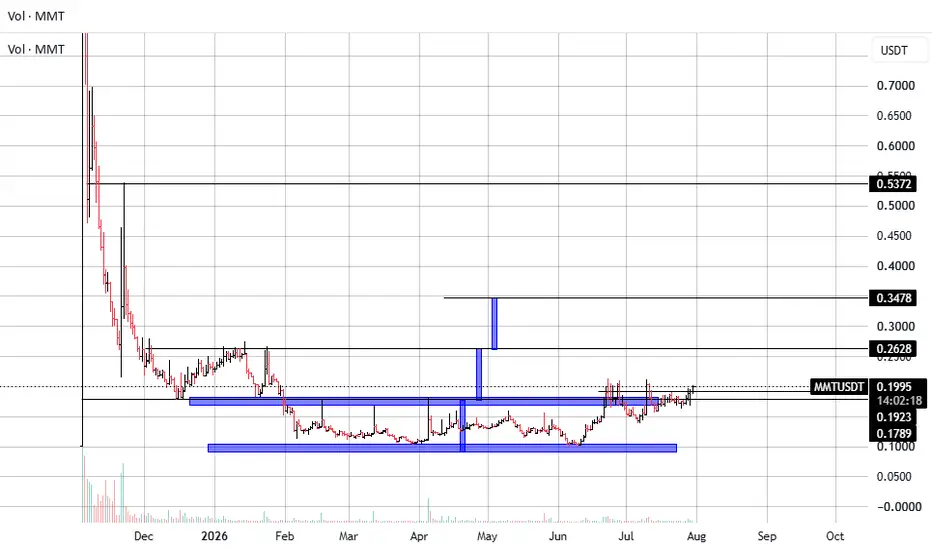
MMT is showing a long-term accumulation structure after a prolonged decline from its initial listing highs. The chart suggests that the market has been building a broad base between approximately $0.10 and $0.20, with price now attempting to establish itself above the upper boundary of that range.
The recent price action is particularly interesting because MMT has reclaimed the $0.19–0.20 resistance area and is currently consolidating around $0.20. This is an important structural level: holding it would transform the previous resistance into potential support.
Key Technical Levels:
Major support: ~$0.10–0.12
Primary breakout zone: ~$0.19–0.20
Current price: ~$0.20
Target 1: ~$0.263
Target 2: ~$0.348
Major macro target: ~$0.537
Bullish Scenario
The key confirmation is a sustained breakout and acceptance above $0.20.
If MMT can hold this area and build a new higher-low structure above it, the chart opens a relatively clear path toward $0.263. A decisive break above that level would then expose $0.348, followed by the major resistance around $0.537.
The projected structure is particularly interesting because the targets are not random extensions: they correspond to significant historical price areas and previous structural levels.
Market Structure
Long-term downtrend appears to have transitioned into base formation / accumulation.
The $0.10–0.12 zone has acted as strong structural support.
Price has repeatedly tested the $0.19–0.20 area, making this the key level to monitor.
A successful breakout would establish a new higher-high relative to the entire accumulation structure.
The large historical volume spike shows that MMT experienced significant initial market participation, while the subsequent decline created a long period of price discovery and consolidation.
What I Would Watch
The most important thing now is not simply the move above $0.20, but whether MMT can hold it.
A clean breakout → consolidation above $0.20 → continuation would be the strongest setup.
Conversely, a rejection followed by a loss of $0.19/$0.20 would suggest that the breakout has not yet been fully confirmed and could send price back toward the lower part of the range.
Overall: MMT is at a potentially important inflection point. If the $0.20 area becomes support, the chart offers a clear technical roadmap toward $0.263 → $0.348 → $0.537, representing a transition from a long accumulation phase into a potential new expansion cycle.
have an amazing trading day!!
MMTUSDT Forming Falling WedgeMMTUSDT is forming a clear falling wedge pattern, a classic bullish wave signal that often indicates an upcoming breakout. The price has been consolidating within a narrowing range, suggesting that selling pressure is weakening while buyers are beginning to regain control. With consistent volume confirming accumulation at lower levels, the setup hints at a potential bullish breakout soon. The projected move could lead to an impressive gain of around 40% to 50% once the price breaks above the wedge resistance.
This falling wedge pattern is typically seen at the end of downtrends or corrective phases, and it represents a potential shift in market sentiment from bearish to bullish. Traders closely watching MMTUSDT are noting the strengthening momentum as it nears a breakout zone. The strong trading volume adds confidence to this pattern, showing that market participants are positioning early in anticipation of a reversal.
Investors’ growing interest in MMTUSDT reflects rising confidence in the project's long-term fundamentals and current technical strength. If the breakout confirms with sustained volume, this could mark the start of a fresh bullish leg. The current market structure suggests that buyers are gradually taking control while bearish momentum continues to weaken.
Traders might find this a valuable setup for medium-term gains, especially as the falling wedge pattern completes and buying momentum accelerates. A confirmed breakout could attract additional market participation and potentially push the price toward significantly higher levels in the coming weeks.
✅ Show your support by hitting the like button!
✅ Leave a comment below! (What is your opinion about this coin?)
Your feedback and engagement keep me inspired to share more insightful market analysis with you!
MMTUSDT Forming Falling WedgeMMTUSDT is forming a clear falling wedge pattern, a classic bullish wave signal that often indicates an upcoming breakout. The price has been consolidating within a narrowing range, suggesting that selling pressure is weakening while buyers are beginning to regain control. With consistent volume confirming accumulation at lower levels, the setup hints at a potential bullish breakout soon. The projected move could lead to an impressive gain of around 60% to 70% once the price breaks above the wedge resistance.
This falling wedge pattern is typically seen at the end of downtrends or corrective phases, and it represents a potential shift in market sentiment from bearish to bullish. Traders closely watching MMTUSDT are noting the strengthening momentum as it nears a breakout zone. The healthy trading volume adds confidence to this pattern, showing that market participants are positioning early in anticipation of a reversal.
Investors’ growing interest in MMTUSDT reflects rising confidence in the project's long-term fundamentals and current technical strength. If the breakout confirms with sustained volume, this could mark the beginning of a fresh bullish leg. Traders may find this setup attractive for medium-term opportunities, especially as the falling wedge pattern approaches completion and buying momentum continues to build.
✅ Show your support by hitting the like button!
✅ Leave a comment below! (What is your opinion about this coin?)
Your feedback and engagement keep me motivated to share more insightful market analysis with you!
MMT:USDT CAN HAVE A GOLDEN TREND📊 MOMENTUM/USDT – Update
MOMENTUM is showing renewed strength after defending the key support zone and beginning to build momentum from the recent base structure. The current setup suggests a potential continuation move if buyers maintain control and trend confirmation follows.
🎯 TP 1: 0.1798
🚀 TP 2: Runner target open — allowing the trend to capture maximum upside potential.
👉 As long as price remains above support, the bullish scenario stays active.
This is our trading expectation and not financial advice — everything depends on confirmed trend continuation.
MMT:USDT CAN HAVE A GOLDEN TREND📊 MOMENTUM/USDT – Update
MOMENTUM is showing renewed strength after defending the key support zone and beginning to build momentum from the recent base structure. The current setup suggests a potential continuation move if buyers maintain control and trend confirmation follows.
🎯 TP 1: 0.1798
🚀 TP 2: Runner target open — allowing the trend to capture maximum upside potential.
👉 As long as price remains above support, the bullish scenario stays active.
This is our trading expectation and not financial advice — everything depends on confirmed trend continuation.
May 6, 2026 MMT. The time to go long has come.- Exchange: Bitget
- Instrument: BITGET:MMTUSDT
- Timeframe: Weekly
- Trade type: Buy stop order
- Price: 0.1380
- Take Profit: Open
- Stop Loss: 0.1284 (-6.90 %)
Idea: Long on a breakout above last week's high — bullish momentum continuation.
Entry: Buy stop above last week’s high.
Stop-loss: Below the low of the same candle. A pullback below this level invalidates the trade.
Take Profit: Trailing stop following the lows of new weekly candles.
This is not an individual investment recommendation.
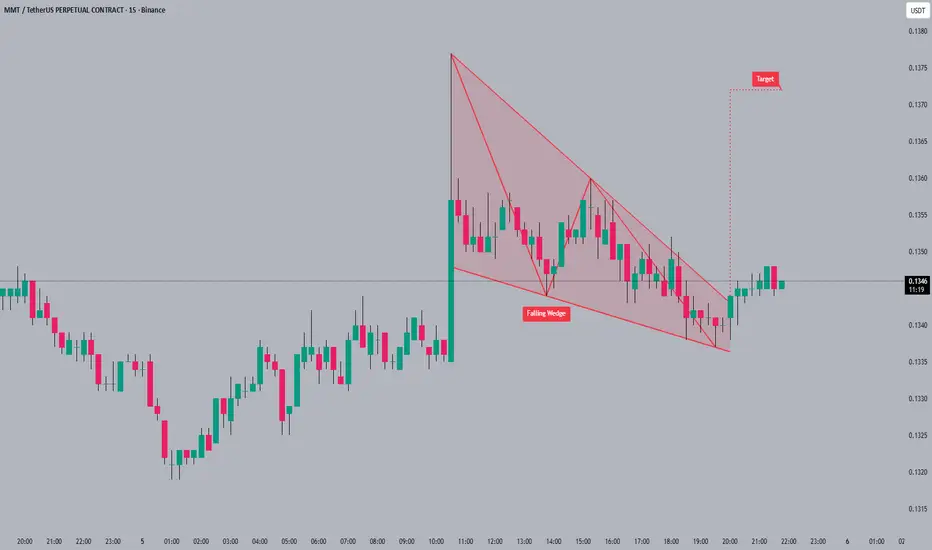
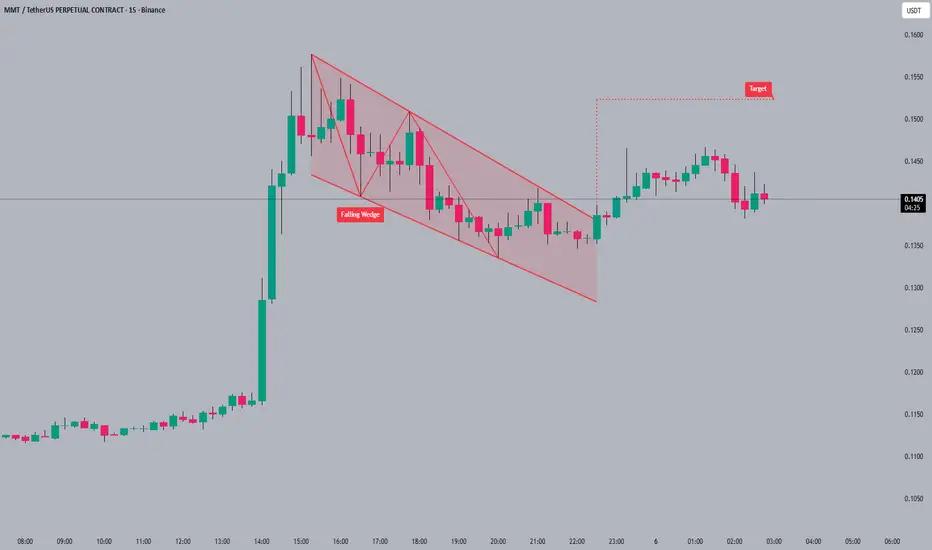
#MMT#MMT is currently consolidating after breaking out from a falling wedge pattern 🧐. The falling wedge suggests a potential trend reversal after a period of downward price action 📉. The next target is indicated at the top of the chart around 0.1550 🎯.
Trading breakouts require patience and confirmation to avoid false signals 💡.
#MMT #crypto #trading #altcoin
WHALES ACCUMULATING MMT | MASSIVE VOLUME🔥 Fortune AI Radar — NYSE:MMT
Fresh activity detected on NYSE:MMT today.
Data suggests increasing market interest & buyers stepping in.
Technicals currently lean bullish, with momentum trending upward.
Whales showing hints of accumulation and hype rising among trader
MMTUSDT Forming Falling WedgeMMTUSDT is forming a clear falling wedge pattern, a classic bullish reversal signal that often indicates an upcoming breakout. The price has been consolidating within a narrowing range, suggesting that selling pressure is weakening while buyers are beginning to regain control. With consistent volume confirming accumulation at lower levels, the setup hints at a potential bullish breakout soon. The projected move could lead to an impressive gain of around 290% to 300% once the price breaks above the wedge resistance.
This falling wedge pattern is typically seen at the end of downtrends or corrective phases, and it represents a potential shift in market sentiment from bearish to bullish. Traders closely watching MMTUSDT are noting the strengthening momentum as it nears a breakout zone. The good trading volume adds confidence to this pattern, showing that market participants are positioning early in anticipation of a reversal.
✅ Show your support by hitting the like button and
✅ Leaving a comment below! (What is your opinion about this Coin)
Your feedback and engagement keep me inspired to share more insightful market analysis with you!
MMTUSDT | 1 Condition for a PumpHello traders,
MMT broken below the ATL zone and price seems like its gaining some strength. On the 4H and 6H chart price has formed a double bottom and is now trying to break above structure.
The condition for a pump here is for BTC to gain some bullish performance.
My trade plan will be waiting a clear break & retest of this support zone. Only afterwards, I will take a long position here targeting pretty much anywhere between previous highs marked. That is based on everyone's risk appetite.
Good Luck!
Repeated Weakening Pumps — Expecting 0.25–0.30 Before DopThe chart shows a clear pattern: price delivers a pump every time, but each subsequent impulse is weaker than the previous one . Momentum is fading, and the structure suggests that buyers are losing strength with every attempt.
In the short term, I expect another local push into the $0.25–$0.30 zone , aligning with previous reaction levels. However, given the consistent decline in pump strength, this move may form just another lower high, followed by the start of a new downward leg 0.1$
MMTUSDT Forming Bullish WaveMMTUSDT is forming a clear bullish wave pattern on the daily and 4-hour charts, a powerful continuation signal that underscores surging momentum in the Sui DeFi ecosystem amid late 2025's altcoin volatility. The price has been advancing through a series of higher highs and higher lows around $0.40, reflecting strong buyer conviction following the recent 94% daily pump and buyback program launch that tightened supply dynamics. With good trading volume exploding to over $1 billion in the last 24 hours—dominated by Binance's MMT/USDT pair—the setup signals robust accumulation, as RSI surges past 70 and the wave structure aligns with Momentum's ve(3,3) governance incentives. The projected move could lead to an impressive gain of 290% to 300%+ once the price clears the $0.50 resistance, targeting explosive levels up to $1.60 in the midterm uptrend.
This bullish wave pattern typically unfolds during recovery phases or established uptrends, symbolizing a decisive pivot to optimistic sentiment as MMTUSDT rebounds from its October lows near $0.29. Traders closely watching MMTUSDT are highlighting the intensifying impulse waves driven by over 2.1 million users, $600 million TVL, and $26 billion in cumulative volume, which position Momentum as the Sui chain's premier liquidity hub. The good trading volume adds confidence to this pattern, demonstrating that market participants are piling in early ahead of further ecosystem expansions like cross-chain RWA trading and liquidity incentives.
Investors’ growing interest in MMTUSDT reflects rising confidence in the project’s long-term fundamentals, from the November 10 buyback initiative using DEX fees to the airdrop resolution deadline that could spark renewed FOMO. If the wave confirms with sustained volume on a push above $0.45, this could unleash the start of a massive bullish extension, bolstered by listings on Bitget and LBank. Traders might find this a valuable setup for medium-term gains, especially as the bullish wave matures and buying momentum propels toward $2+ in the 2025 DeFi surge.
✅ Show your support by hitting the like button and ✅ Leaving a comment below! (What is You opinion about this Coin) Your feedback and engagement keep me inspired to share more insightful market analysis with you!
MMT Analysis (2H)On the higher timeframes, we are in a large bearish structure, but on the lower timeframes the structure has turned bullish, and it is expected to continue moving until all the marked liquidity on the chart is collected. There is a strong pivot on the chart, and the probability of the price getting rejected from it is high.
The targets for this rejection are marked on the chart.
A 4-hour candle closing above the invalidation level will invalidate this analysis
Do not enter the position without capital management and stop setting
Comment if you have any questions
thank you
Scalp Long – MMT📈 Scalp Long – MMT
Price is holding at a strong support zone after completing a clean breakout and successful retest. Consecutive bullish divergences have appeared, signaling potential upward momentum.
🎯 Trade Setup:
Take Profit (TP): 0.491
Stop Loss (SL): 0.4074
Risk/Reward Ratio (RR): 1 : 2.7
A solid long setup supported by multiple bullish signals, confirmed breakout structure, and strong reaction at key support.