MOODENG at macro floor: base recovery toward $0.04379The Macro Picture 🗺️
MOODENG unwound from the $0.07020 macro ceiling all the way down and has flattened into a base just above the $0.03374 floor, now at $0.03456. The steep selling has given way to a sideways grind — exhaustion rather than continuation.
The Setup ⚙️
The Accumulation Zone 🟢
$0.03233–0.03456 is where the selling has dried up. Macro Support and the $0.03233 Local Low have both held on retest, and this is the demand shelf a recovery would build from.
The Decision Point 🔴
$0.04900 (Local High) is the structural gate. Before it, the $0.04379 measured-move target is the first objective — reclaiming it proves buyers are stepping back in.
The Roadmap 🛣️
Hold the $0.03374 floor → recover toward $0.04379 as the first leg up. Invalidation is a clean daily close below $0.03233 — that voids the accumulation thesis.
This is a textbook DCA Accumulation Zone setup: scale in across the $0.03233–0.03456 band and let the base do the work.
#MOODENG #crypto #trading #TA #3Commas #DCA
In-depth trading ideas
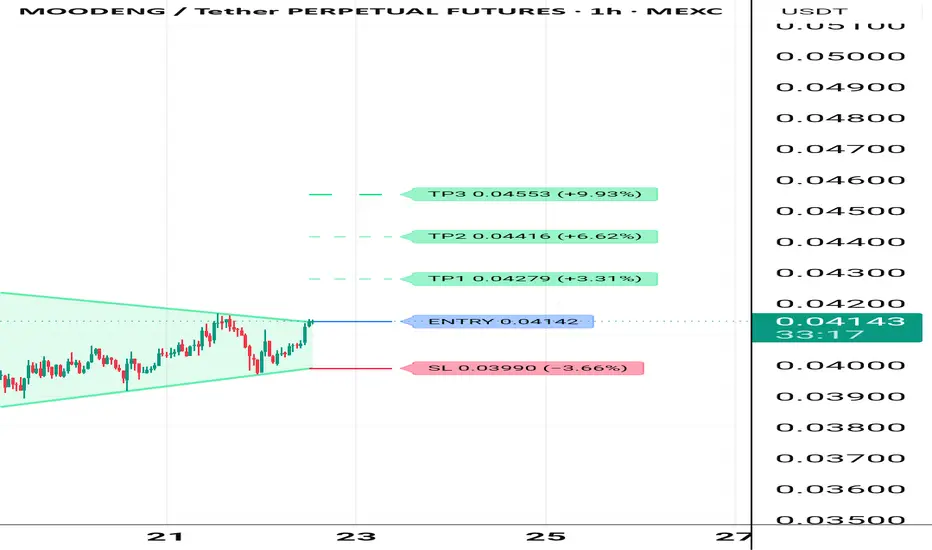
Moodengusdt long Roddy01-SIGNALSPROVIDER Instructions:
Entry point: yellow
Stop loss: red
Take profit: green
👉Leverage x 5-10-20 for crypto
👉Leverage x 20-50-100 for commodities, stocks, indices, and forex
👉Margin 1-5% max.
Always practice risk and money management.
Invest a maximum of 5% on any trade or across all your trades.
Invest only what you can afford to lose, as no one is in control of the market.
👉Our analyses are primarily based on:
breakouts: two trend lines (ascending and descending) and a line indicating a horizontal breakout.
chart patterns: shoulders and head, triangle parttern, elliott impulse, etc etc.
We don't always have the time to track them at all times or to represent them visibly, given the numerous signals, the number of channels to manage, and especially because of the often rapid pace of market movements.
indicators: We associate at least two indicators with this technique.
👉Depending on the circumstances, we use specific indicators, often setting 3 or more take profit levels.
👉Indeed, there are good days in trading and also bad days. No one can promise to win every trade, and like all traders worldwide, we also experience stop-loss orders. However, we win more than we lose and remain positive.
👉You can close the position before or after the take profit orders indicated by the green lines if you are personally satisfied; the same applies to stop loss orders.
👉We must stay positive, clear-headed, and humble.
we cannot provide all instructions or all trades here on this channel.
Good luck to us all, and may God guide us. Amen.
MOODENGUSDT - Demand Zone – Rebound or Breakdown?On this 2D chart, MOODENG/USDT is still trading within a Descending Channel that has been forming since its peak in mid-2025. This structure indicates that the medium- to long-term trend remains dominated by bearish pressure 📉, characterized by a consistent series of Lower Highs (LH) and Lower Lows (LL).
📍 The price is currently approaching a strong demand area highlighted by the yellow zone between $0.0275 and $0.0225. This area serves as a crucial support level, as it has previously acted as a significant reaction zone multiple times.
📌 Technically, the current price is trading near the lower boundary of the channel, creating the potential for a technical rebound if buyers step in and successfully defend this support area.
---
📉 Pattern Formation: Descending Channel
The primary pattern visible on this chart is a Descending Channel.
🔍 Pattern Characteristics:
✅ Price is moving between two parallel downward-sloping trendlines.
🔴 The upper trendline (red line) acts as dynamic resistance.
🟡 The lower trendline (yellow line) acts as dynamic support.
📉 As long as the price remains inside the channel, the primary trend remains bearish.
🚀 A breakout above the channel often signals the beginning of a stronger trend reversal.
📊 The chart shows multiple successful reactions from both the support and resistance boundaries, confirming the validity of the pattern.
---
🟢 Bullish Scenario
🚀 Scenario 1: Rebound from the Demand Zone
If the $0.0275 – $0.0225 demand zone is successfully defended by buyers:
🎯 Initial Target:
- $0.0450
🎯 Mid-Term Target:
- $0.0550
🎯 Main Target:
- $0.0650 – $0.0750
📈 These targets align with the channel resistance area, which currently serves as the upper boundary of price movement.
🚀 Scenario 2: Descending Channel Breakout
If price breaks above the channel resistance and closes decisively above it:
🔥 The bearish structure may come to an end.
🚀 Bullish momentum could increase significantly.
💰 Potential upside targets:
- $0.0900
- $0.1200
- $0.1500+
📊 The stronger the volume during the breakout, the higher the probability of a medium-term trend reversal.
---
🔴 Bearish Scenario
⚠️ The $0.0275 – $0.0225 area represents a critical final support zone.
If price loses this zone:
❌ The Descending Channel remains fully valid.
📉 Selling pressure may intensify.
🔻 Price could establish a new Lower Low.
🎯 Potential support levels below:
- $0.0200
- $0.0180
- $0.0150
⚠️ A breakdown below the demand zone would signal that sellers remain in control and that the downtrend is not yet complete.
---
🔍 Conclusion
📌 MOODENG/USDT is currently at a critical stage as price tests the major demand zone between $0.0275 and $0.0225, located near the lower boundary of the Descending Channel.
🟢 As long as this area holds, the possibility of a rebound toward the channel resistance remains open.
🔴 However, if support breaks, the risk of further downside increases and the bearish structure will continue to dominate.
⚖️ This demand zone can be viewed as a key decision point that may determine MOODENG's next major direction over the coming weeks and months.
💡 In other words, the current area represents a decision zone that could determine whether MOODENG begins a recovery phase or continues its long-term downtrend.
#MOODENG #MOODENGUSDT #Crypto #Altcoin #TradingView #TechnicalAnalysis #PriceAction #DescendingChannel #BullishReversal #BearishTrend #SupportAndResistance #CryptoTrading #ChartAnalysis #AltcoinSeason #MarketStructure #SwingTrading #Breakout #DemandZone #TrendAnalysis #CryptoMarket 🚀📈🔥
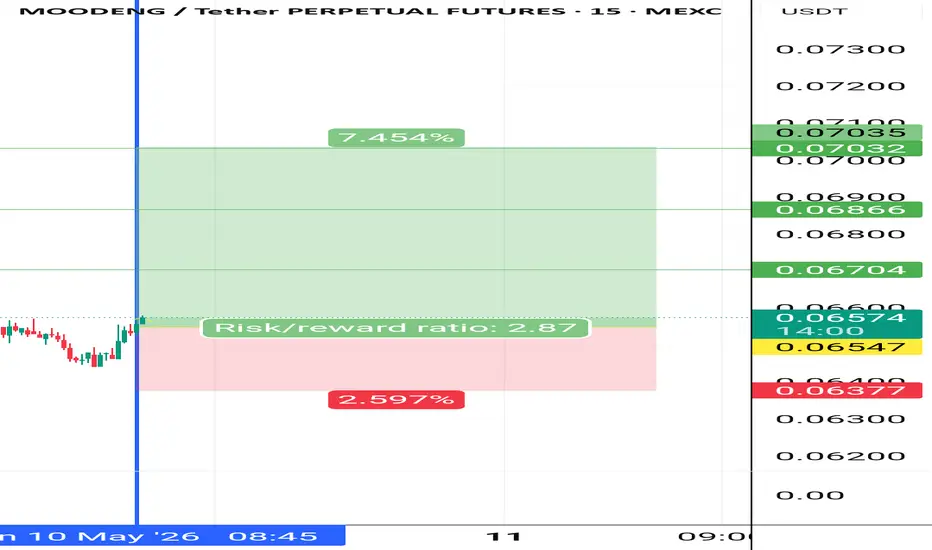
Moodengusdt long Instructions:
Entry point: yellow
Stop loss: red
Take profit: green
👉Leverage x 5-10-20 for crypto
👉Leverage x 20-50-100 for commodities, stocks, indices, and forex
👉Margin 1-5% max.
Always practice risk and money management.
Invest a maximum of 5% on any trade or across all your trades.
Invest only what you can afford to lose, as no one is in control of the market.
👉Our analyses are primarily based on:
breakouts: two trend lines (ascending and descending) and a line indicating a horizontal breakout.
chart patterns: shoulders and head, triangle parttern, elliott impulse, etc etc.
We don't always have the time to track them at all times or to represent them visibly, given the numerous signals, the number of channels to manage, and especially because of the often rapid pace of market movements.
indicators: We associate at least two indicators with this technique.
👉Depending on the circumstances, we use specific indicators, often setting 3 or more take profit levels.
👉Indeed, there are good days in trading and also bad days. No one can promise to win every trade, and like all traders worldwide, we also experience stop-loss orders. However, we win more than we lose and remain positive.
👉You can close the position before or after the take profit orders indicated by the green lines if you are personally satisfied; the same applies to stop loss orders.
👉We must stay positive, clear-headed, and humble.
we cannot provide all instructions or all trades here on this channel.
Good luck to us all, and may God guide us. Amen.
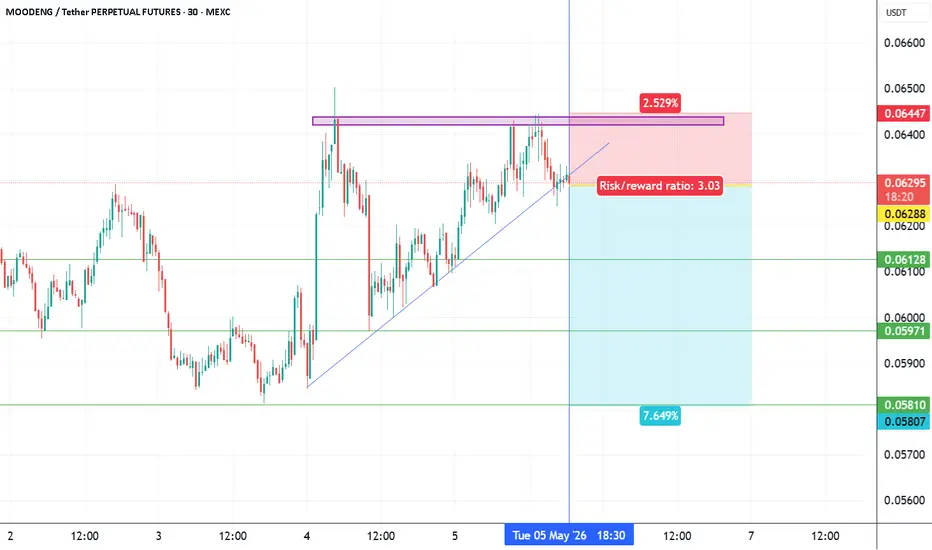
moodengusdt shortInstructions:
Entry point: yellow
Stop loss: red
Take profit: green
👉Leverage x 5-10-20 for crypto
👉Leverage x 20-50-100 for commodities, stocks, indices, and forex
👉Margin 1-5% max.
Always practice risk and money management.
Invest a maximum of 5% on any trade or across all your trades.
Invest only what you can afford to lose, as no one is in control of the market.
👉Our analyses are primarily based on:
breakouts: two trend lines (ascending and descending) and a line indicating a horizontal breakout.
chart patterns: shoulders and head, triangle parttern, elliott impulse, etc etc.
We don't always have the time to track them at all times or to represent them visibly, given the numerous signals, the number of channels to manage, and especially because of the often rapid pace of market movements.
indicators: We associate at least two indicators with this technique.
👉Depending on the circumstances, we use specific indicators, often setting 3 or more take profit levels.
👉Indeed, there are good days in trading and also bad days. No one can promise to win every trade, and like all traders worldwide, we also experience stop-loss orders. However, we win more than we lose and remain positive.
👉You can close the position before or after the take profit orders indicated by the green lines if you are personally satisfied; the same applies to stop loss orders.
👉We must stay positive, clear-headed, and humble.
we cannot provide all instructions or all trades here on this channel.
Good luck to us all, and may God guide us. Amen.
Moodengusdt long Instructions:
Entry point: yellow
Stop loss: red
Take profit: green
👉Leverage x 5-10-20 for crypto
👉Leverage x 20-50-100 for commodities, stocks, indices, and forex
👉Margin 1-5% max.
Always practice risk and money management.
Invest a maximum of 5% on any trade or across all your trades.
Invest only what you can afford to lose, as no one is in control of the market.
👉Our analyses are primarily based on:
breakouts: two trend lines (ascending and descending) and a line indicating a horizontal breakout.
chart patterns: shoulders and head, triangle parttern, elliott impulse, etc etc.
We don't always have the time to track them at all times or to represent them visibly, given the numerous signals, the number of channels to manage, and especially because of the often rapid pace of market movements.
indicators: We associate at least two indicators with this technique.
👉Depending on the circumstances, we use specific indicators, often setting 3 or more take profit levels.
👉Indeed, there are good days in trading and also bad days. No one can promise to win every trade, and like all traders worldwide, we also experience stop-loss orders. However, we win more than we lose and remain positive.
👉You can close the position before or after the take profit orders indicated by the green lines if you are personally satisfied; the same applies to stop loss orders.
👉We must stay positive, clear-headed, and humble.
we cannot provide all instructions or all trades here on this channel.
Good luck to us all, and may God guide us. Amen.
$MOODENG – Possible Retest to 0.050?OKX:MOODENGUSDT is back testing a pretty important area here after a solid push from the range lows. Price is now sitting right under key resistance, and this is where things get interesting.
Price is back again at its key resistance around the 0.060s, and it’s currently capping price here. If we continue to get rejected at this trendline, the local support we need to hold is 0.054. Lose that, and price will likely move directly into the 0.052–0.047s region.
For now, this trendline rejection is the main thing to watch — either we break through and expand higher, or we sweep back into demand for a healthier reset.
moodengusdt shortInstructions:
Entry point: yellow
Stop loss: red
Take profit: green
👉Leverage x 5-10-20 for crypto
👉Leverage x 20-50-100 for commodities, stocks, indices, and forex
👉Margin 1-5% max.
Always practice risk and money management.
Invest a maximum of 5% on any trade or across all your trades.
Invest only what you can afford to lose, as no one is in control of the market.
👉Our analyses are primarily based on:
breakouts: two trend lines (ascending and descending) and a line indicating a horizontal breakout.
chart patterns: shoulders and head, triangle parttern, elliott impulse, etc etc.
We don't always have the time to track them at all times or to represent them visibly, given the numerous signals, the number of channels to manage, and especially because of the often rapid pace of market movements.
indicators: We associate at least two indicators with this technique.
👉Depending on the circumstances, we use specific indicators, often setting 3 or more take profit levels.
👉Indeed, there are good days in trading and also bad days. No one can promise to win every trade, and like all traders worldwide, we also experience stop-loss orders. However, we win more than we lose and remain positive.
👉You can close the position before or after the take profit orders indicated by the green lines if you are personally satisfied; the same applies to stop loss orders.
👉We must stay positive, clear-headed, and humble.
we cannot provide all instructions or all trades here on this channel.
Good luck to us all, and may God guide us. Amen.
Moodng Forms a Strong Bottom | Is a Bullish Reversal Coming?Here is an extended, SEO-friendly English version suitable for TradingView and traders:
It appears that Moodng has formed a significant and important bottom, indicating a potential trend reversal or accumulation phase. Recently, the price moved below a long lower shadow (wick), showing strong selling pressure, but it immediately rebounded upward. This reaction suggests that buyers are actively defending this area and that demand is present at lower price levels.
At this stage, the main Change of Character (CH) has not yet been fully formed, and the price has not confirmed stability or consolidation above the key support zone. This means that the market is still in a sensitive phase and may experience further volatility before establishing a clear bullish structure.
However, if the price revisits lower levels, it can provide a good opportunity for traders to enter at more favorable prices. In such scenarios, it is essential to strictly respect the invalidation level, as proper risk management remains a priority. Since the asset is currently trading in a relatively cheap zone and the long lower wick has been filled, the risk-to-reward ratio appears attractive for potential long positions.
For more conservative and risk-averse traders, it is recommended to wait for clear confirmation. This includes strong consolidation above the key level and the formation of a valid CH. Entering after confirmation may reduce risk and increase the probability of success, even if it means missing part of the initial move.
All target levels are clearly marked on the chart and should be followed according to your trading plan. These targets are based on technical structure, key resistance zones, and potential liquidity areas.
It is important to note that a daily candle close below the invalidation level will invalidate this bullish scenario and cancel the current analysis. In that case, traders should reassess market conditions and avoid holding long positions.
As always, traders are advised to combine this analysis with their own strategies, proper risk management, and market context before making any trading decisions.
If you would like us to analyze a coin or altcoin for you, first like this post, then comment the name of your altcoin below.
If the price continues to respect the support zone and confirms bullish momentum, we may see a strong upside move toward higher liquidity levels and major resistance zones.
If you would like us to analyze a coin or altcoin for you, first like this post, then comment the name of your altcoin below.
Fundamental Analysis - MOODENGMOODENG
▪️Date: February 26, 2026
▪️Project: Moodeng
▪️Ticker: MOODENG
▪️Market Cap: $51,087,076.28
▪️Total Value Locked (TVL): N/A
➡️ Project Description
Moodeng is a memecoin inspired by the viral pygmy hippo named Moo Deng. The project represents an unofficial fan cryptocurrency reflecting the volatility and sentiment of the crypto market. The main version runs on the Solana blockchain with no formal mission other than creating hype in the community. Its purpose is entertainment and speculation, with a unique advantage in viral meme culture.
Uniqueness: Stands out through connection to a real viral animal but offers no new technologies or utility. It addresses the need for entertainment and speculation in memecoins, relevant in the crypto community during hype waves.
Market: Memecoin market volume is around $50-60 billion (2026), with millions of users. Moodeng has about 68 thousand holders, growth potential through new viral trends, but high risk of interest decline. Development factors: social media, exchange listings.
Team: Anonymous, with no background data. Lack of transparency increases risks.
Weaknesses: High volatility, no real utility, dependence on hype.
➡️ Technology Analysis
Innovation: Simple token architecture on Solana for fast transactions, with no unique algorithms. Differentiation from competitors is only in theme, not technology.
Development Activity: No open GitHub repositories, low activity (0 commits per year). Code not fully open, documentation minimal.
Sector: Solana-based memecoins. Competitors:
▪️ Bonk (BONK)
▪️ Samoyedcoin (SAMO)
▪️ Peanut the Squirrel (PNUT)
▪️ Fwog (FWOG)
▪️ Floki Inu (FLOKI)
Differentiation: Focus on hippo theme, but no technological advantages — all are similarly simple.
Conclusion: Basic technology with no innovation. Development activity 0/10, code quality unknown.
➡️ Market and Competitors
Problem Size: Memecoins address the need for fun investments, highly relevant in bull markets.
Competitors:
▪️ Bonk (market cap ~$1.5B, strong community)
▪️ Floki Inu (market cap ~$500M, marketing focus)
Partnerships: Moodeng has none. Competitor growth rates: Bonk grew 1000% in 2024-2025.
Potential: In altseason, memecoins can grow 10-100x.
Profitability: Protocol generates no income, $51M market cap reflects speculation.
Conclusion: Market promising, but Moodeng lags behind leaders with no uniqueness.
➡️ Investors and Partnerships
No documented investors or rounds. Community launch without VC backing.
Analysis: Lack of strong investors is a negative, no trust signals. In other projects (e.g., Bonk with angel participation), prices grew 10-20x.
Conclusions: Lack of backing makes the project risky.
➡️ Tokenomics
▪️Max Supply: 989.97 million (fully minted)
▪️Circulating: 989.97 million
▪️Total Supply: 989.97 million
▪️Market Cap: $51M
▪️Inflation: None
▪️Distribution: 100% circulating, no allocated shares for team/investors (anonymous launch)
▪️Chart: Fully Circulating: 100%
▪️Supply/Demand: Fixed supply, demand from hype. No burning or buyback mechanisms.
▪️Unlock Schedule: None, all unlocked. No unlock pressure.
▪️Mechanisms: No inflation or deflation.
▪️Comparison: Bonk has burning (deflationary), Floki has staking. Moodeng is worse.
▪️Conclusion: Weak tokenomics without utility — risk of decline.
➡️ Community and Social Activity
Audience: about 68 thousand holders on Solana. Average activity, trading volume indicates interest. Sentiment neutral with hype peaks. Metric: 6/10 — average community for a memecoin.
➡️ News, Events, Announcements
▪️ Feb 25, 2026 — price drop of 4.25% due to market
▪️ Jan 25, 2026 — DeFi plans for variant
Impact: Bullish market (BTC to $130-150k, altseason), memecoin sector growing.
💡 Conclusion
Overall rating: 4/10 — weak fundamentals.
Recommendation: Do not include in portfolio for conservative investors; only for high-risk (1-5% allocation). Maximum market cap forecast: $500 million in altseason.
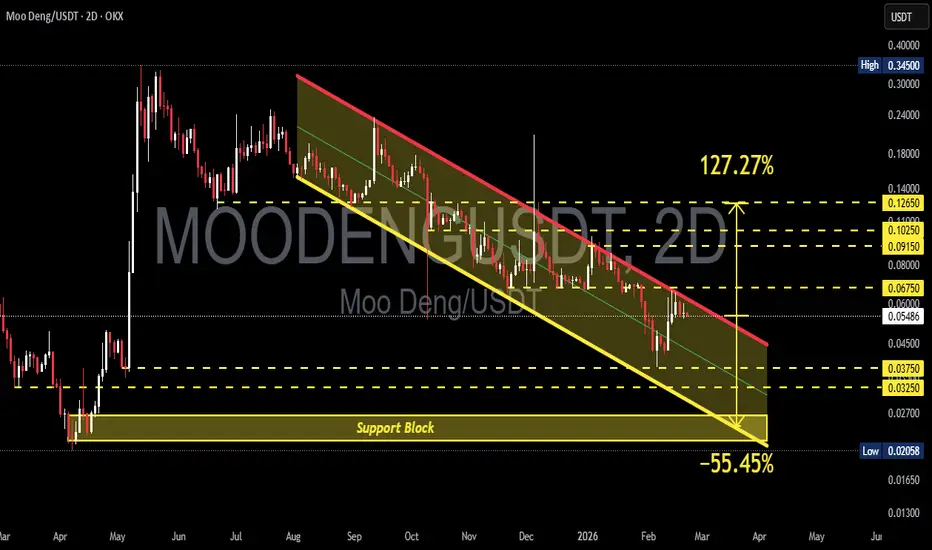
MOODENGUSDT – Descending Channel Breakout or Major Breakdown?On the 2D timeframe, MOODENG/USDT has been moving within a controlled downtrend structure since August 2025. Price continues to form consistent lower highs and lower lows, indicating mid-term seller dominance.
Currently, price is trading inside a descending channel and approaching the upper trendline resistance (red line). On the lower side, there is a strong support block at 0.0265 – 0.0220, acting as the main demand zone.
The structure is now at a decision point.
---
Pattern Structure – Descending Channel
Technically, the chart forms a large Descending Channel:
Upper red line: dynamic descending resistance
Lower yellow line: dynamic descending support
Price movement is structured, bouncing from top to bottom within the channel
Trend remains bearish as long as price stays inside the channel
Characteristics of a descending channel:
Typically reflects a controlled downtrend
A breakout above can signal the beginning of a trend reversal
A breakdown below accelerates bearish continuation
A valid breakout requires a strong candle close above the red trendline, ideally supported by increasing volume.
---
Key Levels
Resistance levels:
0.0675
0.0915
0.1025
0.1265 (major breakout confirmation)
Support levels:
0.0375
0.0325
Strong support block: 0.0265 – 0.0220
The 0.0265 – 0.0220 zone is a major demand area that previously triggered a strong impulsive move.
---
Bullish Scenario
Requirements:
Strong break and close above the red trendline
Volume expansion
Reclaim of 0.0675
Targets:
1. 0.0915
2. 0.1025
3. 0.1265 (structure shift confirmation)
4. If momentum accelerates, potential expansion up to +127% from the current area
If 0.1265 is broken and held as support, the structure shifts into a bullish market structure change.
---
Bearish Scenario
Requirements:
Strong rejection at the red trendline
Breakdown below 0.0375
Price exits the channel to the downside
Downside targets:
1. 0.0325
2. Support block 0.0265 – 0.0220
If the support block fails, there is potential for approximately -55% decline toward previous lows.
A breakdown below 0.0220 would confirm continuation of the macro downtrend.
---
Conclusion
MOODENG is trading inside a large descending channel and is currently at a critical zone. As long as price remains inside the channel, the trend remains bearish.
A breakout to the upside could trigger a 100%+ rally.
However, losing the 0.0265 – 0.0220 support block would extend the bearish structure significantly.
This is a high risk – high reward area.
Trade confirmation, not prediction.
#MOODENG #MOODENGUSDT #CryptoAnalysis #AltcoinSetup #TechnicalAnalysis #DescendingChannel #SupportResistance #BullishScenario #BearishScenario
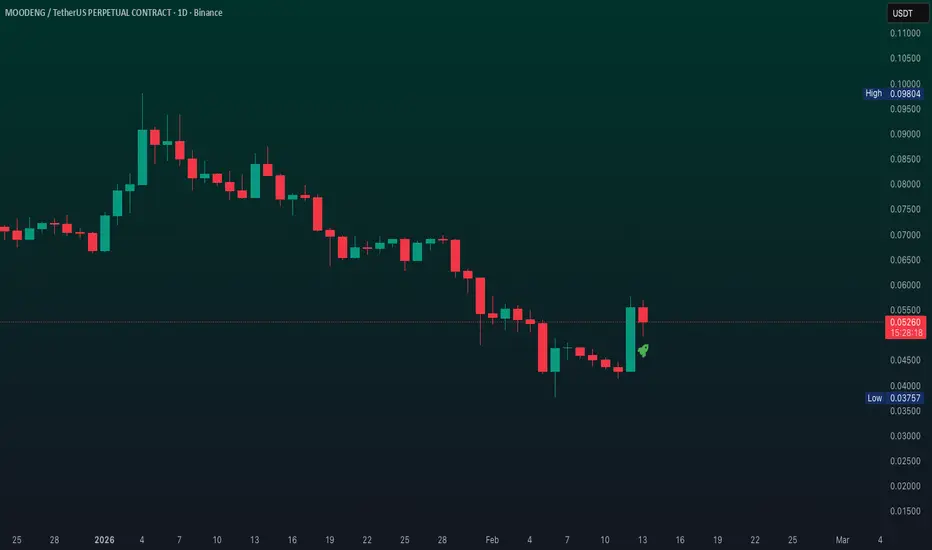
MOODENGUSDT — Strong Bias but Volume Isn't Confirming
MOODENG is printing a strong bullish structure across timeframes, but beneath the surface the volume profile tells a different story. This looks like a setup where bias and volume are diverging — and that divergence matters.
Price sits at 0.05655 with futures trailing slightly at 0.05641. The pair has retraced 14.4% from its recent high and is currently showing a 49.9% bounce at 3.5x the supply zone — a confirmed breakout above overhead resistance.
Directional scoring reads 69.2% bullish across 112 signals with a 2.23x bull-to-bear ratio. Close-to-trigger signals lean bullish at 9 to 5. Engulfing patterns favor bulls 3 to 0, and Ichimoku cross signals are nearly split at 7 to 6. The deep timeframe alignment supports the bull case structurally, though clarity remains moderate at 46%.
Spot volume is quiet with a Z-score of -0.72. Futures volume is steady but not aggressive at -0.32. The combined reading of -0.37 confirms neither side is pressing hard. The futures-to-spot ratio sits at 10.36x — elevated but not extreme. Dollar volume shows 3.57M spot against 37.01M futures, meaning the move is futures-led for now. On-balance volume Z sits at -1.45 with inflow divergence, which hints at early accumulation that hasn't translated into visible spot pressure yet. No whale activity and liquidity is clear.
Leverage reads 10.34x at the 70.9th percentile — mid-range. The all-time max was 20.9x roughly 469 bars ago, and the minimum was 0.12x about 508 bars back. Price sits at just 7.8% above its floor, meaning downside has already been largely flushed. This is a reasonable leverage environment, not overheated, but not clean either.
Premium is slightly backward at -0.25% with a Z-score of -0.2. Yield reads -271% APY — a mild bearish lean in funding. The standard deviation sits at 0.229% with a mean Z of -1.06, indicating the premium has fallen roughly one standard deviation below its average. This favors contrarian long positioning if spot volume confirms.
No squeeze is firing on either spot or futures. Momentum is bullish but declining, with bandwidth at 47.14%. Spot squeeze momentum is compressing upward at 353.5%, which could be the early staging of a volatility expansion — worth watching closely.
Bullish scenario: Spot volume picks up to confirm the structural bias. A break above the 49.9% bounce level with rising spot Z-scores would validate the bullish thesis. The OBV inflow divergence resolves upward and the premium flips positive. Target the retrace recovery zone toward the prior swing high near 0.065.
Bearish scenario: Volume remains quiet and the futures-to-spot ratio climbs further. Momentum continues declining and the premium deepens into backwardation. Price loses the current floor zone around 0.043, invalidating the bounce structure. The lack of spot participation turns the bullish bias into a hollow signal.
Watch for spot Z-scores crossing above zero as the key confirmation. The squeeze compression on spot momentum is the sleeper signal here — if that fires while bias holds, the move could be fast. Also monitor the leverage percentile — a push above 80% without spot follow-through would be a warning.
This is a moderate-conviction setup. The structure says bull, but the volume says wait. Manage size accordingly and don't chase until spot confirms what futures are suggesting.
More analysis on my profile.
Tags: MOODENGUSDT, MOODENG, meme coin, crypto, volume analysis, leverage, market structure, futures, spot, supply demand
MOODENG READY TO LEAD MEMESEASON🔥 Fortune AI Radar — CRYPTOCAP:MOODENG
Fresh activity detected on CRYPTOCAP:MOODENG today.
Data suggests increasing market interest & buyers stepping in.
Technicals currently lean bullish, with momentum trending upward.
Whales showing hints of accumulation and hype rising among trader
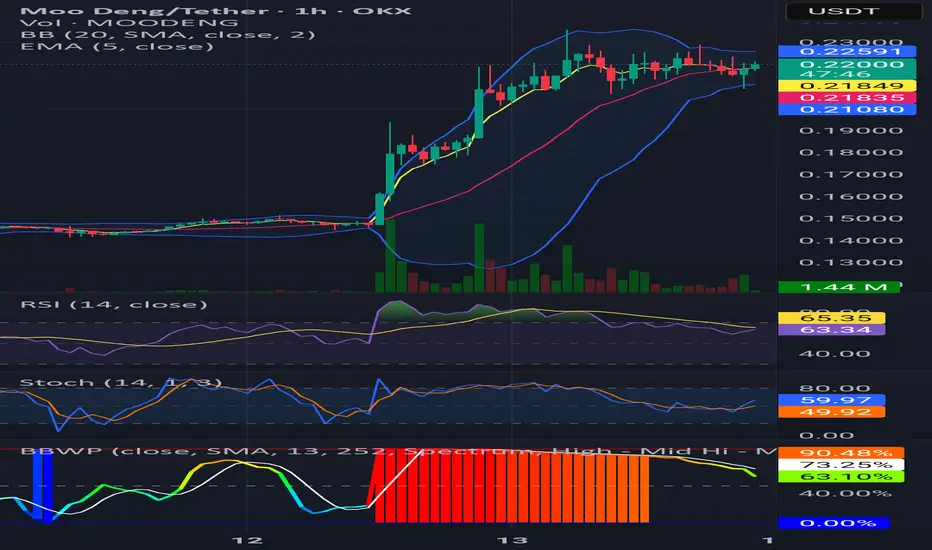
$PENGU & $MOODENG FractalsMemes are showing some relative strength. CRYPTOCAP:MOODENG climbed over 55% in the last 24 hours, lifted by renewed media buzz, a clean bullish breakout, and a heavy spike in volume. A sharp midday liquidity burst sent the price straight up. CRYPTOCAP:MOODENG carries strong speculative momentum, but as a pure memecoin, it remains highly volatile and driven by sustained hype.
On the left chart is $PENGU, and the 8-hour fractals look almost identical to MOODENG’s price action. Will $PENGU follow the same playbook and shift into a parabolic micro-trend? If volume sustains, the next potential zone sits around $0.015–$0.020, with a possible wick toward $0.025-0.030.
MOODENGUSDT 1D#MOODENG is moving inside a descending channel on the daily chart. Volume has increased, and on its first attempt it was rejected from the channel resistance and the daily SMA50. Keep an eye on it. If price breaks above both levels, the potential targets are:
🎯 $0.10398
🎯 $0.11635
🎯 $0.12871
🎯 $0.14631
🎯 $0.16873
⚠️ Always remember to use a tight stop-loss and maintain proper risk management.
MOODENG is cooking next +200% only if support holdif price hold above 0.10$ for two months in this period we will see next 2x-3x easy and our target would hit else below 0.10$ more -50% will lead and that pump will start after hitting 0.05$ first.
DISCLAIMER: ((trade based on your own decision))
<<press like👍 if you enjoy💚
Continuation likely.After a 60%+ move already this week from moodeng, the meme held the bottom side of the consolidation range. Since it didn't break down I look for it to break out to the upside. Upon break above .25 cents I look for a quick move up to .30 cents, minor resistance @.32 and more important resistance around .35. Let's not forget in May this shiiite coin ran from .04 cents to .35 in a weeks time. Not saying it'll do 800%+ again but it wouldn't suprised me at all to see. 50 or .60 cents. Who knows? If it just bulldozes past all resistance I'll sell most of my position @ $1 and subsequently quit my job. But first things first.....let's see this console range break to the upside.
Moodeng HTF ideaHave this idea on Moodeng. FRVP is from A to B. Areas of interest are :
1) 1DHOB which is above VAH
2) 1D Demand which there is the POC also.
SL covers both levels ( i know its wide ), and its placed below the CBOB as found in many TF's.
I will try to enter M.O with microTF confirmation and confluence from Majors