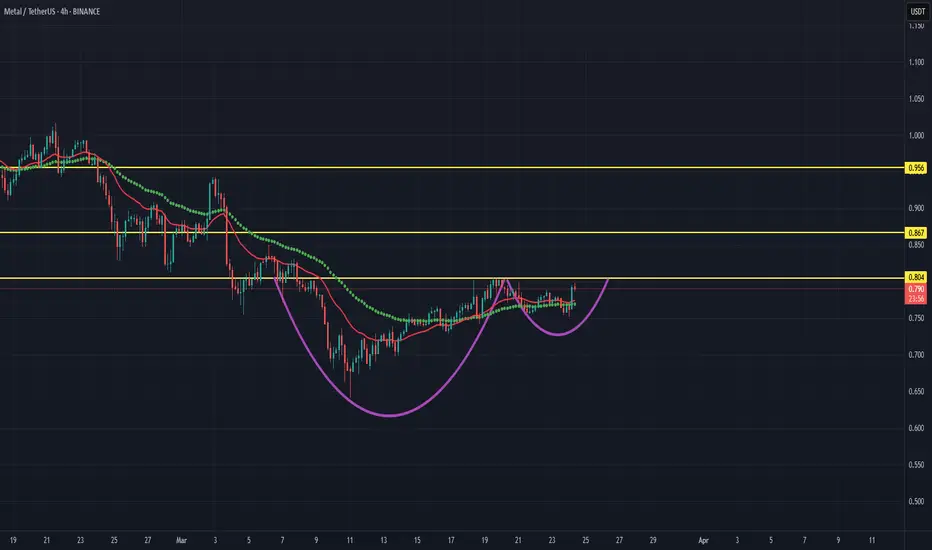
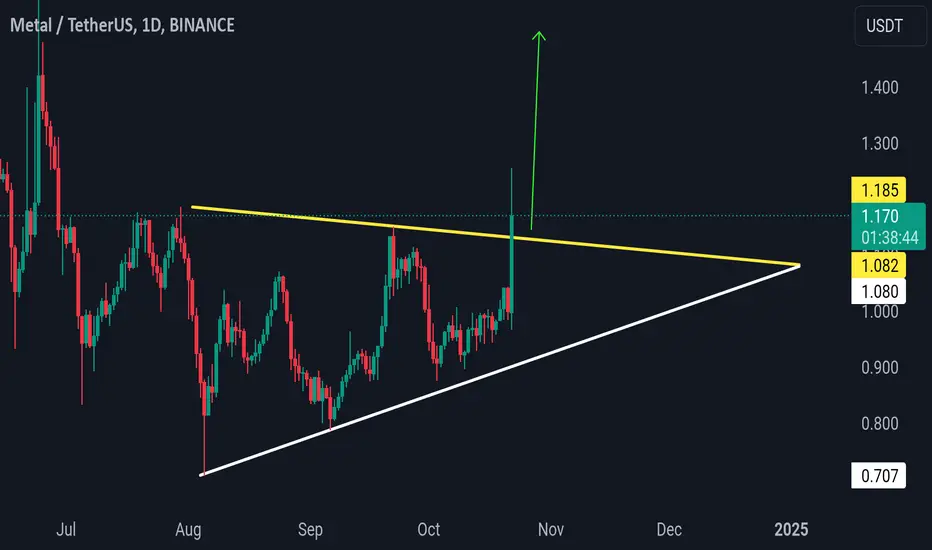
MTL: 245% Upside Setup in PlayMTL is showing strong bullish momentum after holding above its key entry zone.
If price continues to respect support and breaks major resistance, this setup could develop into a larger move toward a potential 245% upside.
Watch for volume confirmation and a sustained breakout before expecting the full move.
Not financial advice.
In-depth trading ideas
#METAL#METAL is consolidating inside a falling wedge pattern 📉, showing some stability around the 0.2930 mark. A breakout from the wedge could see price target the 0.3200 level 🚀 as indicated on the chart. Identifying chart patterns early can provide strategic entry and exit points for traders 💡.
#METAL #altcoin #chartpatterns #trading
MTLUSDT 12HKeep an eye on the #MTL 12H timeframe chart. It has bounced off the support and entered the Ichimoku cloud, and it was rejected from the descending resistance and the SMA100. However, considering the volume and the fact that it is still inside the Ichimoku cloud, we can expect it to break the descending resistance soon. If that happens, the potential targets are:
🎯 $0.474
🎯 $0.504
🎯 $0.534
🎯 $0.577
🎯 $0.631
⚠️ Always remember to use a tight stop-loss and maintain proper risk management.
#MTL/USDT#MTL
The price is moving within a descending channel on the 1-hour frame, adhering well to it, and is heading for a strong breakout and retest.
We have a bearish trend on the RSI indicator that is about to be broken and retested, which supports the upward breakout.
There is a major support area in green at 0.700, representing a strong support point.
We are heading for consolidation above the 100 moving average.
Entry price: 0.711
First target: 0.722
Second target: 0.736
Third target: 0.754
MTLUSDT — Support Accumulation, Preparing for the Next Big Move?📝 Full Technical Analysis & Narrative
MTL/USDT has come a long way. From the all-time high at $10.36, price has retraced into the multi-year support zone at $0.65 – $0.75, where it has been consolidating sideways for a prolonged period.
The yellow box on the chart highlights a key demand zone that has been tested multiple times since 2022. Each time the market dipped into this range, buyers stepped in aggressively. This suggests that participants view this zone as “undervalued territory” for M
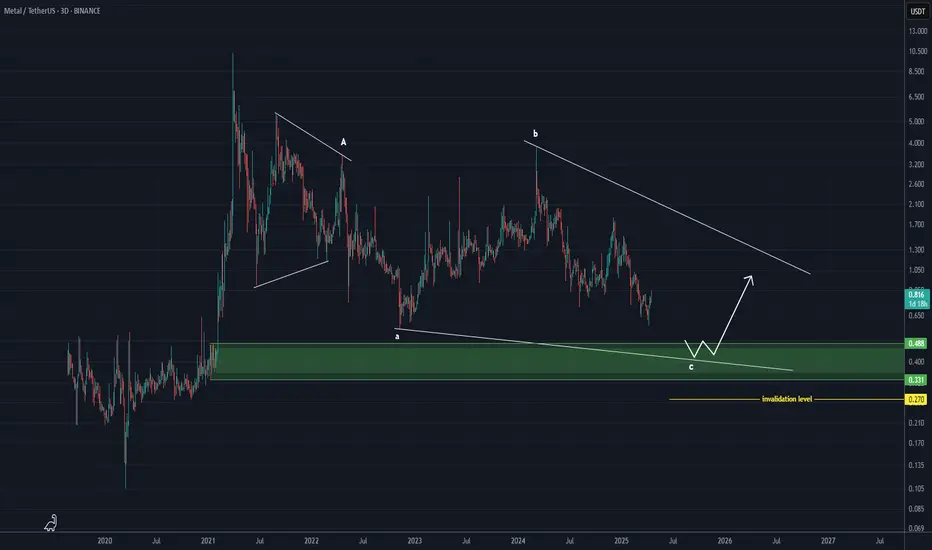
MTL Rebuy Setup – Perfect Entry Ahead! (3D)MTL (Metal DAO) is currently developing within Wave C of a classic diametric pattern, based on Elliott Wave theory. This structure suggests a high-probability corrective phase that typically leads to sudden and sharp movements before a potential reversal.
As of now, MTL has not yet reached the identified green buy zone, but price action is approaching it. This zone has been highlighted by analysts as a major area of interest for a potential rebuy scenario once touched, based on market structure
MTLUSDT | AN OPPORTUNITY MIGHT OCCUR BUT BE CAREFUL!MTLUSDT looks strong, although there is a possibility of clearing the monthly liquidity line below.
In the S/R Flip area shown in the chart,
You can enter when the resistance in the support area, which is currently working as resistance, is broken with volume and turns into support.
Low Timeframe Entries: Looking for confirmation on smaller timeframes after liquidity clearance.
S/R Flip Confirmation: Waiting for the current resistance to break with volume and turn into support before enteri
#MTL/USDT Ready to go higher#MTL
The price is moving in a descending channel on the 1-hour frame and sticking to it well
We have a bounce from the lower limit of the descending channel, this support is at 1.10
We have a downtrend on the RSI indicator that is about to be broken, which supports the rise
We have a trend to stabilize above the moving average 100
Entry price 1.15
First target 1.19
Second target 1.22
Third target 1.27
#MTL/USDT#MTL
The price has broken the descending channel on the 1-day frame upwards and is expected to continue.
We have a trend to stabilize above the 100 moving average again.
We have an upward trend on the RSI indicator that supports the rise by breaking it upwards.
We have a support area at the lower limit of the channel at a price of 0.0780.
Entry price 1.00.
First target 1.21.
Second target 1.42.
Third target 1.76.
Metal DAO (MTL) about to print a 2500% move?On the above weekly chart price action has corrected over 90% since early 2021. A number of reasons now exist to be long, including:
1) Price action and RSI resistance breakouts.
2) Support and resistance. Look left. Price action has now confirmed support on past resistance.
3) A weekly life cross prints.
4) Lastly, price action has exited a bull flag. The extension measures a 2500% move to target.
Is it possible price action continues to correct? Sure.
Is it probable? No
Ww
Type: Trade
R
MTL/USDT is on the verge of a big breakout!🚀 MTL/USDT is on the verge of a big breakout! 🚀
The MTL/USDT trading pair is showing promising signs of a potential breakout as it nears a critical resistance level. 📈 If it manages to break through, it could spark a strong bullish rally, driving prices higher. 🔥
💡 Here’s what to watch for:
- Key resistance levels: A breakout above this level could signal the start of a new bullish trend, paving the way for significant upward movement. 🚀
- Trading volume: Keep an eye on buying volume, as a
Metal Grew 9,770% Against Tether (USDT) In 2021, Peaked In MarchConsolidation since November 2022, that's almost two years old. The upper trendline (blue) of the widening channel has been challenged three times, perfectly. Metal (MTLUSDT) just tested the lower trendline and so far it holds as support. This trendline being tested produces a long-term higher low and the stage is set for the next bullish wave.
The last major peak for this pair happened 3.5 years ago and we are ready for a new one. We are ready, the chart is ready, the market is ready. It will
MTL looks bearishMTL seems to be completing an ABC.
We now seem to be at the end of the b/x wave from B.
The best range for sell/short positions is the red range.
The targets are clear on the chart.
Closing a daily candle above the invalidation level will violate the analysis
For risk management, please don't forget stop loss and capital management
When we reach the first target, save some profit and then change the stop to entry
Comment if you have any questions
Thank You
MTLUSDTHM signal v5.0 (High momentum) spotted. Looking good with previous wave up with increasing volume and momentum.
- Heathy retracement and support well at good level @ 1.2999-1.3569
- Trending slow and steady if able to hold above the support zone
It is at extremely good reward to risk level now if able to hold above the support level.