MYXUSDT Approaching a High-Conviction Accumulation RegionMYX continues to trade within a well-defined descending broadening formation, a structure that often emerges during prolonged corrective phases before a major trend reversal. Price is now approaching the lower boundary of the pattern, aligning closely with a significant accumulation zone that has historically attracted strong buying interest.
What makes this area particularly interesting is the confluence between structural support and the pattern's lower expansion line. As long as the accumulation zone remains intact, the probability of a meaningful recovery increase substantially. This region offers the market an opportunity to establish a higher timeframe base after months of persistent downside pressure.
From a risk-to-reward perspective, the current location is far more attractive than chasing strength at higher prices. A successful defense of the accumulation zone could trigger a rotation toward the upper supply region around $1.20, representing a significant recovery from current levels.
For now, the focus remains on how price reacts within the highlighted accumulation area. If buyers step in and reclaim momentum, MYX could be setting the stage for one of its most important reversals since the start of the broader downtrend.
The best opportunities often appear when sentiment is at its weakest and price reaches its strongest support.
In-depth trading ideas
#MYXUSDT Medium-term Bullish potential !#MYX
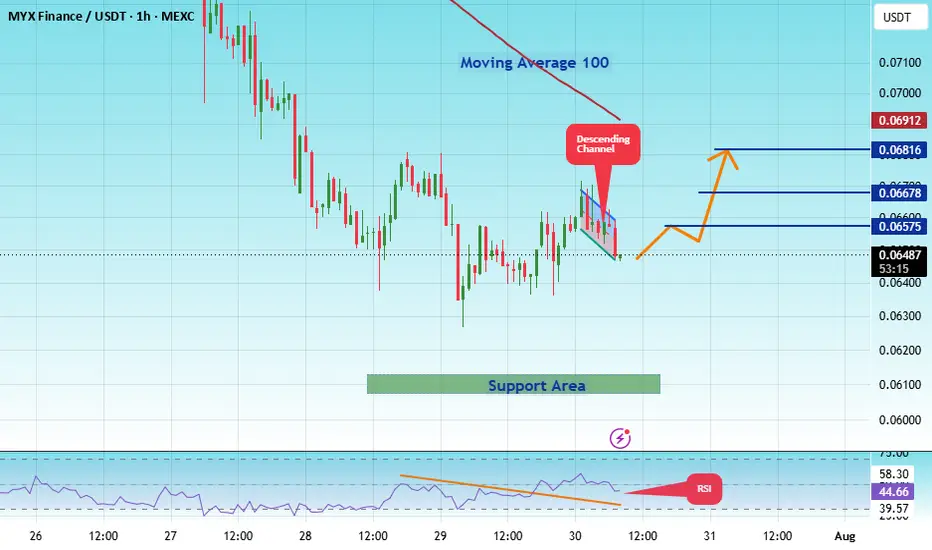
The price is moving within a descending channel on the 1-hour timeframe and has reached the lower boundary. It is now poised for a bounce and is expected to retest this boundary.
The Relative Strength Index (RSI) indicates a downward trend, which is likely to continue given the overbought conditions.
There is a key support zone in green at 0.06076. The price has bounced off this zone several times, making it a strong support level.
The price is trending towards the 100-period moving average, which we are approaching. This trend supports an upward move.
Entry Price: 0.06500
Target 1: 0.06575
Target 2: 0.06678
Target 3: 0.06816
Stop Loss: At the resistance zone in green
Remember this simple rule: Money management.
Any questions? Please leave a comment.
Thank you.
#MYXUSDT Medium-term Bullish potential !#MYX
The price is moving within a descending channel on the 1-hour timeframe and has reached the lower boundary. It is now poised for a bounce and is expected to retest this boundary.
The Relative Strength Index (RSI) indicates a downward trend, which is likely to continue given the overbought conditions.
There is a key support zone in green at 0.06700, and the price has bounced off this zone several times, making it a strong support level.
The price is trending towards the 100-period moving average, which we are approaching. This trend supports an upward move.
Entry Price: 0.07855
Target 1: 0.08150
Target 2: 0.08500
Target 3: 0.08896
Stop Loss: At the resistance zone in green
Remember this simple rule: Money management.
Any questions? Please leave a comment.
Thank you.
#MYXUSDT Medium-term Bullish potential !#MYX
The price is moving within a descending channel on the 1-hour timeframe and has reached the lower boundary. It is now poised for a bounce and is expected to retest this boundary.
The Relative Strength Index (RSI) indicates a downward trend, which is likely to continue given the overbought conditions.
There is a key support zone in green at 05557. The price has bounced off this zone several times, making it a strong support level.
The price is trending towards the 100-period moving average, which we are approaching. This trend supports an upward move.
Entry Price: 0.07248
Target 1: 0.08715
Target 2: 0.07926
Target 3: 0.07259
Stop Loss: At the resistance zone in green.
Remember this simple rule: Money management.
Any questions? Please leave a comment.
Thank you.
#MYXUSDT Medium-term Bullish potential !#MXY
The price is moving within a descending channel on the 1-hour timeframe and has reached the lower boundary. It is now poised for a bounce and is expected to retest this boundary.
The Relative Strength Index (RSI) indicates a downward trend, which is likely to continue given the overbought conditions.
There is a key support zone in green at 0.06645, and the price has bounced off this zone several times, making it a strong support level.
The price is trending towards the 100-period moving average, which we are approaching. This trend supports an upward move.
Entry Price: 0.07521
Target 1: 0.07723
Target 2: 0.08149
Target 3: 0.08623
Stop Loss: At the resistance zone in green
Remember this simple rule: Money management.
Any questions? Please leave a comment.
Thank you.
MYX Appears Ready for a Bullish Move (4H)This coin appears to be forming a large Diametric correction, with wave D having recently been completed.
We are now in wave E of this larger Diametric, which itself appears to be developing as a Double Combination. At the moment, the market seems to be in the first correction of this Double Combination, taking the form of a Diametric.
Price now appears to be in wave F of this Diametric. Once wave G is completed, the market could form an upward X wave.
The highlighted green zone offers a potential area to look for buy/long positions.
The targets are marked on the chart.
A daily candle close below the invalidation level will invalidate this analysis.
If you have a symbol you want analyzed, first hit the like button and then comment its name so I can review it for you.
Do you also think MYX is bullish?
myxIt has a weekly timeframe reaching the bottom
But in the medium and short term, it plays between the green and red boxes. If it wants to see the yellow points, it should move forward with the green box support, and if it wants to see the blue points at the bottom, it must be accompanied by the red box resistance.
MYXUSDT Forming Falling WedgeMYXUSDT is forming a clear falling wedge pattern, a classic bullish wave signal that often indicates an upcoming breakout. The price has been consolidating within a narrowing range, suggesting that selling pressure is weakening while buyers are beginning to regain control. With consistent volume confirming accumulation at lower levels, the setup hints at a potential bullish breakout soon. The projected move could lead to an impressive gain of around 290% to 300% once the price breaks above the wedge resistance.
This falling wedge pattern is typically seen at the end of downtrends or corrective phases, and it represents a potential shift in market sentiment from bearish to bullish. Traders closely watching MYXUSDT are noting the strengthening momentum as it nears a breakout zone. Strong trading volume adds confidence to this pattern, showing that market participants are positioning early in anticipation of a reversal.
Investors’ growing interest in MYXUSDT reflects rising confidence in the project's long-term fundamentals and current technical strength. If the breakout confirms with sustained volume, this could mark the start of a fresh bullish leg. The current market structure suggests that buyers are steadily taking control while bearish pressure continues to fade, creating favorable conditions for a potential trend reversal.
Traders might find this a valuable setup for medium-term gains, especially as the falling wedge pattern nears completion and buying momentum accelerates. A confirmed breakout could attract significant buying interest and potentially drive the price toward substantially higher levels over the coming weeks.
✅ Show your support by hitting the like button!
✅ Leave a comment below! (What is your opinion about this coin?)
Your feedback and engagement keep me inspired to share more insightful market analysis with you!
#MYXUSDT Medium-term Bullish potential !#MYX
The price is moving within a descending channel on the 1-hour timeframe and has reached the lower boundary. It is now poised for a bounce and is expected to retest this boundary.
The Relative Strength Index (RSI) indicates a downward trend, which is likely to continue given the overbought conditions.
There is a key support zone (in green) at 0.2334. The price has bounced off this zone several times, making it a strong support level.
The price is trending towards the 100-period moving average, which we are approaching. This trend supports an upward move.
Entry Price: 0.2430
First Target: 0.2477
Second Target: 0.2544
Third Target: 0.2623
You can stop at the first and second targets and close below them, or continue towards the third target. Stop Loss: At the resistance zone (in green).
Remember this simple rule: Money Management.
Any questions? Please leave a comment.
Thank you.
MYX/USDT – Update Confirmed trend📊 MYX/USDT – Update
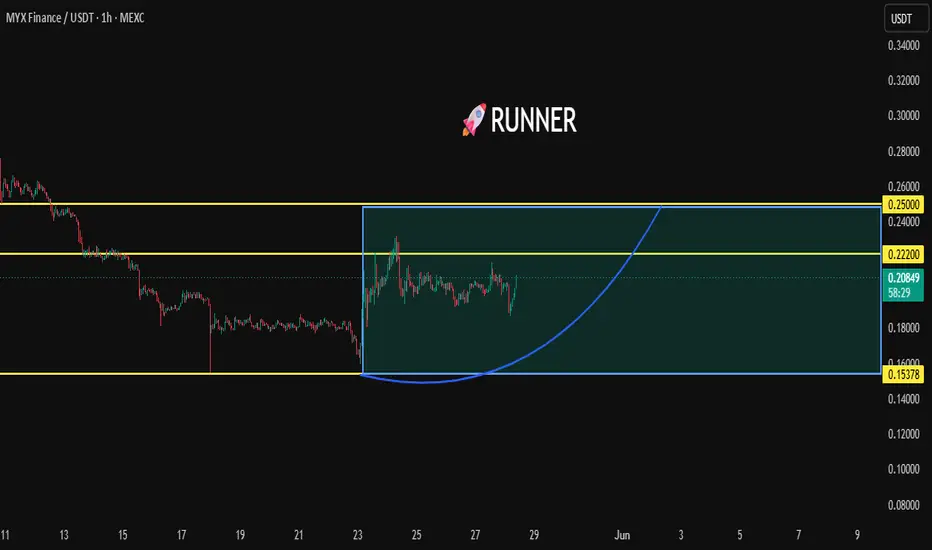
MYX is stabilizing after a strong recovery from the recent support zone and continues building momentum inside the current accumulation structure. The price action suggests buyers are maintaining control, increasing the probability of a continuation move if momentum keeps strengthening.
🎯 TP 1: 0.2220
🎯 TP 2: 0.2500
🚀 TP 3: Runner target open — allowing the trend to capture maximum upside potential.
👉 As long as price remains above the support zone, the bullish scenario stays active.
This is our trading expectation and not financial advice : everything depends on confirmed trend continuation.
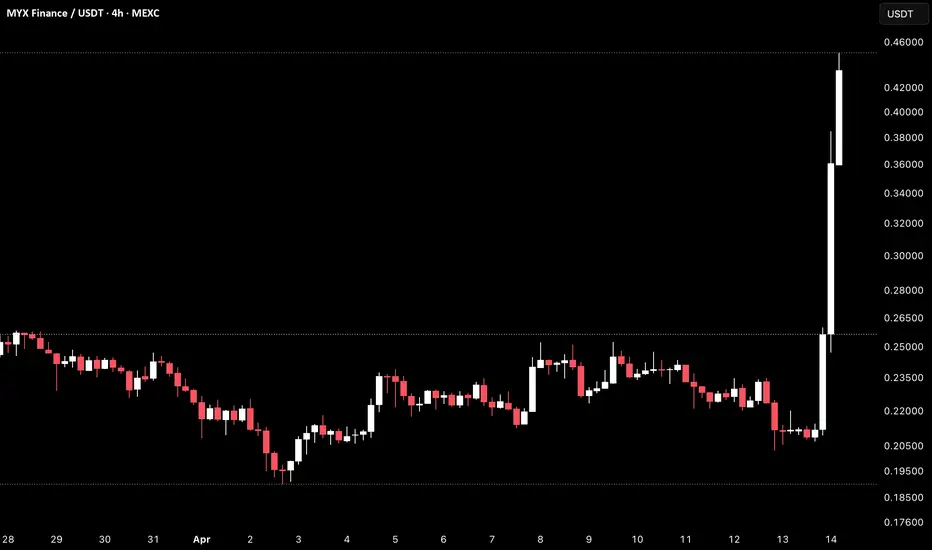
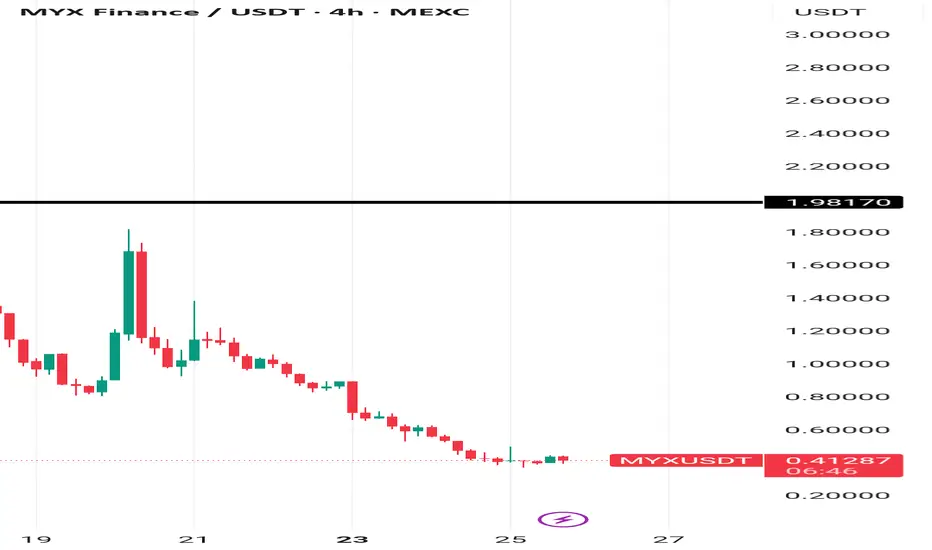
MYX 4H – Vertical Spike & Full Retrace Back Into RangeMYX Finance on the 4H timeframe is currently trading around 0.4102 after an explosive vertical move that sent price from the 0.210 region all the way to a high near 0.440+ in a single candle.
Price has since retraced sharply and is now hovering near the 0.410 area, still well above the prior range but showing signs of cooling after the initial impulse.
The entire move happened after weeks of tight consolidation between 0.200 and 0.255.
Key Levels To Watch
0.440+ → Spike high, key resistance above
0.410 → Current price, immediate reaction zone
0.255–0.260 → Prior range highs, now first major support below
0.210–0.220 → Base of the consolidation range
Below 0.200 → Full structure breakdown
The key question now is whether price can hold above the prior range highs near 0.255–0.260 on any pullback, which would confirm the breakout as legitimate.
A clean hold above 0.255 would keep the bullish breakout structure intact and open room for continuation.
A full retrace back below 0.255 would suggest the spike was a liquidity event and not a structural breakout.
This is a post-spike decision point.
Hold 0.255 on pullback → breakout confirmed, continuation possible.
Lose 0.255 → spike fades back into the prior range.
No bias until price stabilizes and reaction zones are confirmed.
MYXUSDT Extreme Bear Breakdown MYXUSDT trades at 0.3281 spot against 0.3286 futures with F/S ratio at 11.75x High. Futures dollar volume at 44.61M against spot at 3.8M shows futures running at 11x spot, speculative positioning dominant. Leverage at 11.77x High with Percentile at 24.3% Floor, AT Max was 230.02x 253 bars ago confirming this asset has experienced extreme leverage events historically. Price at 0.2% Bottom in the 200-bar range, essentially at the lowest recorded price.
4 of 112 signals bull against 49 bear with Clarity at 47%. EMA 0:9 completely bare, no timeframe holding above either moving average. Ichi TK 3:10, C>T 0:13 showing price below Tenkan on every timeframe. Candle 1:13, Spread at 84.9% Extreme, 3 bearish pattern confirmations with Star and Pat Tot bears adding candle weight. SS/DD 1 demand against 2 supply. Squeeze ELEVATED at 4 bars with momentum Bear up and BW at 63.22% Normal, compression with bears still in control.
Spot Z 0.02 Average and Futures Z -0.15 Steady combine into F+S Z -0.14, volume is quiet with no panic selling or capitulation spike. Spot:Fut Normal, Direct Neutral, Bull:Bear Z -0.21 against 0.22 nearly balanced despite the extreme bear signal count. S.Mom Con down at 273.2% Coiling, volume compressing into the squeeze.
Leverage Percentile at 24.3% Floor with AT Min at 0.03x just 273 bars ago, leverage has not fully flushed to its historical minimum. Price at absolute bottom but leverage still has room to unwind further before structural recovery conditions are met.
OBV Z -0.17 Inflow up is the only constructive signal in this read. Slope rising despite extreme bear dominance suggests someone is quietly accumulating into the breakdown, but -95.3% retrace with only 0.2x Brkdn bounce recovery means the structure is completely destroyed.
The honest read: MYXUSDT is in freefall. Retrace -95.3% Deep with Bounce recovering only 0.2x Brkdn means for every unit of drop, price has recovered a fraction. EMA 0:9, C>T 0:13 with 49 bear signals leaves no timeframe with bullish structure. The only case for watching this is OBV quietly accumulating and leverage approaching floor, classic late-stage capitulation markers. But catching a falling knife with this signal profile requires either a volume capitulation spike or a full leverage flush to AT Min before any recovery thesis has merit. Currently avoid entirely.
Is That Crypto Pump Real? Data Says No. Here's Why.
Stop Losing Money to Fake Volume. Find Real Moves Now.
Trade the REAL Crypto Volume. Stop Getting Faked Out.
The MYX symbol will soon go to the bottom of hell (1D)This analysis is an update of the previous analysis that you can find in the related ideas section.
Wave B took a significant amount of time to develop, forming a prolonged corrective structure that likely caused uncertainty and consolidation across the market. However, based on the current structure and price behavior, Wave B now appears to be complete.
At this stage, the market seems to have transitioned into Wave C typically the strongest and most impulsive leg of a corrective pattern. Wave C is often characterized by sharp momentum, expansion in volatility, and aggressive selling pressure. The current price action supports this scenario, as we are seeing signs of increasing bearish strength and structural breakdown.
With price now positioned in what looks like a powerful Wave C to the downside, every upward move or corrective bounce should be viewed as a potential shorting opportunity rather than a reversal signal. These pullbacks are likely to offer better risk-to-reward entries for short positions, especially when aligned with resistance zones, liquidity areas, or Fibonacci retracement levels.
Traders should avoid counter-trend longs in this phase unless there is clear structural confirmation of invalidation. The dominant bias remains bearish as long as the structure of Wave C remains intact.
As always, risk management is essential. Wait for confirmations on lower timeframes if needed, manage position sizing properly, and trade the structure not the emotions.
If you have a coin or altcoin you want analyzed, first hit the like button and then comment its name so I can review it for you.
This is not a trade setup, as it has no precise stop-loss, stop, or target. I do not publish my trade setups here
MYX: dead-chart surprise or another sleeper? key levels to watchMYXUSDT.P – ready for a dead‑chart surprise move or just another sleeper alt? Lately small caps are waking up again as liquidity rotates down the risk curve and, according to industry sources, memecoins and microcaps are getting fresh attention after the recent BTC cooldown. Volume on MYX is still tiny, but the last spikes show someone is quietly accumulating inside this boring range.
On the 4H chart price is grinding sideways right under a big volume node, sitting in that red supply zone where most bags were built. RSI is mid‑range around 45, coming off a local peak, so momentum isn’t overheated but also not dead. That combination usually sets up a squeeze: either late shorts get run or tired longs finally give up.
My base plan: as long as price holds above the recent local floor around this range, I’m watching for a push back toward the upper supply area where the high volume bars peak. If we get a clean 4H close above that volume shelf with rising volume, I’ll consider a speculative long toward the top of the red zone, taking profits fast. ⚠️ If price loses the current base and closes below the range low, I step aside and expect another slow bleed lower – I might be wrong, but for now I’m flat and just stalking the breakout.
MYX/USDT Early Momentum Building, Path Toward $7.40+ ResistanceMYX is currently trading near a major historical base zone, where previous accumulation led to a strong impulsive rally. The current structure looks very similar to the early phase of that previous move, suggesting that momentum may be building again.
1 USD can become the reason to new start of volume entering to 7.40+
MYX did worked before on the same way.
Key Observation
Price is compressing around the $0.30 demand area, which historically acted as the starting point of major volume expansion. In the past, once MYX reclaimed this region and confirmed strength, the market quickly transitioned into a high-volatility bullish phase.
Trigger Level
$1.00 reclaim is the first important signal for the whale building volume
A strong candle close above $1 would indicate that buyers are stepping back in and could start the next leg upward.
Potential Upside Scenario
If momentum returns and MYX confirms above $1:
First major target: $2.7–$3.0 (initial resistance zone)
Mid-range expansion: $4–$5
Major resistance retest: $7.40+
That $7.40 level is particularly important because it previously acted as the start of the major supply zone before the last strong move.
Why This Setup Matters
The market is sitting at a historical accumulation area.
Previous cycles show similar base → breakout structures.
There is very little resistance (“open space”) above the current price once momentum begins, which can lead to fast vertical movement.
Summary
MYX is currently forming a structure that closely resembles its previous breakout pattern. If price confirms with a strong move above $1, the probability increases significantly for a larger recovery move, potentially sending MYX back toward the $7.40+ resistance zone.
The token PIPPIN:USDT was predict before on the same data stracture before it did runs
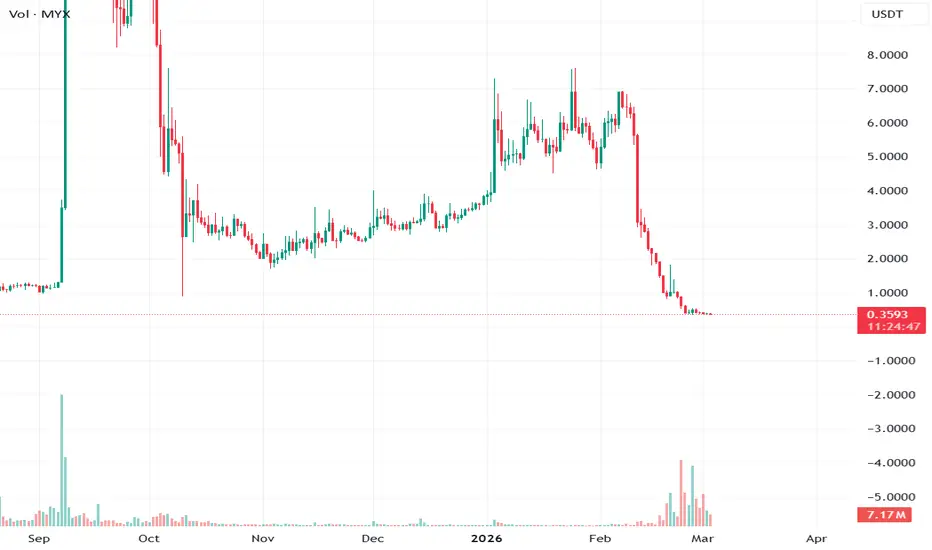
MYXUSDT — 98% Bear at Price Floor With Leverage Already FlushedPrice at 0.3588 with futures at 0.3603. Premium is 0.53% backward with a Z-score of 1.5. Futures trading above spot means longs are paying up in derivatives while spot sellers dominate. That backward premium during a downtrend is usually the last batch of hopeful longs getting trapped before the next leg.
This is as bearish as signals get. 1.8% bull vs 98.2% bear. 1 green signal against 54 red out of 112. EMAs are 0 to 11. Candles 0 to 13. Ichi TK 1 to 11. Spread at 96.4% extreme. There is nothing ambiguous here. Every timeframe across every signal category agrees this is in freefall. Retrace is -94.8% which means price has given back nearly everything. Bounce probability is just 6.7% at 0.1x. Breakdown confirmed.
Momentum is bear at 298.5% bandwidth with -2.88 deceleration. That negative momentum reading means the selling is not just continuing, it is accelerating. No squeeze detected. No compression building. Just open air below.
Volume paints an interesting picture though. Spot Z at 0.12 is average. Futures Z at -0.24 is steady. The ratio is 9.19x elevated which normally flags manipulation but in this context it tells you something different. Futures are not driving this selloff. Spot is. The dollar flow confirms it with 4.89M spot against 44.95M futures but direction reads neutral. This is genuine spot distribution, not a futures-driven liquidation cascade.
The leverage situation is what makes this worth watching for a potential reversal setup down the line. Leverage at 9.23x elevated but percentile at 9.7% which is floor. All-time max was 229.46x over 240 bars ago so current positioning is a fraction of historical extremes. Price percentile is 0%. Absolute bottom. OBV Z at -0.19 with strong downward direction confirms distribution is ongoing.
There is no buy signal here. Catching this falling knife with 98% bearish consensus and accelerating momentum is how accounts blow up. But floor leverage percentile combined with floor price percentile means the speculative excess has been completely wrung out. When the eventual reversal comes it will start from clean positioning. Watch for OBV Z to flip positive and leverage percentile to climb above 20% as
AFTER THE FALL A NEW START TO THE MOON - MYXBased on current data, MYX appears to be approaching a bottom trend level, which increases the probability of forming a confirmed bottom and potentially rebounding toward the $2 -$7 range.
This is considered a high-risk coin, but it also offers significant upside potential if a reversal is confirmed. Due to its volatility, careful monitoring and proper risk management are essential.
We will continue to closely follow this token and provide updates as the trend develops.
This expecting is like Pipping price action expecting we did before
Know that markets going on it's way, on the right confirmations and time frames.
MYXUSDT.P – Potential Strong Pump Toward 0.422 After an extendedMYXUSDT.P – Potential Strong Pump Toward 0.422
After an extended bearish move, MYXUSDT is showing signs of short-term exhaustion near the local support zone. Price is currently consolidating at low levels, which often precedes a volatility expansion.
There is a possibility of a strong impulsive move toward the 0.422 level, especially if buyers step in and momentum shifts in the lower timeframes.
Why a pump toward 0.422 is possible:
Price is compressed after a heavy sell-off
Support zone is holding for now
Potential short squeeze scenario
Liquidity resting above current price
If momentum increases and volume expands, we could see a sharp move targeting the 0.422 resistance area.
However, failure to hold the current support may invalidate this bullish scenario.
This is not financial advice. Always manage your risk properly.
MYX Is Coiling… The Trigger Is Closer Than It LooksToday I want to share my MYX ( BINANCE:MYXUSDT.P ) token analysis on the 15-minute timeframe. It can act as a signal, but always follow proper risk & capital management.
MYX is currently trading near the lower line of a Falling Wedge pattern, while also moving around the Cumulative Long Liquidation Leverage($0.860-$0.773).
From an Elliott Wave perspective, it looks like MYX may be completing microwave 5 of the main wave C.
I expect that after breaking above the wedge’s upper line, MYX could rally at least +15%.
Cumulative Short Liquidation Leverage: $1.049-$1.232
First Target: $0.977
Second Target: $1.091
Stop Loss(SL): $0.770(Worst)/$0.817
Points may shift as the market evolves
What’s your opinion on the MYX Finance project?
Note: Because trading volume is usually lower on Saturday and Sunday, the main move may happen late Sunday.
💡 Please respect each other's opinions and express agreement or disagreement politely.
📌MYX Finance Analysis (MYXUSDT.P), 15-minute time frame.
🛑 Always set a Stop Loss(SL) for every position you open.
✅ This is just my idea; I’d love to see your thoughts too!
🔥 If you find it helpful, please BOOST this post and share it with your friends.
MYX Testing Long-Term Ascending Support | High-Timeframe InflectMYX has retraced from the recent distribution phase and is now testing a key long-term confluence zone around $0.90–0.95.
This area combines:
- A multi-month ascending trendline
- Prior horizontal support
- Psychological round-number demand
The reaction here is structurally important.
Holding above the trendline keeps the broader bullish structure technically valid and opens the door for a potential recovery phase toward the $1.60–$2.00 region.
However, a confirmed breakdown below $0.90 would invalidate the long-term structure and shift the bias decisively bearish.
This is not a random level.
It’s a structural inflection point.
MVX: knife catching or caution? key levels to monitor nowMVX. Who’s trying to catch this knife and who’s just watching with popcorn? While majors steal the spotlight, smaller perp tokens like MVX are getting aggressively de‑leveraged, and this one just did a full waterfall into historical demand.
On the 4H chart we’re sitting right on that 1.8–2.0 demand zone, RSI is buried under 20 and starting to curl, and the last leg down came with a clear volume spike that smells like capitulation. With price trading well below the main volume cluster above, I’m leaning toward a short‑term relief long rather than chasing further downside here ✅
My base case: a bounce toward 2.3 first, then 2.7–2.9 if buyers really wake up. For me the trigger is a 4H close back above 2.0 with a higher low, with invalidation under 1.8; below that, door opens to 1.5 and I step aside. I might be wrong, but ignoring these oversold bounces is how you miss the “easy” trades – I’m flat for now and stalking that confirmation.
MYX — Extreme Bear With -72.4% Devastation**MYX — Extreme Bear With -72.4% Devastation, Deep Backwardation & Zero Recovery**
**Overview**
MYX is in one of the most extreme bearish states possible — 89.1% of signals aligned to the downside across 14 timeframes with a catastrophic -72.4% retrace. The 2.3% bounce against that decline produces a 0x recovery ratio, meaning buyers have done essentially nothing to reclaim the damage. This isn't a pullback or a correction — this is structural devastation. What makes this analytically interesting is the -1.93% premium at -3.3σ with -2110% APY yield, creating an extreme backwardation environment where shorts are paying historically punishing funding rates to maintain positions.
**Price**
Spot at 1.9146 / Futures at 1.8777 — a significant gap. The -1.93% premium at Z-score -3.3 is a 3+ standard deviation event in backwardation, meaning futures are trading at a deep discount to spot. This extreme backwardation tells us the futures market is overwhelmingly positioned short, and those shorts are paying -2110% APY in annualized funding to hold their positions. StdDev at 0.556% reads Volatile on both short and long windows, and MeanZ at -1.5σ Falling confirms the premium regime itself is deteriorating structurally — this isn't a one-off dip in premium, the entire premium curve is shifting lower.
**Bias**
Extreme Bear with 78.2% spread — among the widest possible readings. EMA structure is 0:9 — not a single timeframe shows bullish EMA alignment. Ichimoku TK is equally destroyed at 0:13. C>T reads 1:13 bear — price is below Tenkan on virtually every timeframe. Candle bias at 4:10 bear shows persistent selling even on the most recent price action. Two Three Black Crows detected with zero bullish patterns — the heavyweight bearish continuation pattern confirms sellers aren't slowing down. Two bearish engulfing against one bullish. Every signal category without exception is deeply bearish. Clarity at 49% means about half the signals are committed, and they're almost unanimously committed to the downside.
**Volume**
All Z-scores sit at Average — Spot 0.29, Futures 0.18, Combined 0.19. After a -72.4% decline, average volume rather than climactic tells us this has been a sustained bleed rather than a panic liquidation event. The F/S ratio at 11.5x is High but not Manipulation territory — futures activity outpaces spot but within a range that reflects genuine positioning rather than wash trading. Volume momentum is accelerating at 0.68 and structural momentum expanding downward at 344.8%, meaning the selling has renewed energy rather than fading. Bull:Bear Z at 0.42:0.71 shows slightly more bearish volume pressure. No whale activity, liquidations clear — this is a market that has already liquidated its longs and is now in a slow grind of remaining holders capitulating or abandoning positions.
**S/D**
dd:2 ss:2 — evenly balanced with 2 demand and 2 supply zones. After a -72.4% decline, only 2 demand zones remaining below means price has destroyed most of its historical support structure on the way down. The remaining zones are the last lines of structural defense.
**Momentum**
No squeeze active on either spot or futures, with squeeze divergence Normal. Momentum reads Bear ↑ — selling is still the dominant direction but the pace is decelerating slightly. This is the only mildly constructive signal on the entire board, suggesting the steepest phase of the decline may be moderating. Bandwidth at 162.87% is extreme, reflecting the massive volatility of a -72.4% move. Structural momentum expanding downward at 344.8% keeps the overall momentum picture firmly bearish.
**Scenarios**
🔴 Bear (Primary): The numbers speak for themselves — 89.1% bearish, 0:9 EMA, 0:13 Ichimoku, 1:13 C>T, 0x recovery, Two Black Crows, accelerating downside volume. There is no ambiguity in this reading. The remaining 2 demand zones are the next targets. Premium at -3.3σ backwardation could theoretically trigger a short squeeze, but with the price action this decisively bearish, any short squeeze would likely be a brief spike that gets sold into rather than a sustainable reversal. The MeanZ at -1.5σ Falling means even the premium structure is worsening.
🟢 Bull (Extreme counter-trend only): The -3.3σ premium and -2110% APY yield is the sole bull argument — at some point, the cost of maintaining shorts becomes prohibitive and a funding-driven squeeze occurs. Historically, premium Z-scores beyond ±3σ tend to mean-revert, and the punishing funding rate creates a structural incentive for shorts to close. However, in a -72.4% declining market, premium can remain extreme for extended periods because the directional conviction is overwhelming. Any bull thesis here is purely a funding rate arbitrage play, not a technical one — every technical signal is bearish. The appearance of a single bullish engulfing is the thinnest of threads.
**Watch**
Premium Z-score is the contrarian metric — if it pushes beyond -4σ it reaches historically unsustainable levels that almost always snap back. Momentum's Bear ↑ reading (decelerating selling) needs to persist and potentially flip to Bear flat before any base can form. C>T at 1:13 would need to climb above 4-5 bull for the earliest reversal signal. Volume Z-scores pushing to Active with bullish directional shift would be required for any bounce to have substance. The absence of whale activity means no large player is stepping in to accumulate yet — watch for this to change.
**Risk**
After -72.4%, the obvious risk perception is that "it can't go lower" — but a 0x recovery ratio with accelerating downside momentum and 89.1% bearish alignment says it absolutely can. The extreme backwardation creates a volatile premium environment where sudden funding-driven spikes occur but don't necessarily signal trend reversal. Trading this from the long side is pure speculation against every available signal. If considering any position, the -2110% APY yield means holding a spot long while the market pays you through funding is the only structurally sound approach — leveraged longs in this environment are capital destruction. The 2 remaining demand zones are the final structural reference points before uncharted territory.
👆More analysis on my profile.
---
Tags: `MYX` `MYXUSDT` `bearish` `extreme` `multitimeframe` `technicalanalysis` `retrace` `breakdown` `priceaction` `ichimoku` `volumeanalysis` `premium` `backwardation` `crypto`
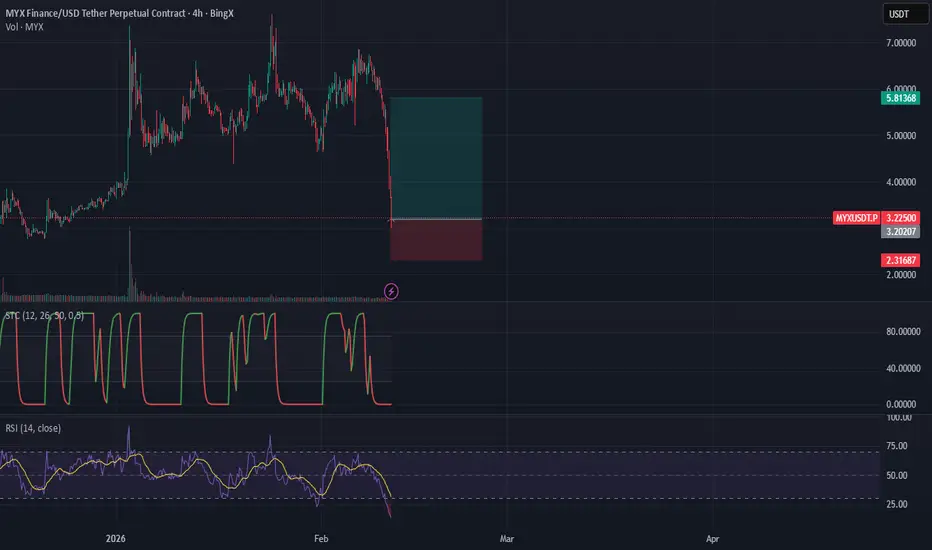
MYXUSDT | Aggressive Long from Extreme OversoldAfter a strong impulsive drop, price is trading around the 3.20–3.23 area while momentum indicators are reaching exhaustion levels.
On the 4H chart, RSI is near 15 and STC is already at the floor — conditions that often precede relief bounces.
This is an aggressive counter-trend entry, not a reversal call.
However, failure to bounce quickly would signal continued weakness, and under that scenario the exit must be fast.
The plan is simple:
capture the reaction, manage actively, and avoid overstaying.
High risk. Execution must be efficient.